Team:HSiTAIWAN/Notebook/FA/Cu

Oh hello there,I am Charlie,a trusty member of the "Herb Tasters" and also the brainiest E. coli in the colony.
I know all the secrets of Chinese herbs and their magical healing powers.
If you are up to a challenge,find me at team HSiTW at the jamboree.
I am the one in a straw hat,showing them pearls.I will be waiting.
Muhahahahaha
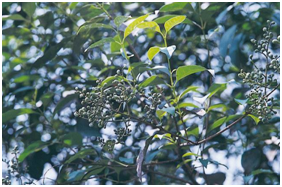
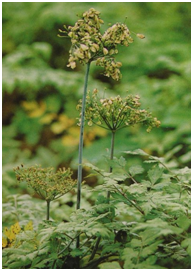
Hi there! My name is Nu Zhen Chi. This is how I look like.
Take a closer look; guess which part of me is used as medicine?
(1) the root 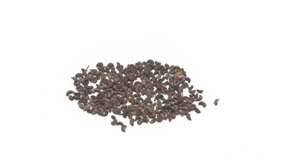
(2) the stem
(3) the leaf
(4) the seed
Ans.(4) the seed
Name: 女貞子 (Nu Zhen Chi)
Botanical Name: Ligustrum lucidum Aiton
I can treat people who are yin deficient, and liver problems that cause dizziness,cataract of the eyes,
lower back pain, premature graying of the hair and tinnitus.
Hello! My name is Chuan Xiong. This is how I look like.
Make a guess, which part of me is used as medicine?
(1) the root 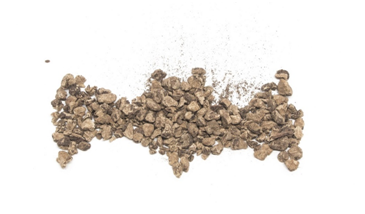
(2) the stem
(3) the leaf
(4) the seed
Ans.(1) the root
Name: 川芎 (Chuan Xiong)
Botanical Name: Ligusticum chuanxiong Hort
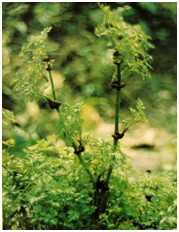
I help with blood regulation to prevent relevant to blood stasis and non-stop bleeding.I can also strengthen your qi circulation.
In addition, I relieve you of physical pain,
such as headaches, abdominal aches, chest pain, and muscle pain.
Finally, I free the ladies of menstrual disorders and amenorrhea.
What’s up? My name is Dang Gui. I can:
(1) stop coughing 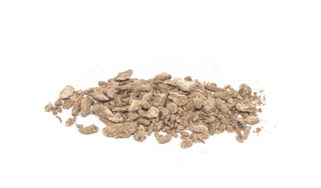
(2) regulate mense
(3) reduce internal heat
Ans.(2) Regulate mense
Name: 當歸 (Dang Gui)
Botanical Name: Angelica sinensis (Oliv.) Diels
I can remove blood stasis and clots, so I am usually used to regulate menses,lubricate intestines to correct constipation, reduce swelling, expel pus.
Reference
臧堃堂 (2005) 中華材輕百科-現代版本草綱目,山岳文化出版社,台北
Non-Profit Organization Brion Research Institute of Taiwan.
Chinese Herb Gallery. Jade Institute
Herbal Glossary. Shen-Nong- Chinese Traditional Medicine
Acknowledgement
Thank you for Non-Profit Organization Brion Resaerch Institute of Taiwan that provide us Chinese herbs and photos.
Functional Array
- Pb
- Cu
- As
- CYP
Chinese Medicine testing
- Pb
- Cu
- As
- CYP
Functional Array Cu
2016/05/07
Topic: Plasmid Functional ArrayResults
Material:
Centrifugation Machine
Pipetman
Bleach
Procedure:
1.Centrifuge the culturing tubes at 8000rmp for 5 minutes.
2.Remove excess liquid from the top, leaving E. coli chunks below.
3.Observe the fluorescence of thebacteria.
4.Add bleach to the liquidwaste to sanitize.
Results:
1.Copper(Cu2+)
The E. coli (k1555000) in copper ions showed obvious green fluorescence feature from 10-1to 102ppm (figure 1). However, the tube containing 103ppm seemed transparent (figure 2). Thus, we assumed that the bacteria died in the high concentration.

2.Lead (Pb2+)
The E coli (k1613017) expressed a vague red glow at the concentrationsof 10-1to 103 ppm (figure 3), but more visible in 102and 103ppm (figure 3).

To conclude, the two plasmids (copper and lead) appeared to be functional. Hence, we can continue with our projectand will begin to test herb samples.
2016/05/21
Topic: Plasmid Fluorescence Functional Array 2
Material:
LBBroth*6909*2μl
Antibiotic(Ampicillin)*7μl
Antibiotic(Chloramphenicol)*7μl
E. coli(K1555000)*14μl
E. coli(K1613017)*14μl
Lead ion solution(10-5, 10-3, 10-1, 101, 104ppm)*10μl each
Copper ion solution(10-5, 10-3, 10-1, 101, 104ppm) *10μl each
Eppendorf*14
ddH2O*20μl
Procedure:
1.Create a temporary germ-free environment.
2.Spray alcohol onto the pipetman before access because the pipetman will be contacting the broth.
3.Divide 13818μl of LB broth equally into two test tubes. These tubes would be further divided into smaller ones. Add 7μl of antibiotics and 14μl of bacterial fluid each. Make sure to vortex the bacterial fluid before adding it to the LB broth.
4.Divide the solution into 6 tubes. Each containing 990μl of fluid.
5.Add 10μl of ion solution at corresponding concentration levels. Add 10μl of ddH2O for negative control.The test sample with the highest concentration level will be the positive control.
2016/07/21
Topic: Transformation, Making Agarose
Material:
Plasmid DNA*100~200ng (k1613017, k608010, k608012)
DH5alfa competent cell*50*4μl
(competency: 108cfu/μg)
LB*16ml
Agarose powder*15g
ddH2O*800ml
Procedure:
(For transformation)
1.Measure the concentration of your plasmid in a NanoDrop spectrophotometer.
2.You should use 100~200ng of DNA, so dilute the plasmid until it reaches the ideal concentration.
3.Add 100~200ng of DNA to 50μl of DH5alfa competent cell.
4.Thaw the mixture in ice for 30 minutes (or 5 minutes to speed up the process)
5.Heatshock the bacteria in an incubator at 42°C for 45 seconds.
6.Ice recover the substance for 2~10 minutes.
7.Add 950μl of LB (or SOB) into the tubes containing bacteria.
8.Place the tubes in a shaker or rotating incubator at 225rpm for 1 hour.
9.Distribute the bacteria on a fresh agar dish with antibiotic. Dilute the broth if necessary. An ideal plate should contain about 100~200 colonies.
(For making agar)
1.Add agarose powder at the ratio of 15g to 1L of ddH2O.
2.Sanitize the bottle of agar in a sanitizing chamber.
3.Wait for the liquid agar to cool. The suitable temperature is around 50°C, which is when you can resist the temperature with your bare hands.
4.Divide the agar into clean petri dishes. Fill the dish about one third.
5.Store the agar dish in a 4°C freezer.
2016/07/22
Topic: Dry Culturing, Making Agar
Material:
Bacteria from agar dish*1 colony (k608010, k608012)
Antibiotic*50μl (Ampicillin, Chloramphenicol)
Agar dish*4
Coating bar*1
Agar powder*2*10g
LB powder*2*6g
ddH2O*2*400ml
Procedure:
(For making agar)
1.Add agarose powder at the ratio of 15g to 1L of ddH2O
2.Sanitize the bottle of agar in a sanitizing chamber.
3.Wait for the liquid agar to cool. The suitable temperature is around 50°C, which is when you can resist the temperature with your bare hands.
4.Divide theagar into clean petri dishes. Fill the dish about one third.
5.Store the agar dish in a 4°C freezer.
(For dry culturing)
1.Coat 50μl of antibiotic on each agar dish.
2.Wait for the antibiotic to dry.
3.Spread 100μl of bacterial fluid at the concentration of 1 and10-2 dilution respectively onthe prepared agar dishes.
4.Even out the fluid with a coating bar.
5.Incubate the bacteria in an incubator.
Results:

2016/07/22

2016/07/26

2016/07/28

2016/07/29
Topic: Fluorescence Intensity, Growth Rate Results
Results:
From graph 1, we can see that the growth rate of bacteria in a concentration of 5*10-4M (approximately 3.2*100ppm) to 5*10-14M (approximately 3.2*10-10ppm) does not differ. That is to say, that the survival rate, reproductive rate of our bacteria is not interfered. However, the growth rate of our positive control appears to be lower than the other samples. We are guessing it is because the strong green fluorescence disturbs the wave absorption at the wavelength of 600nm, which is commonly used to measure the optical density of bacteria. Keep in mind that for the purpose of easy labeling, the “positive control” here is not a genuine control of our testing of optical density, it is the positive control for fluorescence intensity testing (k608010). So, the true positive control for this experiment should be the “negative control”, which is the sample that contains no copper ion in its environment. Also from the same graph, we can see that the bacteria manipulate every hour and areespecially significant after 5 hours. From graph 2, we can examine that the growth of fluorescence intensity over the past 8 hours. The fluorescence expression rises rapidly after culturing for 5 hours, which matches perfectly that the fluorescence intensity does have a positive correlation with the amount of susceptible bacteria. Withal, we cannot be sure if it is the bacteria amount or the fluorescence itself that grows overtime that causes the expression to enhance. We are willing to do a further investigation. On bar chart 1, we can see not only the fluorescence change throughout time, but also the expression intensity in different concentration levels. The higher concentration, the stronger fluorescence is expressed. Since we have analyzed from optical density testing, we know that a concentration of 5*10-4M of copper ion does not affect the growth of E. coli and has the best expression; our further experiments will be designed to control the environment to be around 5*10-4M.


2016/07/29
Cu2+ ion OD raw data

Cu2+ ion OD data(org)

2016/08/16
Topic:Soc, LB Medium Testing
Material:
E. coli(k1555000, k806010)
SOCmedium
LB medium
Chloramphenicol
3ppm Copper ion solution
Procedure:
1.Culture 4 tubes of different bacteria in different medium.

2.Incubate the bacteria overnight.
3.Test the four bacteria sample’s optical density at a wavelength of 600nm.
4.Dilute the bacterial fluid until its O.D value reaches 0.5.
5.Duplicate the samples.
6.Culture the samples in a37°Crotating incubator at 80rpm.
7.Test the optical density and fluorescence intensity of the samples every hour.
8.Make a microscopic slide when the fluorescence intensity is steady.
Results:
The initial optical density of bacterial fluid is shown in table1, then, we diluted the samples into O.D =0.5 by the following formula in the table. In graph1, we can see thatthe growth rate of the four sample types increased overtime. Although the bacteria growth rate in SOC does not seem to be higher than that in LB medium, contrary to what we have done before.We tested that bacteria (DH5alfa) cultured in SOC tends to grow faster than in LB. We assume this result is because of the disturbance of fluorescence the bacteria give off. That is the green fluorescence interferes with the absorbance wavelength. Graph2 shows that fluorescence intensity is more expressed in LB than in SOC.
We guess it is due to the fact that bacteria grow too fast in SOC, causing them unable to produce adequate fluorescence protein. In figure1, we took photos of the four sample types under fluorescence spectrometry after 4 hours of culturing. There is significant difference of the fluorescence intensity. Also, there is a slight notice that the bacterial density is denser when cultured in SOC medium. Moreover, we know that thefluorescence intensity has a positive relation with the original bacterial count. Hence, we plan to increase the optical density after initial process, so that our fluorescence could be more luminous in the future.

2016/08/18
Topic: Liquid Culturing, Solution Preparation, Streak OutMaterial
Material:
SOC medium with antibiotic(Chloramphenicol)
E. coli (k1555000, k608010, k1106004)
Culturing tube
ddH2O
CuSO4·5H2O
Chloramphenicol
Agar dish(antibiotic-free)
Procedure:
1.Add 10ml of medium into culturing tubes.
2.Pick a single colony(k1555000, k608010, k1106004)
3.Culture overnight at rotation of 80rpm.
1.Measure 0.375g and 1.125 of CuSO4·5H2Osalt and add into 10ml of water to create copper ion solution in the concentration of 9ppm and 27ppm.
1.Move the agar dish from 4°Cfreezer to incubator for 40 minutes.
2.Spread 50μl of Chloramphenicol on the dish evenly.
3.Place the plate into incubator for 10 minutes to dry.
4.Streak out bacteria (k1555000) on the plate.
5.Incubate overnight.
2016/09/01
Topic: Fluorescence Intensity, Optical Density of E. coli in [Cu2+] of 10~20ppm
Material:
ddH2O
CuSO4·5H2O
加味逍遙散
SOC medium (with antibiotic)
Procedure:

Results:
The purpose of this experiment is to make up the gap between 9ppm to 27ppm, in which we find two very different growth curve pattern. Thus, we decided to choose the concentration levels of 10, 15, and 20ppm. In graph 1, we can see that the growth curve of each individual concentration level differs. And as the concentration level rises, the growth curve slackens correspondently. In graph 2, we can see that there are similar results in fluorescence intensity testing. The intensity is strongly relevant to the concentration of copper ions. In other words, the concentration levels are consistent to the growth curve and fluorescence expression. We can assume that there will be little gap between different concentration detected. This is excellent news to prove that our project and product can be quantitative.


2016/09/08

2016/09/16
Topic: EDTA at 3ppm Functional Array
Material:
EDTA
E. coli (k608012, k1555000, k1064004)
ddH2O
CuSO4·5H2O
SOC medium (with antibiotic)
黃岑
Procedure:
1.Add Cu2+ions ([Cu2+ 2.Place the solution in a 4°C freezer for 16 hours. 3. Results: From graph 1, we can assume that EDTA alone will not interfere with the expression of our E. coli. Also, we can see that the component of EDTA combined with copper ion can still regulate the fluorescence expression of our bacteria. From bar chart 1, there is a significant sign that some Chinese Medicine, Scutellariae in this case, indeed stifles the expression of fluorescence. So, to cope with this issue, adding a chelating agent can be ideal. In this case, our chelating agent EDTA can even enhance the intensity of our bacteria. In conclusion, our chelating agent is an appropriate solution to the problem of Chinese Medicine absorption.
