Team:JNFLS China/Experiments and Results
experiments and results
1 construction of Device 1.0 and 2.0
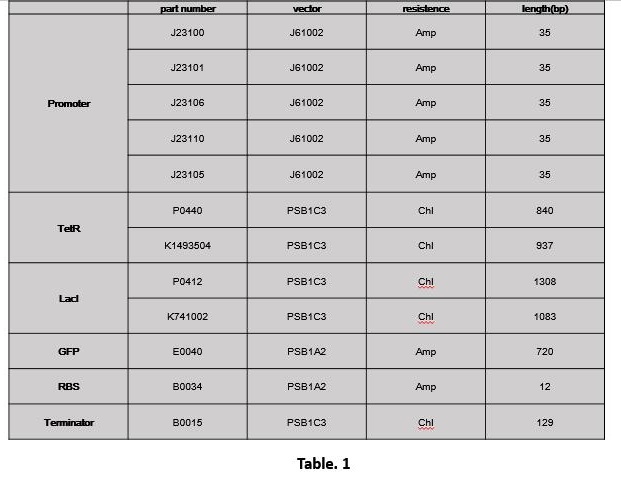
1.1 Extract part (Table. 1)
1.2 Synthesis of microRNA Ji'nan biosune Biotechnology Co. Ltd. has synthesized has-miR-34c microRNA for our team.
1.3 design and synthesis of anti-microRNA Ji'nan biosune Biotechnology Co. Ltd. has designed the anti-microRNA of has-miR-34c for our team. And Nanjing GeneScript biological science and Technology Co., Ltd. has synthesized segment sequence (Fig. 1). The anti-microRNA we synthesized includes 4 linkers which can Exact complemented with matured microRNA. Prefix and suffix at the end of segment are applied to the construction of our circuit.

1.4 construction of the plasmid Using the property of the prefix and suffix, we did the 2A assembly to construct our Device 1.0. and 2.0 step by step(Fig. 2).


2 Test Device 1.0
Device 1.0 microRNA would have a direct impact on GFP’s expression. Determining GFP’s fluorescence intensity differences will justify the content amount of microRNA (Fig. 3).

Transform the constructed plasmid in to E. coil Competent Cell. Transform microRNA into our system, continuous observation on fluorescence intensity’s change (Fig. 4).

According to the figure, between the time intervals of 12-19 Hours, subject device(transforming microRNA) result in significant lower fluorescence intensity than Negative Control (NC).
Therefore, we start to test the impact of different concentration microRNA . We separately add 10uM unrelated microRNA, 10uM target microRNA and 20uM target microRNA in to our device. Afterword, use Flow Cytometry to collect data at 10 Hours (Fig. 5).
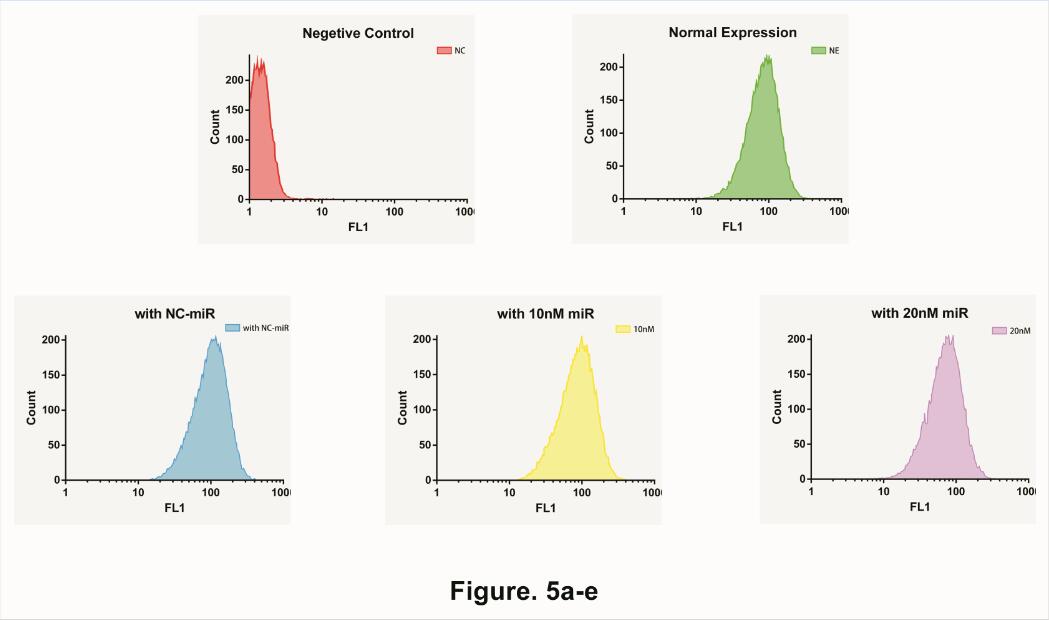

Needless to say, average expression rate shows a fine deceasing Gradient graphic, indicated that our system could not only determine the existence of microRNA but also the quantity of microRNA as well.
3 Test Device 2.0
Considering the feedback result from human practices, we designed Device 2.0
Before any experiment, we can’t determine which kind of repressor would provide the best initial intensity. Therefore we designed 8 combination devices including 4 constitutive promoters and 2 repressors (Fig. 6).

Plasmid and circuit: (Fig. 7)


We transformed well-constructed plasmid in to competent E. coli cell, then we got Device 2.0.
Finally, we shifted microRNA into Device 2.0 and did a continuing florescent intensity report (Fig. 8).

It can be inferred that for each system, an observation of an increase in the expression of the florescence intensity is detected due to the addition of the microRNA. Therefore, a conclusion that the addition of the microRNA to the system repressed the expression of the repressor could be made. We could say that the expectation of our prediction has appeared.
Therefore, in contrast of repressors with different promoter strengths (Fig. 9), we minus florescence intensity expressed by each system after the microRNA add to them with the florescence intensity each system expressed before the microRNA add into the system to get the Δ Florescence Intensity of each device. According to the figure, we can tell that in the first place, each "Δ Florescence Intensity-time" function figure of each device appeared to be a bell curve. This means that the window period of Device 2.0 still exists. Along the growth rate of the bacteria speed up, the division of the bacteria will make the florescence intensity decrease to the same level of the period when the microRNA hasn’t introduced to the system yet. Therefore, the Δ Florescence Intensity could be zero. Moreover, when the promoter strength of the repressor protein increase, "ΔFlorescence Intensity max" expressed a gradually decrease tendency. This decrease is especially well observed when we focus on the "Lacl-Plac NOT gate" gene circuit. Therefore, we can draw a conclusion that the different combination with different promoter strength could produce a theoretical ‘detectable minimum value ’. We could say that if the concentration of the microRNA is below this theoretical value, predictable low florescence intensity would occur because of the low concentration of microRNA's incapability of covering the amount of the repressor's production. In another word, retroactivity would occur in our experiment. When the promoter strength of the repressor gradually decreases, the "detectable minimum value" will decrease as well. This means the detectable range will increase. For microRNA with the same concentration, a combination with low promoter strength will output a relatively higher " Δ Florescence Intensity max" which perfectly fit our observation result.

To choose the most favorable repressor for Device 2.0, as the figure 9 present, Lacl-Plac genetic circuit provides a distinguishable data under different promoter strength. This means when the promoter strength is settled, for different microRNA’s concentration, there will be a great possibility for Lacl-Plac to produce very distinguishable data that could be applied to real detection and experiment. On the other hand, for the NOT gate circuit constructed by TetR-Ptet, it didn’t express a very distinguishable difference of Δ Florescence Intensity max when under the conditions with a clear difference in promoter strength. Still, we cannot say that the TetR-Ptet is not a favorable element for the construction of Device 2.0. Possible reason is that the system reached to the ‘detectable minimum value’ in advance due to the weak binding affinity of the repressors to the DNA. Therefore, maximum promoter strength will produce a high Δ value. In this case, the device is favorable to work under a condition of a low concentration of microRNA. Moreover, we think theoretically should exist a genetic circuit which repressor has strong binding affinity to the DNA and favors the condition with a high concentration of microRNA.
4 In summary
Even though so far our devices have been proved to be ‘well-functional’, we don’t regard them as the ultimate system. A big obstacle about "the window period" still lies between our system and more practical applications. This means our system has a certain period for data collecting and a huge disadvantage in real practices. Limited by the iGEM’s schedule, we cannot make any further development for now. But we do have a few ideas about our new and more powerful Device 3.0. To learn more it, please click the future design of our website
failure mode
In the experimental process, especially in the early period of the experimental process, we encountered some failures. To let you easier to consult and avoid these kinds of failures in your experiment, we list the failures we have experienced below.
1. About the experimental apparatus
We mainly use microplate reader for data acquisition. When we using microplate reader, we should set some obbligato parameters, such as “excitation wavelength”, “emission wavelength”, and the like. It is necessary to set up correct parameters to have some reliable data.
2. “co-transformation” or “transformation one by one” ?
As far as we know, no one has tried to transfer miRNA into the bacteria before, which is completely a new developing direction. We attempt to transfer miRNA with plasmid together by using thermal stimulation method in to the bacteria, but with little or no effect (Fig. 1).

Through summarizing the result of the experiment and drawing the support from the mathematical model, we found that when miRNA has an initial concentration within the bacteria, the concentration of miRNA decrease rapidly with the rapid growth of bacteria, and at the beginning of the period, the decline is fastest. It is believed that the effective concentration of miRNA has a “window period”, and if it works, it will only be effective at the beginning. By analyzing the data from the pre-experiment (PROOF OF FUNCTIONAL CONCEPT Fig. 2b), we could know that even normal expression of GFP cannot reach a high level of expression at the outset, instead after experience a period of “lag phase” the amount of GFP expression will increase. We believe that the lag phase, the plasmid concentration in the bacteria, the level of gene transcription on the plasmid and the expression of the bacteria themselves are in a very low state, making us miss the observation of miRNA effect during the “window period”, and after that the expression level of GFP will rise, but at that time, the concentration of miRNA almost cannot play any inhibitory effect. Therefore, we have the next problem-solving goal: to expend the “window period” of miRNA or to elevate the expression level of GFP earlier. The “window period” of miRNA is determined by the initial concentration of miRNA and the velocity of bacteria growth, and we cannot adjust that. Thus, the key problem is how to elevate the expression level of GFP earlier. Based on the previous analysis, we attempt to solve the problem by increasing the concentration of the gene on the plasmid in the initial state. There are two methods can reach the goal. First, integrating the entire expression box into the bacterial genome. Second, transfer the plasmid into the bacteria to make it into competence, and then transfer miRNA into bacteria. In either case, the concentration of the gene on the plasmid in the initial state has been increased. We have taken the second approach, and the experimental results show that we have obtained ideal observation, which prove that the analysis and the solution are effective (Fig. 2).

3. The research of “Promoter-antimicro-RBS” device
When we examine the effect of anti-miRNA insertions on GFP expression in the initial state, we obtained the following data (Fig. 3).

From the figure, both “promoter-antimicro-RBS” and “RBS-antimicro-GFP” could express GFP regularly, but the fluorescence intensity of “promoter-antimicro-RBS” increased significantly. We hypothesize that perhaps the sequence of anti-miRNA itself can act as a “strong promoter” or “strong RBS”, so as to increase the expression of GFP. Hence, we constructed additional gene circuits to prove our ideas. Also, we conducted fluorescence detection and obtained the following results (Fig. 4, 5).


It can be seen that the express ability of the system lose when promoter or RBS is removed from the expression. This suggests that the anti-miRNA sequence itself cannot act as an independent element to initiate transcription or translation of gene. Therefore, the increase in GFP expression of promoter-antimicro-RBS could be explained by the interaction between anti-miRNA sequence and promoter or RBS, which indicates that there are certain problems about the insulation between components, which is caused by the design itself. We hope that some team could develop a better solution to this problem in the future.
Next, we used a flow cytometry to collect data for more detailed view of the expression of the promoter-antimicro-RBS device. Flow cytometry is a method of measuring the size, density, fluorescence type, and fluorescence intensity of a event (single bacteria). We performed the same flow cytometry experiments on the same samples as Figure.5. The results are demonstrated below (Fig. 6, 7).


future design
About future:
In our exception, our device, with further development and verification, could finally achieve commercialization and become a portable, popular medical detect device. We hope that our device could become one of the standard configurations in community medical services just as same as current HBV Qualitative test paper.
Still, there are many problems need to be solved to fulfill such a goal, including problems like how to decrease the cost, how to make the system become portable and how to write appropriate instructions for common users. Among these problems, we will provide following illustration to answer one of the most important questions above all, how to remove the ‘windows period’ of our device.
Analysis and experiment demonstrated that our device has its own "window period" (specific time period for observing, if missed, there is no more chance for users to observe the real-positive result.). Current effort could make the outcome of RNA-interaction become visible, yet how to cancel the "dilution effect" comes with the growth of the concentration of microRNA.
We come up with the idea that in the genetic circuit we designed, GFP expression is related to microRNA concentration. That is to say, the concentration of microRNA directly defined the expression level of GFP. That is to say, they are coupled together. Therefore, to get away "dilution effect" appearing in the process, we have to "decoupling" the concentration of microRNA and expression level of GFP.
FimE Site-specific recombination has been applied by BIT-China in 2015. It has a vital trait that for same gene segment subject, it can and only can transcript for once. We expect the repressor which controlled by microRNA could regulate the expression of FimE. We placed promoter in Expression Cassettes of GFP at the interval between upstream and downstream sequences. (And the initial sequence of promoter is reversed) When the concentration of microRNA increase, the repressor's concentration would decrease. Therefore, FimE will have a normal expression and initiated the expression of GFP by re-reverse the promoter’s sequence to make it become functional. Afterward, when "dilution effect" of microRNA appeared and the concentration of which has decreased to an amount that below the effective concentration, by then, repressor would re-expressed and the FimE content will continuously decrease to zero. Yet the re-reversed promoter will not be affected and made the expression of GFP continue goes on.Therefore, even though a large concentration of microRNA is existed, promoter will not be consequently reversed by a long term existence of FimE content and the signal will be stable. So we designed an ideal genetic circuit (Fig. 1).

protocol
1. Reagent, medium and buffer
1) Lysogeny broth (LB): 10 g/L tryptone, 5 g/L yeast extract, 10 g/L NaCl (dissolve in water, pH7.0).2) LB agar plate: LB medium with 1.5% (w/v) agar.
3) Ampicillin: 50 μg/mL (dissolve in water).
4) Chloramphenicol: 35 μg/mL (dissolve in absolute alcohol).
5) Glycerol for storing strain: 50% (w/v, dissolve in water).
6) Tetracycline Hydrochloride: 0.1-60μg/mL (dissolve in water).
7) IPTG (Isopropyl β -D-1-Thiogalactopyranoide):0.1-10mM (dissolve in water).
8) 1XTAE buffer:40 mM Tris, 20 mM acetic acid, 1 mM EDTA (dissolve in water, pH8.0).
9) Alcohol for sterilization: 75%( w/v, dissolve in water).
2. Sterilization
High-pressure steam sterilizer for medium, water and other consumable materials (121°C for 20min). Filtration sterilization for liquid that is not stable at high temperature such as antibiotics.3. Culture collection
500 µL of overnight culture was mixed with 500 µL of autoclaved 50 % glycerol in 1.5mL EP tube and stored at -80 °C.4. Agarose gel electrophoresis
To check the size of DNA fragments or to purify DNA samples .0.8-1.2% gel(w/v, dissolve in TAE buffer); 120V, 20-30min.5. Miniprep
We use GENERAY GK1002-200 miniprep kit for minipreps according to manufacturer’s protocol.6. PCR Purification
PCR was purified using Gene-Foci PCR purification kit according to manufacturer’s protocol.7. Plasmid Construction
For constructing plasmids, we mainly have tried plasmid double restriction, PCR product restriction, T-A colony and overlap and use T4 ligase for ligations. All enzymes are from TAKARA.1) DNA fragment PCR (DNA polymerase: PrimeSTAR; DNA: x bp)
Reaction System (Table. 1)

Reaction Program (30cyc: 2-4) (Table. 2)

2) Double restriction
Reaction System (Table. 3)

Reaction Program: incubate in 37℃ for 1.5-3h; Then run agarose gel electrophoresis. DNA was visualized under UV using EB and suitable bands were excised.
3) Gel Extraction We use E.Z.N.A.® Gel Extraction Kit for extracting DNA from agarose gel sample according to manufacturer’s protocol.
4) T-A colony Materials: PCR product adding A tail, TAKARA pMD®18-T Vector
Reaction System (Table. 4)

Reaction Program: incubate in 16℃ for 10-16h.
5) Ligation Reaction System (Table. 5)

Reaction Program: incubate in 16℃ for 10-16h.
8. Chemical competent Cells
We use 0.1M CaCl2 to make DH5α chemical competent cells.1) Draw microbial lines of E.coli cells from glycerol stock on LB plate. Let grow at 37℃ overnight.
2) Pick out one single strain into 5mL LB and shake incubate (200rpm)for 12-14 hours at 37℃.
3) Inoculate 1 mL of overnight culture into 100mL LB shake incubate (200rpm)for 1.5-2 hours at 37℃ until OD600 is between 0.3-0.4.
4) Separate 100 mL cultures into 3 50mL EP tubes and put on ice for 30 min.
5) Spin down cells at 4000 rpm for 10 minutes at 4℃.
6) Pour off supernatant immediately after spinning ends and put cells back in ice.
7) Resuspend each tube cells in 15mL 0.1M CaCl2 solution by pipetting up and down gently.
8) Let resuspended cells sit on ice for 30 minutes.
9) Spin down cells at 4000 rpm for 10 minutes at 4℃.
10) Pour off liquid quickly.
11) Resuspend each tube cells in 1.2mL 0.1M CaCl2 solution and 0.8mL 50% glycerol.
12) Aliquot 100μl of resuspension into 1.5 mL EP tube on ice and take to -80 freezer.
9. Transformation
We use DH5α chemical competent Cells for common plasmid or cloning transformation.1) For plasmid transformation, we add 2-5µl DNA (about 100ng/µl) into 50µl competent cells. For linearized producttransformation, we add 10µl DNA (about 50ng/µl) into 50µl competent cells. Usually, we will make a control transformation.
2) The mix of DNA and competent cells incubates on ice for 30min, then is heat shocked at 42℃ for 1 min and incubate on ice for 5min.
3) Pipette 500µl LB to each transformation and shake incubate (150rpm)for an hour at 37℃.
4) Pipette each transformation on two plates for a about 50µl and 300µl plating.
5) Incubate plates for 12-15 hours at 37℃.
We need to pay attention that before adding LB into the tube, we should be carefully and gently.
10. Colony PCR (DNA polymerase: rTaq; DNA: x bp)
This protocol is frequently used in our examination of colonies, which are from linearized product transformations. Just pick single colonies from transformations to do a colony PCR. If the results are right, do the further experiments.
Reaction System (Table. 6)
Reaction Program (28cyc: 2-4) (Table. 7)

11. Transformation of miRNA
1) Mimics synthesized by Shanghai GenePharma co.ltd. were dissolved to 20μm with DEPC water.2) Thaw 50μl competent cells on ice until the last crystals disappear and mix gently.
3) Add 100ng plasmid DNA and 1-5μg miRNA mimics to the cells, flick the tube 4-5 times to mix cells and miRNA mimics. Do not vortex.
4) Place the mixture on ice for 30 min.
5) Heat shock at exactly 42℃ for exactly 90 seconds.
6) Place the tube on ice for 2min.
7) Pipette 500μl LB into the mixture.
8) Shake vigorously (200rpm) for 60 min at 37℃.
9) Add 2μl antibiotics and 1.5ml LB into the culture, continue to shake (200rpm).
12. Fluorescence assay with microplate reader and Flow Cytometry
1) Take glycerin cryopreserved bacterium, marking out on a LB plate, put the plate at 37 ℃ for 12 hours.2) Pick a single colony from the plate into 5 ml LB liquid medium, 37 ℃ 200 RPM shocking culture for 12 hours.
3) Take some bacterium liquid from step 2 (1:200 dilution) into 40 ml LB liquid medium, 37 ℃ 200 RPM shaking culture for 3 hours.
4) Take some bacterium liquid from step 3 (1:1000 dilution) into 40 ml LB liquid medium (appropriate revulsant is added synchronously if it is necessary), 37 ℃ 200 RPM shaking culture.
5) During the E.coli reproduction, 200μl sample is taken into the 96-well plate for fluorescence assay every 1 hour.
6) Before measuring fluorescence intensity, the microplate reader (BERTHOLD Technologies) needs go through a self-testing routine.
7) MicroWin 2000 software is used for measuring. Some parameters are as followings: 1 second counting time, 2000 lamp energy, excitation wavelength 450nm, and emission wavelength 530nm. Load plate and analyze fluorescence intensity.