Team:Michigan/Modeling
Mathematical models greatly aid in the prediction of the outcome of a biological design. Our mathematical model will be employed to test the efficacy of an aptamer based proximity-dependent ligation assay (PLA) in the detection of biomarkers. The proximity dependent ligation assay is an extension to the traditional immunoassay and can be used for protein detection with high specificity and sensitivity. The selectivity of the proximity dependent ligation assay is dramatically enhanced through the double recognition by two oligonucleotide-conjugated aptamers. We sought to optimize the aptamer-protein equilibria to promote the efficient and precise binding of the aptamer with the target molecule.
Using Wolfram Mathematica 10.4, a symbolic mathematical computation program, we will evaluate the minimum Gibbs Free Energy (G) of the aptamer-protein complex for different concentrations of the initial reactants: aptamer 1 ([A1]), aptamer 2 ([A2]), the connector oligonucleotide ([C]), and the target protein ([P]). By finding the minimum Gibbs Free Energy of the system, we will be able to find the concentrations of the final aptamer-protein complexes at chemical equilibrium. The possible aptamer protein complexes at chemical equilibrium include: unbound aptamer 1 [A1], unbound aptamer 2 [A2], unbound connector [C], unbound protein target [P], aptamer 1 and protein complex [A1P], aptamer 2 and protein complex [A2P], aptamer 1, aptamer 2, and protein complex [A1A2P], aptamer 1 and connector complex [A1C], aptamer 2 and connector complex [A2C], aptamer 1, aptamer 2, and connector complex [A1A2C], aptamer 1, protein, and connector complex [A1PC], aptamer 2, protein, and connector complex [A2PC], and the aptamer 1, aptamer 2, protein and connector complex [A1A2PC]. By calculating the concentrations of the above aptamer-proteins complexes at chemical equilibrium at different initial concentrations of the reactants, we can optimize the aptamer-protein equilibria to promote the sensitivity of the aptamer in the presence of the target protein, while lowering the formation of an aptamer-protein complex when there is a lack of the target protein (non-specific reaction formation).
The ligation of aptamer 1 to the biomarker is independent to the ligation of aptamer 2 to the biomarker; in other words, the binding of an aptamer to the protein would not make the binding of the second aptamer less or more likely. Only one aptamer molecule may bind at a time to a target molecule. We are assume that gibbs free energy of the reaction at equilibrium of the reaction will never exactly be zero. The dozens of aptamer-protein dynamics will although approach zero, will not be exactly zero.
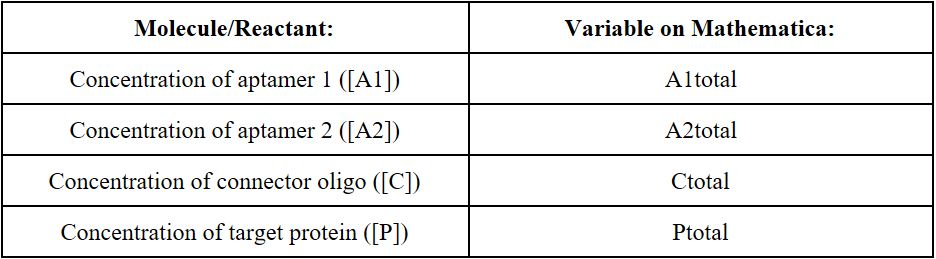
The mathematical model of the proximity dependent ligation involves the following molecules/initial reactants:
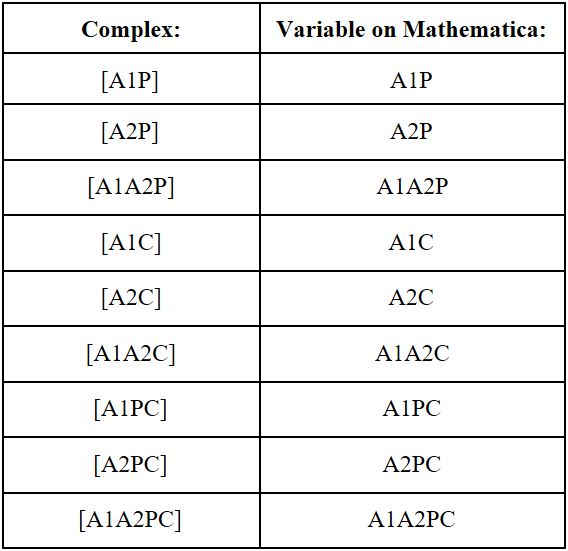
The mathematical model of the proximity dependent ligation involves the following complexes, as defined in the methodology section:
At chemical equilibrium, the total gibbs free energy of the system will be minimized. The equation for the Gibbs Free Energy of the aptamer-protein interaction is given by: G =(Go+RTln(Q)), where G denotes the gibbs free energy of the system, Go denotes the free energy change of the reaction under standard conditions (standard gibbs free energy of formation), R denotes the ideal gas constant (8.314 Jk-1 mol-1), T denotes the temperature in Kelvin, and Q denotes the reaction quotient, which is given by Q=[product(s)][reactant(s)], at the given state. Because aptamer interactions are often defined in terms of dissociation constants (kd), rather than by the standard gibbs free energy of formation (Go), we will define Go in terms of kd to calculate the gibbs free energy change. Because Go = -RTln(1/kd) at equilibrium, we can use kd to find Go.
Restrictions will be placed on this equation before the minimum gibbs free energy of the system is calculated. Our main restrictions are the mass balance equations. In other words, the concentration of aptamer one fed into the reaction (as reactants) should equal the amount that comes out of the reaction in the form of complexes. The same logic can be applied to the other three reactants (aptamer 2, connector, and protein), to provide a total of four restrictions (mass balance equations). Our final restrictions involve the fact that all concentrations have to be greater than or equal to zero (check “Code for Mathematica” for details).
Once our restrictions are in place, we will employ a built-in function on mathematica to find the minimum gibbs free energy of the system. The syntax for the minimization function is given by: Minimize[{f,cons},{x,y,…}]. We will find the minimum gibbs free energy of the system for several different concentrations of the reactants, in order to find the concentration that optimizes the aptamer-protein interaction.
To access a .txt file of the Mathematica code, click here.
In order to confirm that our mathematical model was, indeed, functional, we confirmed certain patterns that were to be predicted in the model. For example, a higher kd value would lead to less aptamer-protein complex formation. As expected, this pattern was seen in our model, as a 2-fold decrease in the kd value, generally led to a greater than 10-fold decrease in the protein-aptamer complex that was formed in the model.
Our mathematical model was also able to show that lower concentrations of the protein with constant concentrations of aptamer 1, aptamer 2, and the connector would lead to lower overall complex formation. In other words, when the protein is missing in the system, it is very unlikely for unspecific reactions to take place, and thereby give a false positive signal. As the protein concentration was gradually increased, the number of aptamer-protein complexes increased at an exponential rate, indicating the high sensitivity of the aptamer-protein complex. In other words, only a small amount of the target protein is needed for large numbers of the aptamer-protein complex to form, and provide a colorimetric output (indicating the presence of the target protein).
To further characterize our system, we would need to modify the concentrations of aptamer 1, aptamer 2, and the connector at a constant protein concentration to find the concentrations of the reactants that would optimize the formation of the aptamer-protein complex in the presence of a protein. Unfortunately, with our oversimplified model, no clear pattern was seen when the concentrations of aptamer 1, aptamer 2, and the connector were modified. We could only observe the general patterns that were seen when the protein concentration was modified. This pattern was also limited to a specific range of protein concentrations (insensible reactant concentrations and gibbs free energy values were seen at several protein concentrations that were tested). A more realistic mathematical model would be needed to quantitatively, rather than qualitatively, discern the complex behavior of the proximity dependent ligation assay.