Team:Sheffield/Model

|
MODELLING |

|
|---|


|
|
|
|
|
|||||
|---|---|---|---|---|---|---|---|---|---|
|
|
|
|
|
|

Introduction
Modelling aims to answer the following questions that cannot be accomplished by the wet lab due to time constraints and the lack of access to infected blood:
- What is the optimum ferric concentration needed in order to produce a change in ?
- How much time would it take to produce a change in fluorescence?
- Is the difference in fluorescence levels between bacterially and non-bacterially infected blood significant enough to be detected by a fluorometer?
In order to build a comprehensive model that takes into account the initial concentrations of ferric enterobactin and , and connect them to the change in GFP concentration, the block diagram above was drawn to split the system into various inputs and outputs. Each block represents a set of equations that connects the input to its subsequent output. The code for each block is made separately and is then easily connected together.
- Prepare Stock: calculates the concentration of ferric enterobactin complexes (FeEnt) and iron-chelator complexes (FeChe) when known amounts of iron (Fe3+), enterobactin (Ent) and iron (Che) are added together.
- FeEnt Binding: calculates the concentration of leftover FeEnt after lipocalin (Lip) from the blood sample has bound to FeEnt.
- Iron Uptake: calculates the increase in free intracellular iron (Fe2+) over time given the concentration of unbound FeEnt.
- Fur Binding: calculates the concentration of dimers that are bound to exactly 2 Fe2+ molecules (FeFur2) given the concentration of free Fe2+.
- Transcribing RyhB: the change in production over time as the concentration of FeFur2 changes.
- RNAi: models RyhB-mediated and calculates the change in GFP concentration over time when RyhB concentration changes.
The blocks can be split into three different sections depending on the type of equations that govern them. Please click on each section to find out more. The block diagram will highlight the blocks that are involved in each section. All modelling was done using MATLAB and the codes used can be downloaded by clicking on the links in the section below.
Codes
OptimumEnt.m - This script finds the maximum difference between viral and bacterial blood in a 2-hour period for a range of Ent concentrations. Uses all the functions below.
CellIron.m - This script calculates the concentration of FeEnt leftover after a stock solution of known FeEnt concentration has bound to Lip from blood with bacterial or viral infection. Uses the functions FeEntChe and LipoBinding.
FeEntChe.m - This script calculates FeEnt concentration from initial concentrations of Ent, Fe and Che.
LipoBinding.m - This function calculates the concentration of FeEnt leftover from a stock solution after Lip from a blood sample has bound to it.
RNAi_Model.m - This function takes the extracellular Fe concentration (FeOut) as an input and calculates the change in RyhB, GFP-mRNA, GFP, intracellular Fe and FeOut over time. Uses the functions RNAi_DE_System and FurBind.
RNAi_DE_System.m - This function calculates the change in RyhB, GFP-mRNA, GFP, intracellular Fe and extracellular Fe over 1 time step. Uses the function FurBind.
FurBind.m - This function calculates the concentration of FeFur2 dimer and pInit (the probability of RyhB transcription initiation) from a given concentration of free Fe(II) in the bacteria cell.
References
- DeBusk, Ruth; et al. (2002). "Ethylenediaminetetraacetic acid (EDTA)". University of Maryland Medical Center.
- Holleman, A. F.; Wiberg, E. (2001). Inorganic Chemistry. San Diego: Academic Press. ISBN 0-12-352651-5.
- Craven, C. J. (2016). Interviewed by Ford, James Grimshaw, Wai Ching Lin, 12 August.
- Carrano, Carl J.; Kenneth N. Raymond (1979). "Ferric Ion Sequestering Agents. 2. Kinetics and Mechanism of Iron Removal From Transferrin by Enterobactin and Synthetic Tricatechols". J. Am. Chem. Soc. 101 (18): 5401–5404. doi:10.1021/ja00512a047
- Goetz, D.H., Holmes, M.A., Borregaard, N., Bluhm, M.E., Raymond, K.N. and Strong, R.K., 2002. The neutrophil lipocalin NGAL is a bacteriostatic agent that interferes with siderophore-mediated iron acquisition. Molecular cell, 10(5), pp.1033-1043
- Venge, P., Håkansson, L.D., Garwicz, D., Peterson, C., Xu, S. and Pauksen, K., 2015. Human neutrophil lipocalin in fMLP-activated whole blood as a diagnostic means to distinguish between acute bacterial and viral infections. Journal of immunological methods, 424, pp.85-90.
- Semsey, S., Andersson, A.M., Krishna, S., Jensen, M.H., Masse, E. and Sneppen, K., 2006. Genetic regulation of fluxes: iron homeostasis of Escherichia coli. Nucleic acids research, 34(17), pp.4960-4967.
- Thulasiraman, P., Newton, S.M., Xu, J., Raymond, K.N., Mai, C., Hall, A., Montague, M.A. and Klebba, P.E., 1998. Selectivity of ferric enterobactin binding and cooperativity of transport in gram-negative bacteria. Journal of bacteriology, 180(24), pp.6689-6696.
- Faraldo-Gómez, J.D. and Sansom, M.S., 2003. Acquisition of siderophores in gram-negative bacteria. Nature Reviews Molecular Cell Biology, 4(2), pp.105-116.
- Santillán, M. & Mackey, M.C., 2004. Influence of catabolite repression and inducer exclusion on the bistable behavior of the lac operon. Biophysical journal, 86(3), pp.1282–92. Available at: http://www.ncbi.nlm.nih.gov/pubmed/14990461 [Accessed September 13, 2016].
- Arbel-Goren, R. et al., 2016. Transcript degradation and noise of small RNA-controlled genes in a switch activated network in Escherichia coli. Nucleic Acids Research.
- Imperial/Wet Lab/Results/Res1.3 - 2007.igem.org [Internet]. 2007.igem.org. 2007 [cited 17 October 2016]. Available from: https://2007.igem.org/Imperial/Wet_Lab/Results/Res1.3
Binding Reactions
Binding Reactions are governed by thermodynamic equations. The goal of modelling binding reactions is to find out the equilibrium concentration of the bound and unbound molecules. The rate at which the molecules bind to each other does not affect the overall time taken by the reporter system, as the pseudo steady-state approximation is assumed. In other words, as the transcription and translation of genes happen at a much longer timescale, it is assumed that the binding reactions would have reached equilibrium in this timescale and there is no change in the concentration of the bound molecules.
Given a general binding reaction shown below, where ligands A and B bind to form the complex AB, the dissociation constant Kd is defined as the ratio of unbound ligands ([A][B]) to bound complexes ([AB]). The concentrations here reflect the concentrations at equilibrium and not the instantaneous intermediate concentrations. Each binding reaction in the block diagram is a variation of this general binding reaction. Their nuances and how it affects the equilibrium concentrations are explained below. The dissociation constants and initial concentrations used are displayed at the end of this section.

Prepare Stock
Fe3+, Ent and Che solutions are mixed together to form the stock solution. Ent and Che both bind to Fe3+ and the equations for their dissociation constants are shown below. This differs from the general binding reaction as there are two receptors binding to the same Fe3+ ligand; the equilibrium concentration of Fe3+ should be the same for both equations.

Che here is assumed to be EDTA, as it is the most common iron chelator used1. It is assumed that 1 EDTA molecule binds to 1 Fe3+ molecule2). The dissociation constants for Ent and Che to Fe are 10-52 M-1 and 10-25 M-1 respectively. The working concentrations of Ent, Che and Fe are within micromolar (μM) concentrations. Since the dissociation constants are at least 19 orders of magnitude smaller than the working concentrations, it can be assumed that 99.9% of Ent will be bound to Fe and of the remaining Fe, 99.9% of it will be bound to Che3. This approximation holds true if the initial Fe concentration is in excess of Ent concentration and Che concentration is in excess of Fe concentration.
Following the assumptions above, the table below shows the initial concentrations of Ent, Fe and Che added and the equilibrium concentrations of the complexes FeEnt and FeChe.
| Molecule | Initial Concentration / nM | Equilibrium Concentration / nM |
|---|---|---|
| Ent | 200 | 0 |
| FeEnt | 0 | 200 |
| Fe | 1 000 | 0 |
| FeChe | 0 | 800 |
| Che | 3 000 | 2 200 |
Figure 1. Table showing the initial and equilibrium concentrations of enterobactin (Ent), ferric enterobactin (FeEnt), ferric ions (Fe), iron bound chelator (FeChe) and chelator (Che).
This model was able to inform the wet lab on the concentrations of Ent, Fe and Che to be added in order to prepare a given concentration of FeEnt.
FeEnt Binding
FeEnt binding to lipocalin (Lip) follows the general binding reaction. Thus its dissociation constant is defined as follows.

Using the equilibrium concentration of FeEnt calculated in Prep.Stock above and the concentration of Lip for patients with bacterial and nonbacterial infections (see parameters), the equilibrium concentration of unbound FeEnt is 10.4 nM for patients with bacterial infection and 18.05 nM for patients with nonbacterial infection.
Fur Binding
Fur monomers bind to 1 Fe2+ molecule each, but dimerise upon iron binding to produce the Fur dimer (FeFur2). The equation for the dissociation constant of Fur binding to Fe is shown below. The concentration of FeFur2 can be calculated by halving equilibrium concentration of the FeFur complexes, since it is assumed that dimerisation of 2 FeFur monomers happens much faster than the binding of Fur to Fe. We think this is a valid assumption as E. coli has to respond quickly to changes in Fe2+ concentrations and would not be able to do this efficiently if it is hindered by the rate of dimerisation.

Parameters
| Parameter | Value | Reference |
|---|---|---|
| Kd of Fe and Ent | 10-52 M-1 | (4) |
| Kd of Fe and Che | 10-25 M-1 | (2) |
| Fe Concentration | 1 µM | (3) |
| Ent Concentration | 200 nM | Arbitrary, taken as 10 times Lip Concentration (Bacterial) |
| Che Concentration | 3 µM | (3) |
| Kd of FeEnt and Lip | 0.43 nM-1 | (5) |
| Lip Concentration (Bacterial) | 20 nM | (6) |
| Lip Concentration (Non-bacterial) | 4 nM | (6) |
| Fur Concentration | 5 µM | (7) |
| Kd of Fe and Fur | 20 µM-1 | (7) |
Iron Uptake
Iron Uptake is governed by enzyme kinetics. takes up ferric enterobactin from the external environment through its double membrane using a series of enzymes. Among these enzymes, it has been shown that the enzyme FepA present on the outer membrane is the rate-limiting reaction8. In other words, it can be assumed that the rate of ferric enterobactin uptake depends on the rate of FepA activity only. While it is the Fe3+ ion that is bound to enterobactin, it is oxidised to free Fe2+ ions in the process of transportation into the cytoplasm9.
The rate of FepA activity can be represented by the Hill equation below. It depends on FeEnt concentration and bacteria concentration, as well as the Michaelis-Menten constant and the Hill constant of FepA8.

A graph of the reaction rate against a range of FeEnt concentrations is plotted in figure 2 in order to find the concentration of FeEnt that is saturating. This helps to inform the wet lab on the concentration of FeEnt that they should use when testing the uptake of siderophores between the wild type strain (W3110) and the mutant enterobactin-deficient strain (JC28) (see Reporters). From the graph, it can be seen that the saturating conditions is around 2 μM of FeEnt. In order to produce the FeEnt solution at such a concentration, the Prep. Stock block explained above helps to calculate the concentration of Fe and Ent solutions that need to be added.

Figure 2. Graph of reaction rate against extracellular ferric enterobactin (FeEnt) concentration.
Using the same Hill equation above, a graph of the extracellular FeEnt concentration over time can be obtained. Since the decrease in extracellular FeEnt is equal to the increase in intracellular Fe2+, a graph of intracellular Fe2+ over time can also be obtained. Figure 3 shows the result. The concentration of intracellular Fe(II) is higher than the extracellular FeEnt concentration as the total cell volume is smaller than the total volume of the solution. Since the device should take less than 2 hours, only the first 2 hours of iron uptake is shown.

Figure 3. Graph of iron uptake over 2 hours. An arbitrary ferric enterobcatin (FeEnt) concentration of 100 nM was used. Left: concentration of extracellular FeEnt; right: increase in intracellular free Fe2+.
The results show that there is a difference of around 40 μM of Fe2+ between bacterially infected blood and non-bacterially infected blood. This value does not reflect the absolute concentrations of Fe2+ in the cell but the amount of Fe2+ that is taken up. This value will change depending on the initial concentration of ferric enterobactin. Here, an arbitrary concentration of 100 nM FeEnt was used. Whether this is significant enough to produce a difference in fluorescence remains to be elucidated in the following sections.
Parameters
| Parameter | Value | Reference |
|---|---|---|
| Maximum FepA Rate, Vmax | 1.68×10⁻¹² mol /sec /109 cells | (8) |
| Michaelis-Menten constant of fepA, Km | 394 nM | (8) |
| Hill Constant of fepA, n | 3 | (8) |
| E. coli Concentration | 300 109 cells /L | Data from Growth Curves |
| Average volume of an E. coli cell | 8×10-16 L | (10) |
| FeEnt Concentration (Bacterial) | 80.1 nM | From FeEnt Binding |
| FeEnt Concentration (Non-bacterial) | 96.0 nM | From FeEnt Binding |
GFP Expression
GFP Expression uses differential equations to model the production and degradation of RyhB, GFP and GFP. Hfq proteins facilitate RyhB-mediated degradation by helping to bring together RyhB and GFP mRNA. However, because it has been shown that is largely dependent on the stoichiometry between the sRNA (RyhB) and the target mRNA11, it can be assumed that the binding of Hfq proteins is not a limiting factor. Thus, only the key molecules RyhB, GFP mRNA and GFP are modelled. The differential equations for these are shown below, where s, m and M represent the concentrations of RyhB, GFP mRNA and GFP respectively. α and β represent the production and degradation rate respectively.
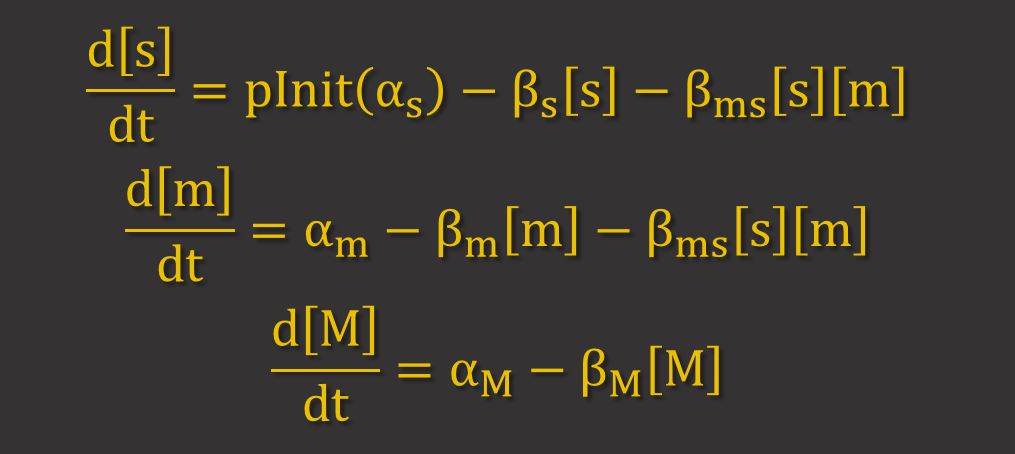
The term βms[s][m] represents the higher degradation rate due to RNAi. This term implies that the proportion of mRNA and srRNA that are degraded by RNAi depend on their concentrations.
pInit is the probability that sRNA transcription will be initiated. This variable is absent from mRNA transcription as it is assumed that transcription will be initiated at every time step. When there is a higher concentration of FeFur2, there is a higher chance that FeFur2 will bind to the Fur box and a lower probability that srRNA is transcribed. The probability of transcription is dependent on the affinity of FeFur2 for its DNA binding site and is calculated by the formula below.

By combining this formula with the model for Fur Binding, a graph can be produced showing how free Fe2+ levels affect pInit (figure 4). It can be seen that RyhB transcription drops sharply with an increase in Fe2+ and is reduced by 90% when the concentration of free Fe2+ falls to 2 µM. This suggests that RyhB does not display a range of expression that is proportional to the levels of free Fe2+ but rather, it acts more like a switch. The srRNA is switched on under low iron conditions and switched off under high iron conditions. When determining the optimum concentration of ferric enterobactin to use in our system, we should aim for a concentration that results in RyhB being switched off in the case of a bacterial infection and switched on in the case of a non-bacterial infection.

Figure 4. Probability of RyhB transcription against intracellular Fe(II).
The intracellular Fe2+ levels in a cell are not only affected by the rate of iron uptake, but also the production of ironbound proteins, which remove Fe2+ from the pool of free Fe2+. So the differential equation used to model Iron Uptake is modified to include this.

In the differential equation above, the first term represents the increase in intracellular Fe2+ levels due to iron uptake. It contains the Hill equation for iron uptake (see Iron Uptake), multiplied by a variable, which takes into account the change in iron uptake machinery due to the levels of FeFur2. This is because under high levels of Fe, FeFur2 negatively regulates iron transport proteins7. The second term represents the removal of free Fe2+ due to the production of ironbound proteins. These proteins are down regulated when Fe levels are lower than Kcut. [m] represents the mRNA that is regulated by RyhB and the constant b represents mRNA that is not. Through testing different values and checking if the resultant steady-state Fe levels matches the Fe levels of the wild type strain (found through our ICP measurements), this constant is found to be 0.435×10⁻³.
As our mutant strain is unable to produce Ent, its rate of iron uptake would be reduced. Vmax should be lowered to compensate for this. By comparing Fe levels produced by the model to the Fe levels found in our mutant strain (found through our Ferene Assay), Vmax is found to be reduced by 39.6%. It should be noted, however, that when an FeEnt solution is added, the mutant strain would really solely on the FepA transport mechanism and so, Vmax would not be reduced in this case.
Using this model of GFP expression, we have found the GFP concentration at steady-state (assumed to be 24 hours) was the same regardless of whether the bacteria were grown in high (100 mM) or low (10 µM) iron. This matches the experimental results found (see Fur Reporter). When the transcription rate for a strong promoter was used, the model showed a higher level of steady-state GFP concentration, which also matches our experimental results (see Fur Reporter). Comparing the model with experimental results serve as a nice way to validate our model and ensure that it is accurate before we use it as a tool for prediction.
After coding for these different parts of the model separately, it is now time to link all the blocks together to produce some results. Please click on Summary above to see the information that modelling has provided for the team.
Parameters
| Parameter | Value | Reference |
|---|---|---|
| RyhB transcription rate, αs | 4.153×10⁻⁹ M min-1 | (11) |
| RyhB degradation rate, βs | 0.02 min-1 | (11) |
| mRNA transcription rate, αm (Med promoter) | 4.153×10⁻¹⁰ M min-1 | (10) |
| mRNA transcription rate, αm (Str promoter) | 4.153×10⁻⁹ M min-1 | (11) |
| mRNA degradation rate, βm | 0.102 min-1 | (11) |
| Protein translation rate, αM | 0.1 min-1 | (10) |
| Protein degradation rate, βM | 4×10⁻³ min-1 | (7) |
| mRNA degradation rate due to RNAi, βms | 8× mRNA degradation rate βm, 0.816 min-1 | (11) |
| Kff | 0.02×10⁻⁶ M | (7) |
| Kt | 0.55×10⁻⁶ M | (7) |
| Kcut | 0.1×10⁻⁶ M | (7) |
| Free Fe(II) Concentration (W3110) | 16.6 µM | Data obtained from Ferene Assay |
| Free Fe(II) Concentration (JC28) | 5.03 µM | Data obtained from Ferene Assay |
Results
The fluorometer is able to detect a 0.1 nM change in GFP concentration12. Thus, after adding the blood sample, there has to be an increase in GFP concentration of at least 0.1 nM. The difference in fluorescence between blood with a bacterial and a viral infection also has to be at least 0.1 nM.
A range of different enterobactin concentrations were tested to find the concentration that is able to produce the biggest difference in GFP concentration between a blood sample with a bacterial infection compared to a sample without. For each Ent concentration, the maximum difference in GFP concentration in 2 hours is shown in the graph below. A medium promoter is used.

Figure 5. Maximum difference between non/- bacterial infections for different initial enterobactin concentration (Ent). A medium promoter was used.
As we can see, the difference between the two types of infections is negligible. The maximum difference between them is around 0.3 pM, which is not enough to be detected by a fluorometer. We then tried using a stronger gfp promoter to see if it would give better results.

Figure 6. Maximum difference between non/- bacterial infections for different initial enterobactin concentration (Ent). A strong promoter, which had 10× the transcription rate of the medium promoter, was used.
The strong promoter resulted in around a tenfold increase in the maximum difference. However, the maximum difference of 3 pM is still too small to be detected by a fluoromter. Since a tenfold increase in mRNA transcription rate resulted in a tenfold increase in the maximum difference, what the mRNA transcription rate would have to be in order to produce a detectable difference in GFP concentration.
We found out that the mRNA promoter would have to be ×100 stronger than the RyhB promoter in order for a detectable difference in GFP concentration. The graph of the maximum difference between non-bacterial and bacterial infections for a range of initial Ent concentrations at this promoter strength is shown below.

Figure 7. Maximum difference between non/- bacterial infections for different initial enterobactin concentration (Ent). A promoter, which had 100× the transcription rate of the ryhB promoter, was used.
This shows that a strong promoter is necessary for our system to work and that it is important that the mRNA promoter is around 100× stronger than the srRNA promoter. The ryhB promoter is already a strong promoter7 and further experiments are necessary in order to see if our reporter system can be designed with the necessary promoter.
If such a promoter were to be designed, we would then use figure 7 to find the optimum Ent concentration. Ent concentrations of 1.5 µM and higher have a negligible difference in GFP concentration between bacterially infected and non-infected blood. This is not surprising as saturating conditions for iron uptake is occurs at 2 uM (see Iron Uptake) so it would result in maximal increase in GFP concentrations and negligible differences. The graph also shows high levels of fluctuations. This could be due to the complex interplay between the iron uptake mechanism, RyhB regulation and intracellular Fe levels. It could also be caused by precision errors since time is discretised, i.e. concentrations are calculated in 1sec time intervals. The maximum difference occurred at 280 nM. At this concentration of Ent, the difference between the infection types would vary over a 2-hour period. The graph of the differences is shown in figure 8 below.

Figure 8. Graph of the difference between bacterial and non-bacterial infection over time for an initial enterobactin concentration of 280 nM.
The difference increases until it reaches a maximum at 77 mins. It then decreases, possibly because the bacteria would be starting to reach its steady-state by this time. The minimum detectable difference is 0.1 nM and this occurs at 12 mins. Therefore, if the right construct with the right promoter strength can be designed, our system would be able to detect the difference between blood with viral and bacterial infection in around 12 mins, which is near the desired amount of time specified by the doctor(s) that we spoke to (see Policy & Practices).
A limitation of this model is that it only takes into account the sensitivity of the fluorometer that is available in labs and does not necessarily reflect the sensitivity of the contained in our device (see Final Device). An extension to modelling would be to have some experimental data that calibrates GFP concentration to changes in resistance of the LDR so that we are able to see how changing variables like enterobactin concentration affects the electrical signal produced. Another extension to modelling would be to test the noise of the system to see whether the changes in fluorescence can be detected over the potential noise that this system has.

