Lysostaphin
Summary
Lysostaphin is an bacteriolytic enzyme which disrupts the peptidoglycan layer of S. aureus. By expressing and attaching lysostaphin to spider silk, we are aiming to both lyse bacterial cells and disrupt the biofilm.
Assembling a construct for recombinant expression of Lys [✔️]
Demonstrating expression and investigating solubility of Lys in E. coli [✔️]
Demonstrating bactericidal activity of Lys [✔️]
Demonstrating efficient biofilm inhibition by Lys [✔️]
Demonstrating efficient biofilm dispersal by Lys [✔️]
Adding Sortase and His tags to the expression construct [❌]
Expressing and purifying a construct with added tags [❌]
Attaching Lys to spider silk [❌]
Demonstrating efficient biofilm dispersal of Lys fused spider silk [❌]
Results
Assembling a construct for recombinant expression of Lys
To generate a construct that can be expressed in E. coli which consists of a T7 promoter and the coding sequence of Lys. The construct is made through a 3A Assembly method which allows for two or more BioBricks to be ligated into one vector. Here, the T7 Promoter BBa_K525998 and the Lys encoding sequence BBa_K748002 was initially ligated into pSB1K3. In order to identify whether the ligation was a success, the ligation product was transformed into E. coli TOP10 or BL21(DE3) cells.
Digestion: First attempt [❌]
In the initial attempt to assemble the pSB1C3-T7-Lys construct, the lysostaphin BioBrick was first amplified using VF2 and VR primers. The PCR product was then digested with XbaI and PstI. To optimise the digestion procedure we tried single and double digestions of the lysostaphin PCR product. In this first attempt, the digestions were unsuccessful and the sizes of the single and double digested were not consistent. To exclude human error, the same procedure was repeated.
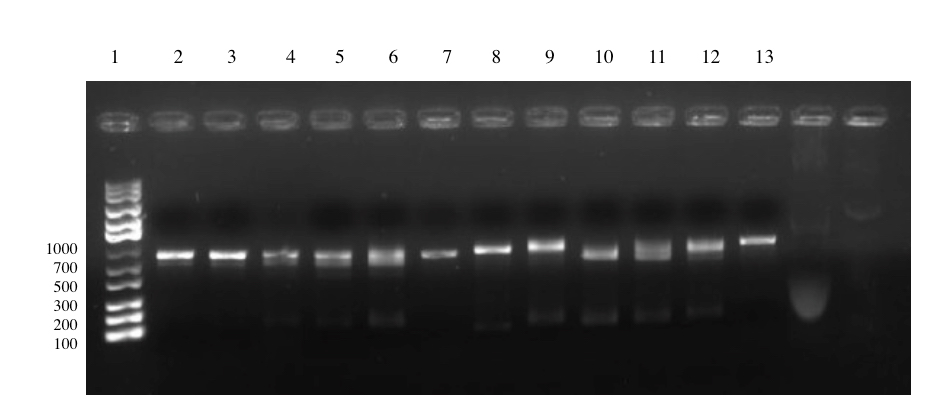
Digestion: Second attempt [✔️]
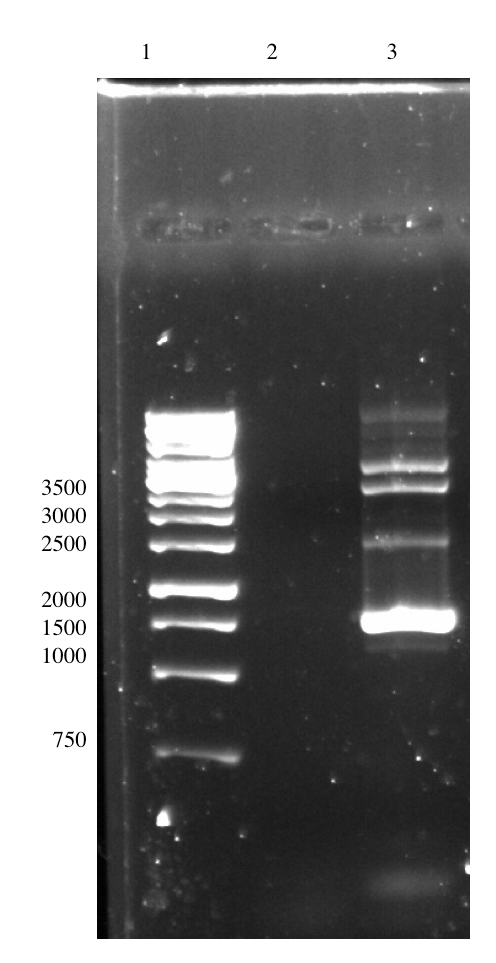
In the second attempt of digestion, the double digestions showed smaller sized bands when compared to the single digestions (well 10-12). The three bands however showed smears which could suggest that the sample was only partially digested. Bearing this in mind, we continued to gel purify the digested products and ended with a purified DNA product of 5.1 ng/μl at 747 bp.
Ligation and Transformation pSB1K3-T7-Lys: First attempt [❌]
In order to perform the 3A assembly, the T7 Promoter and pSB1K3 were also subjected to double digestions with the correct restriction enzymes. The T7 was digested with EcoRI and SpeI whereas the pSB1K3 was digested with EcoRI and PstI.
Together the three digested products were ligated and transformed into chemically competent E. coli TOP10 cells. The first attempt of the ligation procedure showed positive results, as mentioned in Lab book 4.
The colonies were subcultured into LB medium and kept as glycerol stocks. The plasmid from the bacterial was extracted and later confirmed through sequencing. The result of the sequencing however showed that the insert was not lysostaphin but in fact Esp that had contaminated the lysostaphin samples. We suspect that this cross-contamination emerged when we used digested backbones from pSB1K3-T7-EB. At that time we had ran out of the the linearized pSB1K3 stock and resulted in recycling the stock we had from the pSB1K3-T7-EB. We suspect that the during the digestion of pSB1K3-T7-EB or during the gel purification procedure, undigested pSB1K3-T7-EB was still present in the sample. And it was this construct that had been transformed instead.
To avoid further cross-contamination, we went back from the beginning and digested plasmids of the lysostaphin BioBrick (BBa_K525998).
Digestion: Third attempt [✔️]
As previously done, the lysostaphin plasmid was digested with XbaI and PstI. The result of the double digestion is shown from the gel below.
Ligation and Transformation of pSB1A3-T7-Lys: First attempt [❌]
In this attempt, we decided to use the ampicillin backbone pSB1A3. The ligation procedure was carried out as before and continued with transformation into E. coli TOP10 cells for maximum efficiency. Unfortunately, either the ligation or the transformation procedure had failed and no colonies grew.
We suspect that the Ampicillin concentration on the plates may have been too high, and we decided to change the concentration from 100 μg/ml to 50 μM/ml.
Ligation and Transformation pSB1A3-T7-Lys: Second Attempt [❌]
This time we used a lower ampicillin concentration on the plates, but again no colonies were observed after the transformation procedure.
Ligation and Transformation of pSB1A3-T7-Lys: Third and Fourth Attempt [❌]
We repeated the ligation and transformation procedure with the same conditions another two times (as described in lysostaphin lab book week 7), however we were still unsuccessful.
To circumvent the same unwanted outcomes we resorted to changing several of the procedural steps in both the ligation and transformation process. We first increased the insert to vector ratio to (10:1). We then ligated the fragments overnight at a low temperature of 16 oC instead of 10 minutes at room temperature. The low temperature favored a slower kinetic which ensured an optimum balance between the enzyme stability and annealed DNA overhangs [1]. We also performed transformation on both BL21(DE3) and TOP10 cells to increase chances of a successful transformation. The ligation product was also subjected to purification to remove the salts and enzyme from the reaction which served to improve transformation efficiency.
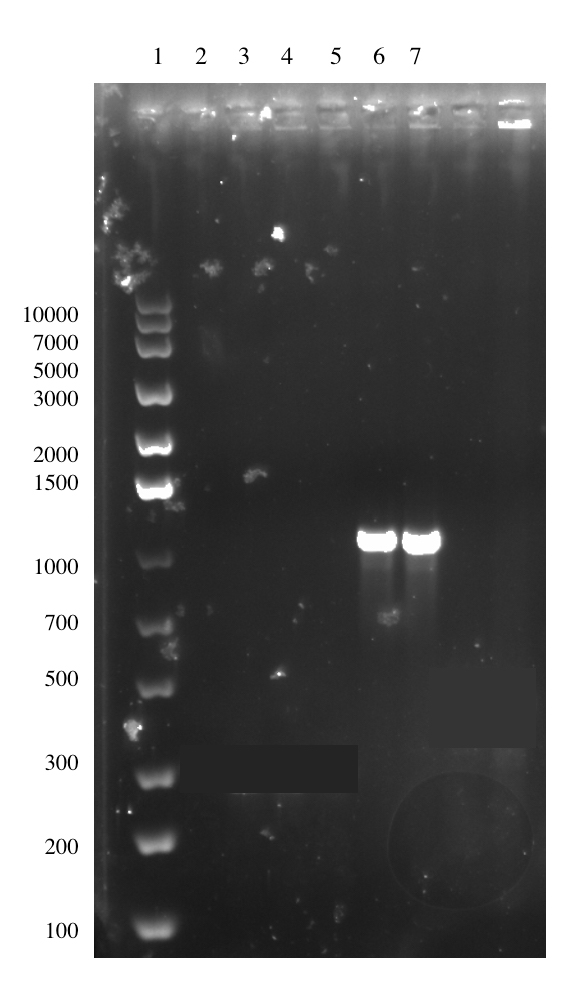
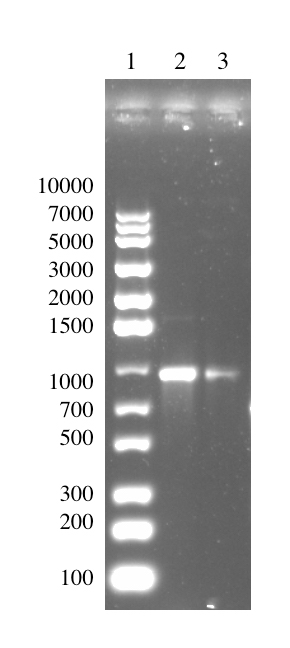
Ligation and Transformation of pSB1C3-T7-Lys: First Attempt [✔️]
In this attempt we had changed several of the experimental procedures and also used a chloramphenicol backbone. Here, we finally succeeded with the 3A Assembly and two colonies were observed from the the transformed E. coli TOP10 culture. The colonies were picked and confirmed with colony PCR using VF2 and primers VR. The expected size of the amplicon is 1093 bp and can clearly be identified on the gel below (well 6 and 7).
Demonstrating expression and investigating solubility of Lys in E. coli
The pSB1C3-T7-Lys was first transformed into the expression strain E. coli BL21(DE3). To express lysostaphin, IPTG was used as an inducer. The induced cells were then sonicated and separated into pellets and supernatant which serves to identify the solubility of lysostaphin. It is considered soluble if it is found in the supernatant or insoluble if it is bound to cellular compartments and found in the pellet. Hence, the separated samples are then analysed with a SDS-PAGE analysis.
Protein expression using IPTG Induction [✔️]
IPTG concentrations were varied between 0.5 mM and 1.0 mM. This variation was employed to see if high concentrations of IPTG or a high expression of the protein could have a negative impact towards the E. coli BL21(DE3) cells. Lysostaphin is a bacteriolytic enzyme and thus could potentially disrupt the cell walls of the expression system.
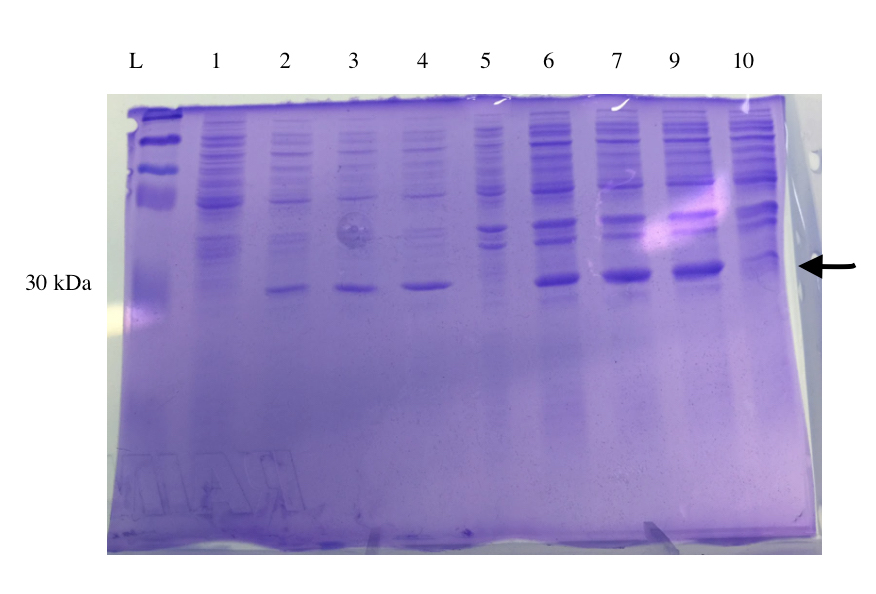
SDS-PAGE of Expressed Lys [✔️]
Based on the open reading frame from the T7-Lys construct (741 bp) a fully expressed protein would be around 27 kDa in size. The SDS PAGE result is shown in Figure 5. On the protein ladder, 30 kDa corresponds to the fifth band from the top. The result of the SDS Page show bands of approximately 30 kDa on all the transformed samples including that from the supernatant and pellet. Whereas the untransformed samples do not display protein bands of this size (lane 2 and 6). However, we also see that the uninduced samples (lane 3 and 7) show protein bands at 30 kDa. We think that the emergence of these protein bands could possibly be due to a leaky promoter of the T7 DNA polymerase in the E. coli BL21(DE3) system. It would be unwise to conclude that lysostaphin is more insoluble based on this result alone, as we acknowledge that in the pellet several more proteins are present many of which could have the size of 30 kDa. Additionally, the amount of protein loaded was determined only very roughly and was evidently higher for pellet samples.
Demonstrating bactericidal activity of Lys
To demonstrate that Lys had been successfully expressed in E. coli, we performed a modified Kirby-Bauer test of the cell lysate on E. coli TOB1, a biofilm producing strain. Any bacteriolytic activity from the cells lysate would imply that Lys has been expressed and it possesses its enzymatic activity.
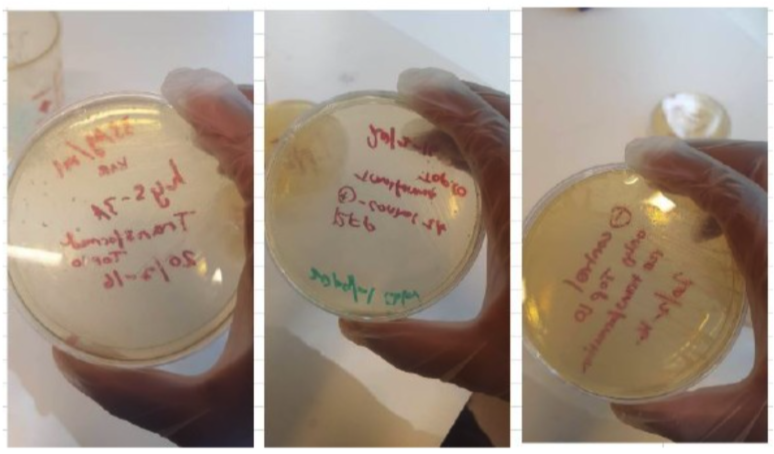
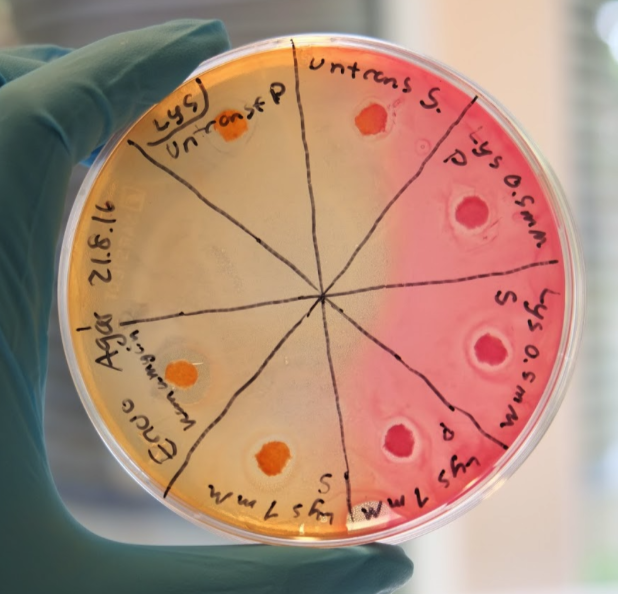
Kirby-Bauer Test [✔️]
The figure below shows the Kirby-Bauer test that was done on MacConkey agar. Regarding the zone of inhibition observed, kanamycin, which served as a positive control, displayed the largest and most clear zone compared to the cell lysates. Induced cells from both the pellet and supernatant sample with 0.5 mM IPTG and 1.0 mM IPTG also showed zones of inhibition. The zones from induced samples were larger than that of uninduced samples. This indicates that even though bacteriolytic substances or proteins could be present in the cell lysate (based on the zone of inhibition from untransformed samples) the samples containing lysostaphin showed a greater lytic activity.
Demonstrating efficient biofilm inhibition
The detection and quantification of biofilm inhibition was obtained by crystal violet staining. Since crystal violet also stains bacterial cells, an absolutel clear distinction between baceriolytic and biofilm-dispersing activity is hard to make. However, the assay is appropriate for evaluating the results of both S. aureus and P. aeruginosa biofilms as long as caution is taken with the interpretation. The results may be assessed visually, photographed or quantified spectrophotometrically using a plate reader to measure the absorbance at 595 nm. For the inhibition test, the experimental procedure includes adding liquid cultures to a microtiter plate which we immediately treat with lysostaphin at four different volumes; 1, 5, 10 and 20 µl. Gentamicin was used as positive control and cell lysates of BL21(DE3) cells as negative control.
The significance of the results obtained were analyzed using a t-test.
During protein extraction of lysostaphin, the cells were lysed and both the cell pellet and the supernatants were tested for biofilm inhibition. The supernatant samples were labelled Lys (S), whereas the pellet samples were labelled Lys (P). The treatment had been done on 3 different samples of Lys (Lys 1, Lys 2 and Lys 3) but for simplicity, only one is shown in each experiment.
S. aureus Biofilm inhibition [✔️]
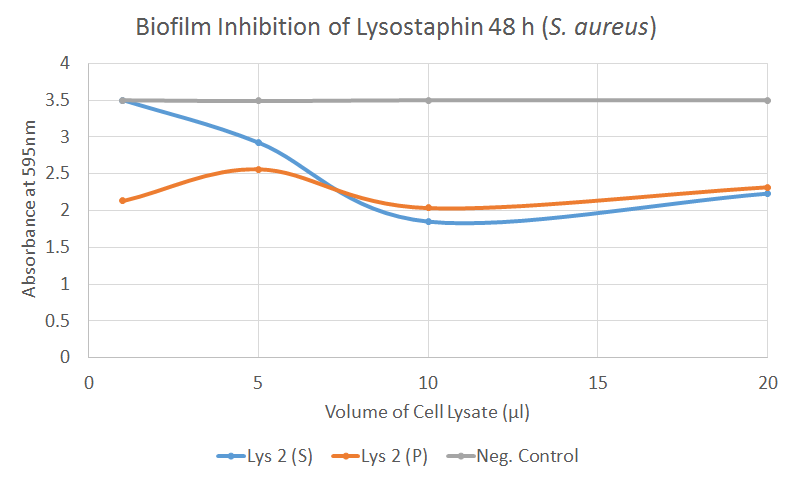
This graph indicates that the absorbance reading is generally reduced with increased volume of lysostaphin treatment. The graph also shows that the drop in absorbance, which indicates a lower degree of crystal violet present in the wells, is prominent in both the supernatant and pellet sample. This reflects the SDS-PAGE results that show the presence of lysostaphin is in both the supernatant and the pellet. The constant negative control is maintained at 3.5 absorbance. Therefore t-test is viable to determine the statistical significance of the results. From the t-test, it is observed that there are significant differences in biofilm inhibition for the samples Lys 2 (S) with a P-value <0.05. A significance value was also observed for Lys 2 (P) at 5 and 10 μl with a a P-value <0.001. The positive control which used gentamycin had a much lower average absorbance of 1.065.
P. aeruginosa Biofilm inhibition [❓]
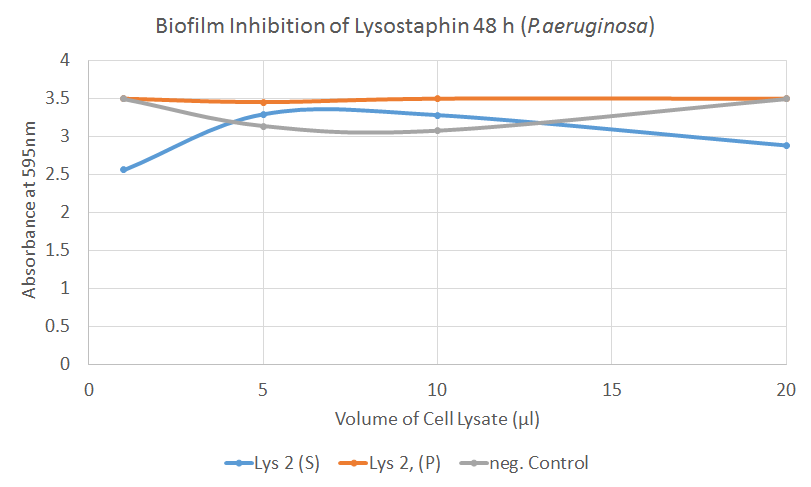
Unlike the significant inhibitory results on S. aureus, data on P. aeruginosa was mostly insignificant, as shown from the figure above. Based on this figure, we can say that the changes in absorbance from the treatment was insignificant compared to the negative control. This was expected as we knew that lysostaphin specifically targets the peptidoglycan layers in staphylococci.
Demonstrating efficient biofilm dispersal
The enzymatic function of lysostaphin was also demonstrated by testing the efficacy of biofilm dispersal. The method of detection and quantification of biofilm dispersal was similar to that of inhibition, with the exception of growing the biofilm for 48 hours prior to adding the expressed protein. The same statistical analysis was used to determine the significance of data obtained.
S. aureus Biofilm Dispersal [✔️]
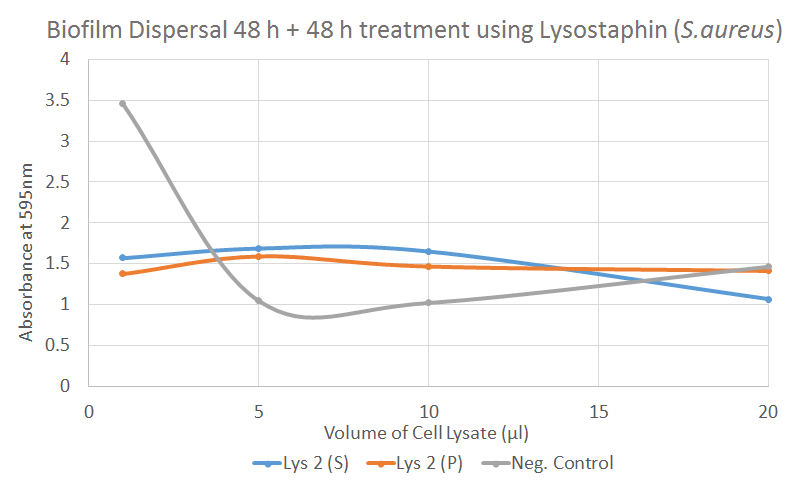
The graphical presentation of the result above clearly shows that the negative control has reducing absorbance with increased treatment. This was unexpected, as it should have theoretically remained constant. The steep decrease in the negative control sample could however indicate that other proteins from the cell lysate may play a role in causing the dispersal of S. aureus biofilm.
In contrast, the treated wells with lysostaphin samples show a reduced absorbance that remained constant with increased volume of treatment. In the treated samples we see that at low treatment volumes the absorbance is already low, at around 1.5. This is comparable to that of the positive control which has an average absorbance of 1.09 (not shown). Hence, even though we do not see a declining slope of absorbance towards an increase of treatment volume, it was likely that with low volumes, lysostaphin was able to disperse S. aureus biofilm. This is confirmed by the t-test where there a significant effect of biofilm dispersal at a P-value <0.03 for a majority of the Lys 2 samples.
P. aeruginosa Biofilm Dispersal [❓]
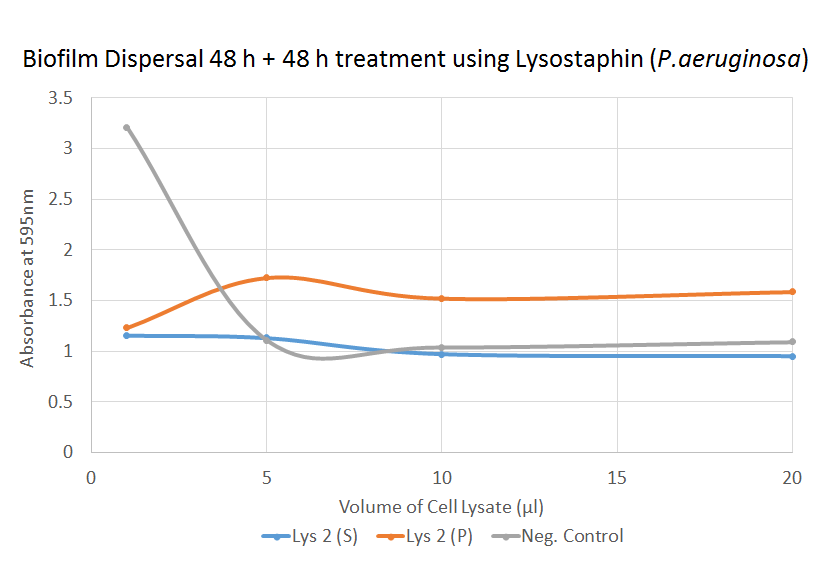
As in the previous graph, we observe an unexpected drop in the negative control. The t-test for the dispersal of P. aeruginosa shows that for most of the treated samples, the result was insignificant. This implies that lysostaphin is ineffective against P. aeruginosa biofilm dispersal.
Adding Sortase and His tags to the expression construct
To be able to attach lysostaphin to spider silk we would need to add a linker-tag (LT) that would act as a recognition sequence for Sortase A. The LT consisting of a LPETGG motif would then be conjugated to a corresponding glycine sequence on the spider silk by Sortase. The addition of the LT mimics that of the 3A assembly. However, here the LT is attached to the lysostaphin sequence by means of a BamHI restriction site. The lysostaphin does not have a BamHI, which was therefore added by performing an overhang PCR. The lysostaphin and the linker tag sequence are then ligated into the pSB1C3 backbone.
Overhang PCR of Lys Strategy 1: First attempt [✔️]
Strategy 1 was done by performing an overhang PCR using VF2 as a forward primer and Lys-Rev as the reverse primer. The Lys-Rev primer has been designed to remove stop codons present on the original BioBrick part as well as add a BamHI site on the downstream end of the lysostaphin sequence. The product size of the overhang PCR of pSB1C3-T7-Lys is 922 bp and this is illustrated from the figure below.
Digestion of Overhang PCR Product: First Attempt [✔️]
The PCR product was then subjected to a double digestion with EcoRI and BamHI. The digested overhang lys is 795 bp in size. This is more than 100 bp shorter than the undigested fragment which has a size of 922 bp. Thus, the difference between the digested and undigested fragments is noticeable on the gel. (A more detailed description can be found in the lysostaphin Lab Book week 8).
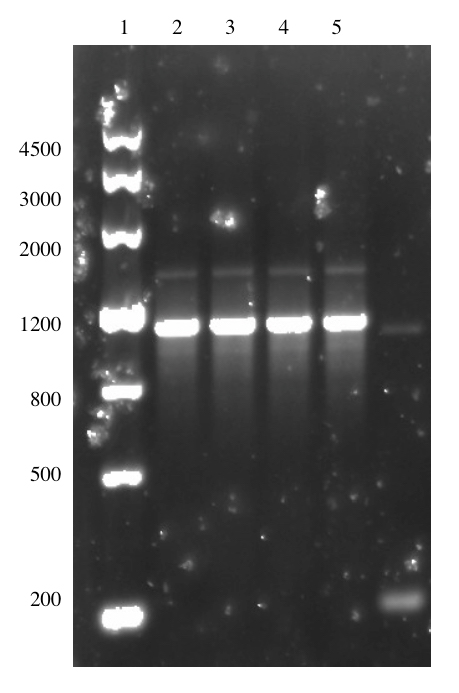
Ligation and Transformation of pSB1C3-T7-Lys-LT: First Attempt [❌]
In order to perform the ligation, the linker-tags and the pSB1C3 were also subjected to double digestions with the correct restriction enzymes, as summarized below.
Overhang Lys - EcoRI and BamHI
Linker-Tags - BamHI and PstI
pSB1C3 - EcoRI and PstI
The ligation was done with a insert:vector molar ratio of 10:1. We obtained transformed colonies in our first attempt and these colonies were picked and confirmed with a colony PCR using VF2 and VR primers. The amplified fragment is 1147 bp in size and this is shown in Figure 11.
The plasmid from the culture was also subjected to sequencing. Unexpectedly, the sequencing result indicated that the linker-tags had not been successfully incorporated into the construct. A second attempt was performed with same procedure to obtain pSB1C3-T7-Lys-LT. One colony arose from the procedure, but sequencing results showed that the construct had not been successfully assembled.
To troubleshoot, a second strategy to try and add the linker-tag sequence was to perform a PCR on the whole pSB1C3-T7-Lys construct while adding a BamHI sequence on the 3’ of the lysostaphin sequence.
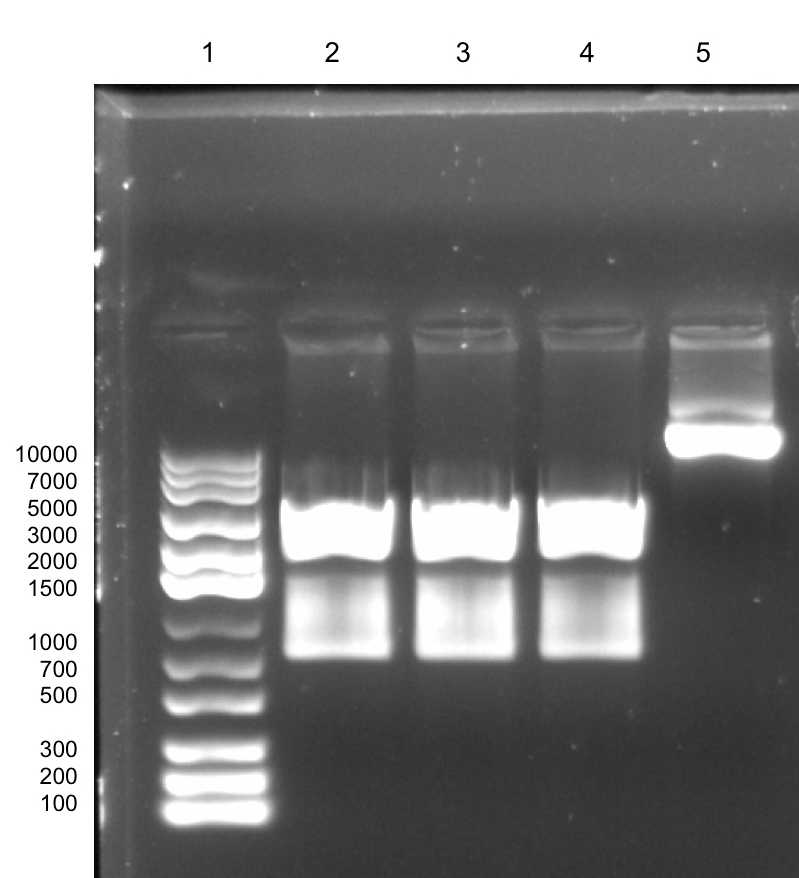
Overhang PCR of Lys Strategy 2: First to ninth Attempt [❌]
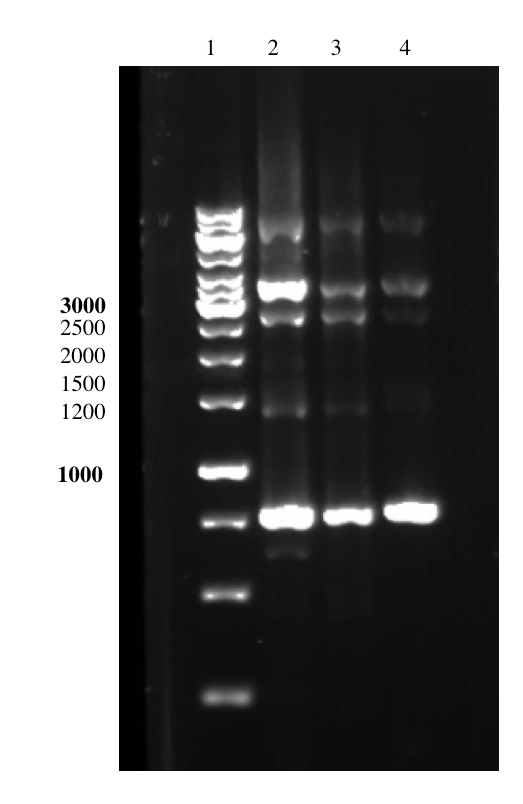
In this second strategy to perform the overhang PCR, we had tried several attempts of optimizing the PCR conditions to amplify pSB1C3-T7-Lys-BamHI. The PCR was performed using a Phusion High Fidelity Polymerase. We had tried different buffers, to different annealing temperatures, to different extension times, to different template concentrations and even using DMSO in the reaction. However, we were not able to obtain the right sized amplicon in sufficient amounts. The size of the amplicon should be 2852 bp in size, however we either resulted in no bands or unspecific bands. A more detailed description of the experiments can be found in the lysostaphin Lab Book Week 14-15. Below are some images of the PCR result during optimization.
Unfortunately, due to time constraints we could not continue those experiments and therefore were also unable to purify lysostaphin or attach the enzyme to spider silk.