Team:TMMU China/Model

Overview
Mathematical modeling and experimental research are complementary to each other. We established a novel visual selection for device knocked into the genome of L. lactis. We also optimized the nisin controlled expression (NICE) system, the protein surface display system. In the NICE system, nisin was used as the food grade gene expression inducer. However, nisin is also an antibacterial peptide. A low concentration of nisin will lead to a low expression of the target protein. However, a high concentration of nisin will inhibit the growth of bacteria, which will also decrease the total expression level. To resolve the dilemma we incorporated the nisin immunity or resistant genes nisI or nsr into the NICE system. However, it is still difficult to directly determine whether our products are produced sufficiently, and to evaluate the total expression amount at the community level.
To resolve these problems, we build 4 models to predict the gene expression rate, the growth rate, the protein production and secretion rate, and the total protein expression amount at the community level under different concentrations of nisin. To help readers understand the specific theory behind our model, we also wrote notes for all the modeling techniques.At last, we expect to improve mathematical modeling to make it more convenient to use. So we collaborated with UESTC who helped us to post a visual interface of our model results on the web page.Click here to know more about the imformations.


Model 1:The Gene Expression Rate
Introduction
In order to predict the protein expression rate and amount under different nisin concentrations, we treated the bacteria in isolation, which means at the single cell level. This prediction will be incorporated into the equation to calculate the total protein amount at the community level.
Modeling
In the NICE system, the PnisZ or PnisA promoter controlled gene expression rate depends on the concentration of nisin. We try to predict the gene expression rate under different nisin concentrations. In one research, the quantitative relationship between the extracellular concentrations of nisin and the efficiency of PnisZ were measured (Guo et al., 2013). We retrieved the data (Table 1) to get a fitting equation, which will be used in the protein production model.
Table 1 Data used in the fitting
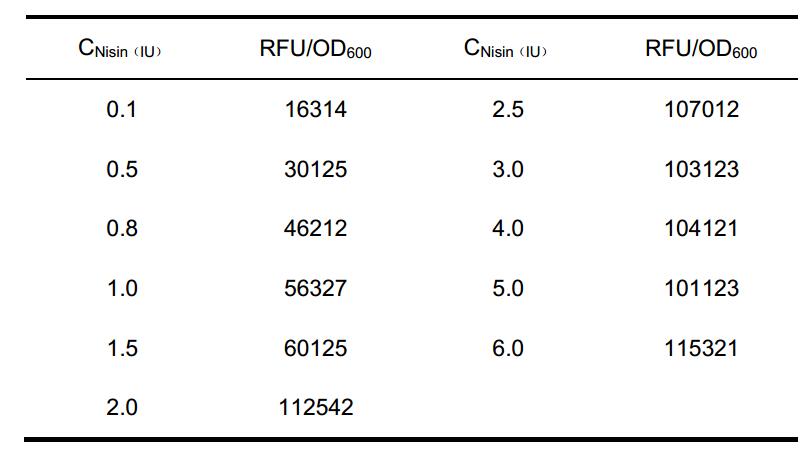
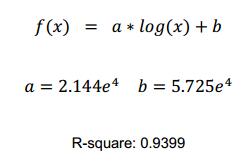
The log-sigmoid function was used to fit, because the nisin receptors on the cell membrane is limited, and this function value will not continue to increase as x reach to a certain value. This is suit for the characteristics of our promoter.
In the NICE system, the protein of interest production process is shown as below:

We tried to use Michaelis-Mentin kinetics to predict the protein production rate. We made several modifications on the equation to accommodate the transcriptional regulatory mode of the PnisZ promoter.
The Michaelis-Mentin kinetics equations:
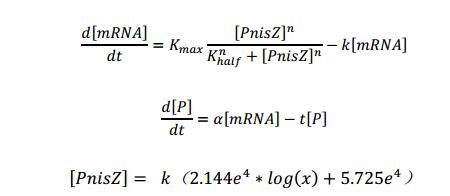
Attention:We replaced [PnisZ] in the Michaelis-Mentin kinetics by F(X) that we obtain by fitting, and we try to transform this typical math model to describe the direct proportion relationship between [PnisZ] and the concentrate of extracellular nisin.
[PnisZ], [mRNA] and [P] represent the concentrations of PnisZ, mRNA and product protein respectively. Coefficient k was got by the experimental result.
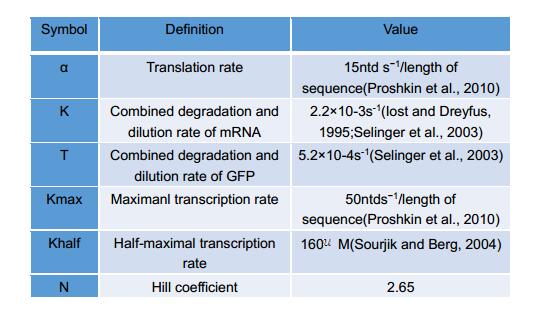
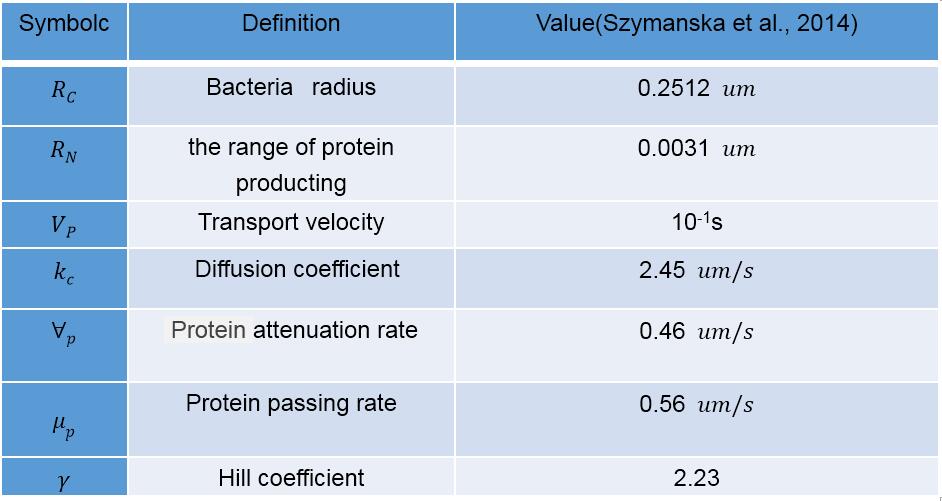
The remaining symbols are defined in Table 2.
Table 2 Definition of symbols used in the Michaelis-Mentin kinetics
Analysis and Results
Using the model we established, we predict the protein production rate under different nisin concentrations as shown in Figureure 1.1. The higher concentrations of nisin will lead to higher expression levels of protein of interest.
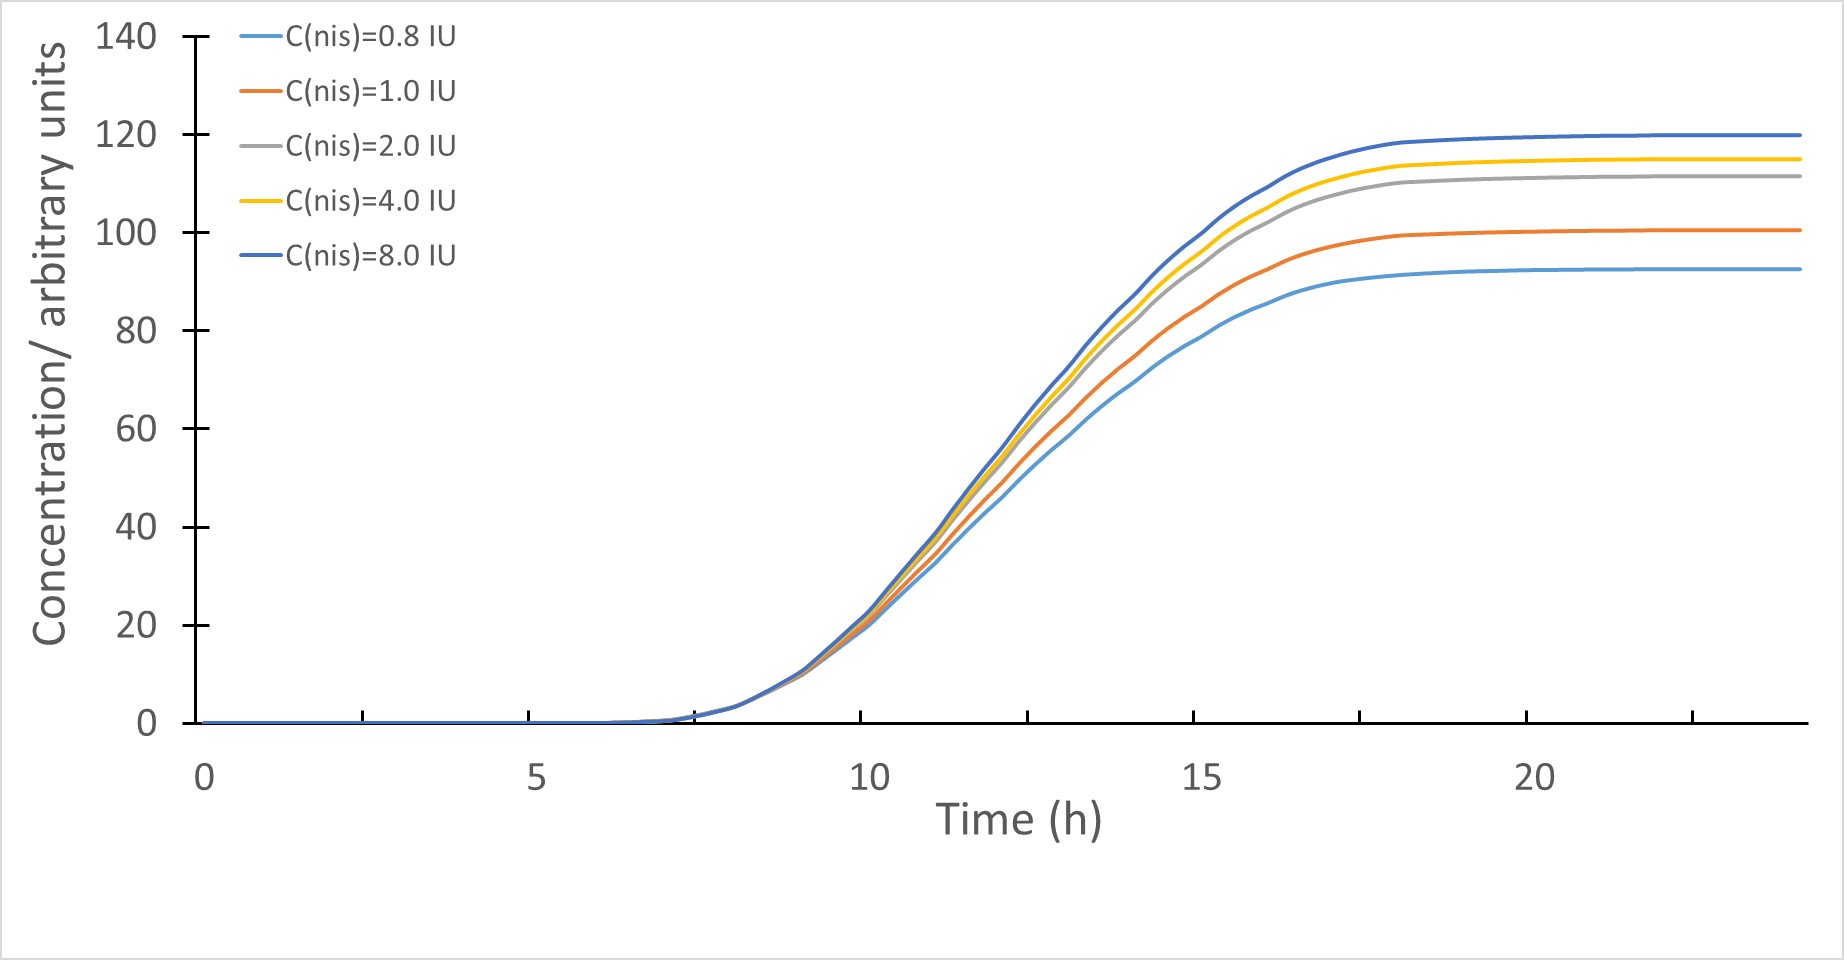
Figure 1.1 Simulated protein production levels under different nisin conditions
To test whether our model can be applied to the real situation, we compared the expression levels of mCherry proteins and the simulated results. As shown in Figureure 1.2, the two curves are well matched.
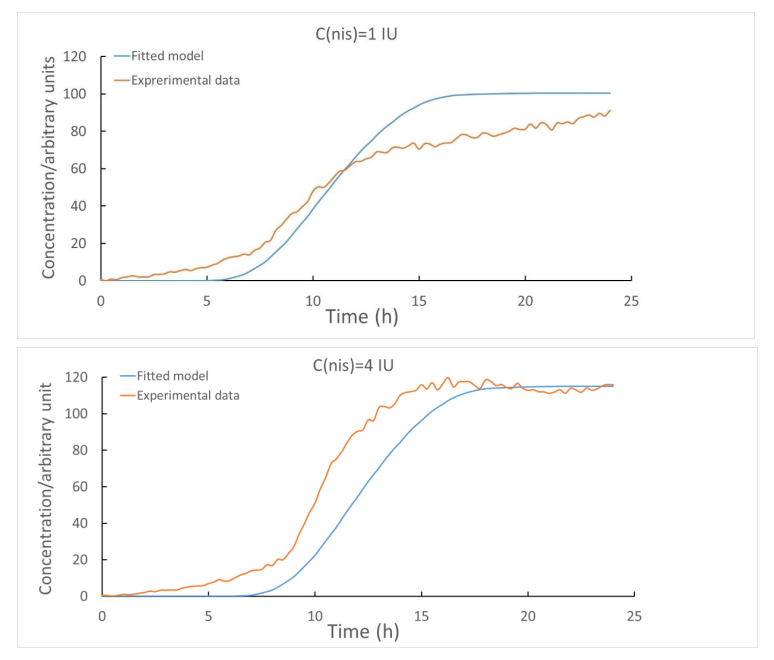
Figure 1.2 The fluorescence intensity levels produced by mCherry proteins along with the simulated protein levels under different concentrations of nisin.
References
[1]https://2015.igem.org/Team:Oxford/Modeling [2]Guo, T., Hu, S., and Kong, J. (2013). Functional analysis and randomization of the nisin-inducible promoter for tuning gene expression in Lactococcus lactis. Curr Microbiol 66, 548-554. [3]Iost, I., and Dreyfus, M. (1995). The stability of Escherichia coli lacZ mRNA depends upon the simultaneity of its synthesis and translation. EMBO J 14, 3252-3261.[4] Proshkin, S., Rahmouni, A.R., Mironov, A., and Nudler, E. (2010). Cooperation between translating ribosomes and RNA polymerase in transcription elongation. Science 328, 504-508.[5] Selinger, D.W., Saxena, R.M., Cheung, K.J., Church, G.M., and Rosenow, C. (2003). Global RNA half-life analysis in Escherichia coli reveals positional patterns of transcript degradation. Genome Res 13, 216-223.[6] Sourjik, V., and Berg, H.C. (2004). Functional interactions between receptors in bacterial chemotaxis. Nature 428, 437-441.
Model 2: The protein secretion model
Introduction
To be surface displayed, proteins should be secreted after translation and then anchored to the cell wall, which is really a long journey. In our project, we used the signal peptide SPusp45 to direct protein secretion and the cA domain to make proteins surface displayed. In this section, we try to simulate the secretion process in bacteria, and predict the amount of protein can be surface displayed at a given time.
Modeling
A recursion equation was used to calculate the amount of protein that on the cell wall. The value of  was determined by reference (Lin et al., 2016), the definition of symbols are listed in Table 3.
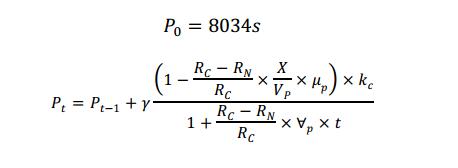
Table 3 Definition of symbols used in the recursion equation
Analysis and Results
Using the secretion model, we found that 89.46% of the expressed protein will be secreted and anchored to the cell, when the expression of protein is stable as shown in Figure 2. The result is similar to several reported protein secretion ratio with the signal peptide SPusp45 (87%(Lin et al., 2016), 89%(Borrero et al., 2011) ).
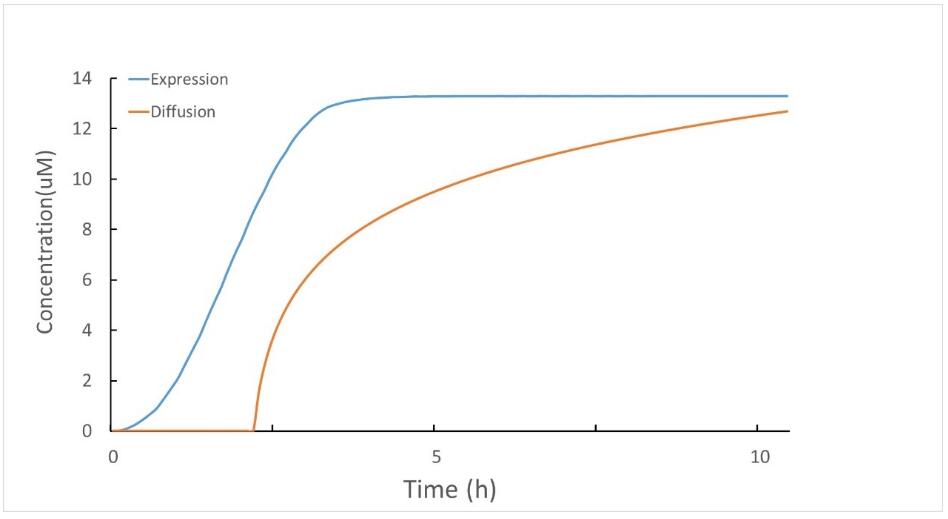
Figure 2 The amount of secreted proteins (yellow) and the total expressed proteins (blue)
References
[1]Szymanska, Z., Parisot, M., and Lachowicz, M. (2014). Mathematical modeling of the intracellular protein dynamics: the importance of active transport along microtubules. J Theor Biol 363, 118-128.[2]Borrero, J., Jimenez, J.J., Gutiez, L., Herranz, C., Cintas, L.M., and Hernandez, P.E. (2011). Use of the usp45 lactococcal secretion signal sequence to drive the secretion and functional expression of enterococcal bacteriocins in Lactococcus lactis. Appl Microbiol Biotechnol 89, 131-143.[3]Lin, J., Zou, Y., Ma, C., Liang, Y., Ge, X., Chen, Z., and She, Q. (2016). Construction and characterization of three protein-targeting expression system in Lactobacillus casei. FEMS Microbiol Lett 363.
Model 3: The Growth rate model
Introduction
The mathematical models that can predict the growth rate of a microorganism population under a set of environmental conditions is useful for many research. Many growth models have been proposed, such as the widely used Logistics model. However, when primary models are applied to bacterial growth curves, the biological variability is reduced to a single curve defined by some kinetic parameters (lag time and growth rate), and sometimes the models give poor fits in some regions of the curve. Moreover, the number of experiment is usually limited for most iGEM teams (relative to the threshold to get credible growth curve). To solve this problem and get the credible growth curve, we built a random effect multiplicative heteroscedastic model. The model combines nonparametric theory and bootstrap techniques that can get a prediction band with a probability of 0.95(95%) to predict the optimal growth curve.
Modeling
The process of this non-parametric model is shown in Figure 3. The theory basis of this model (including 4 steps) was supplemented in the note.
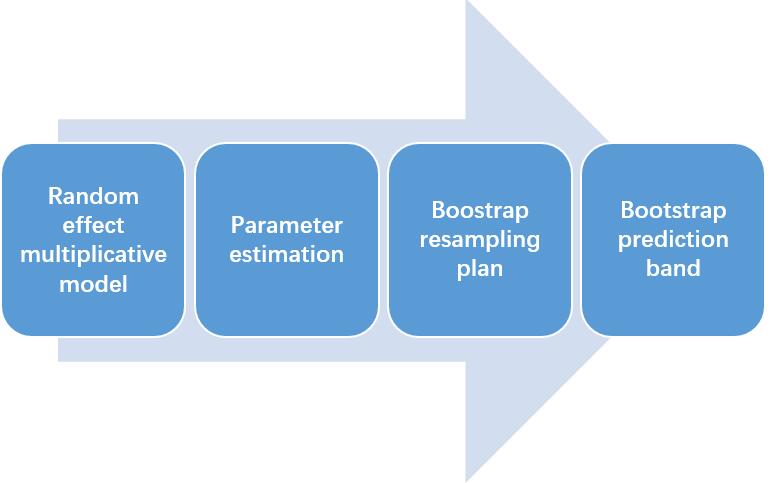
Figure 3.1 The process of the non-parametric model
Analysis and Results
As shown in Figure 3.2, we found that the non-parametric model can predict the process of bacteria growth rate very well, and the nisin antibacterial activity is enhanced as the concentration increased. The results were obtained by only 3 groups of experimental data, indicating that this model can get the credible results by a smaller amount of data.
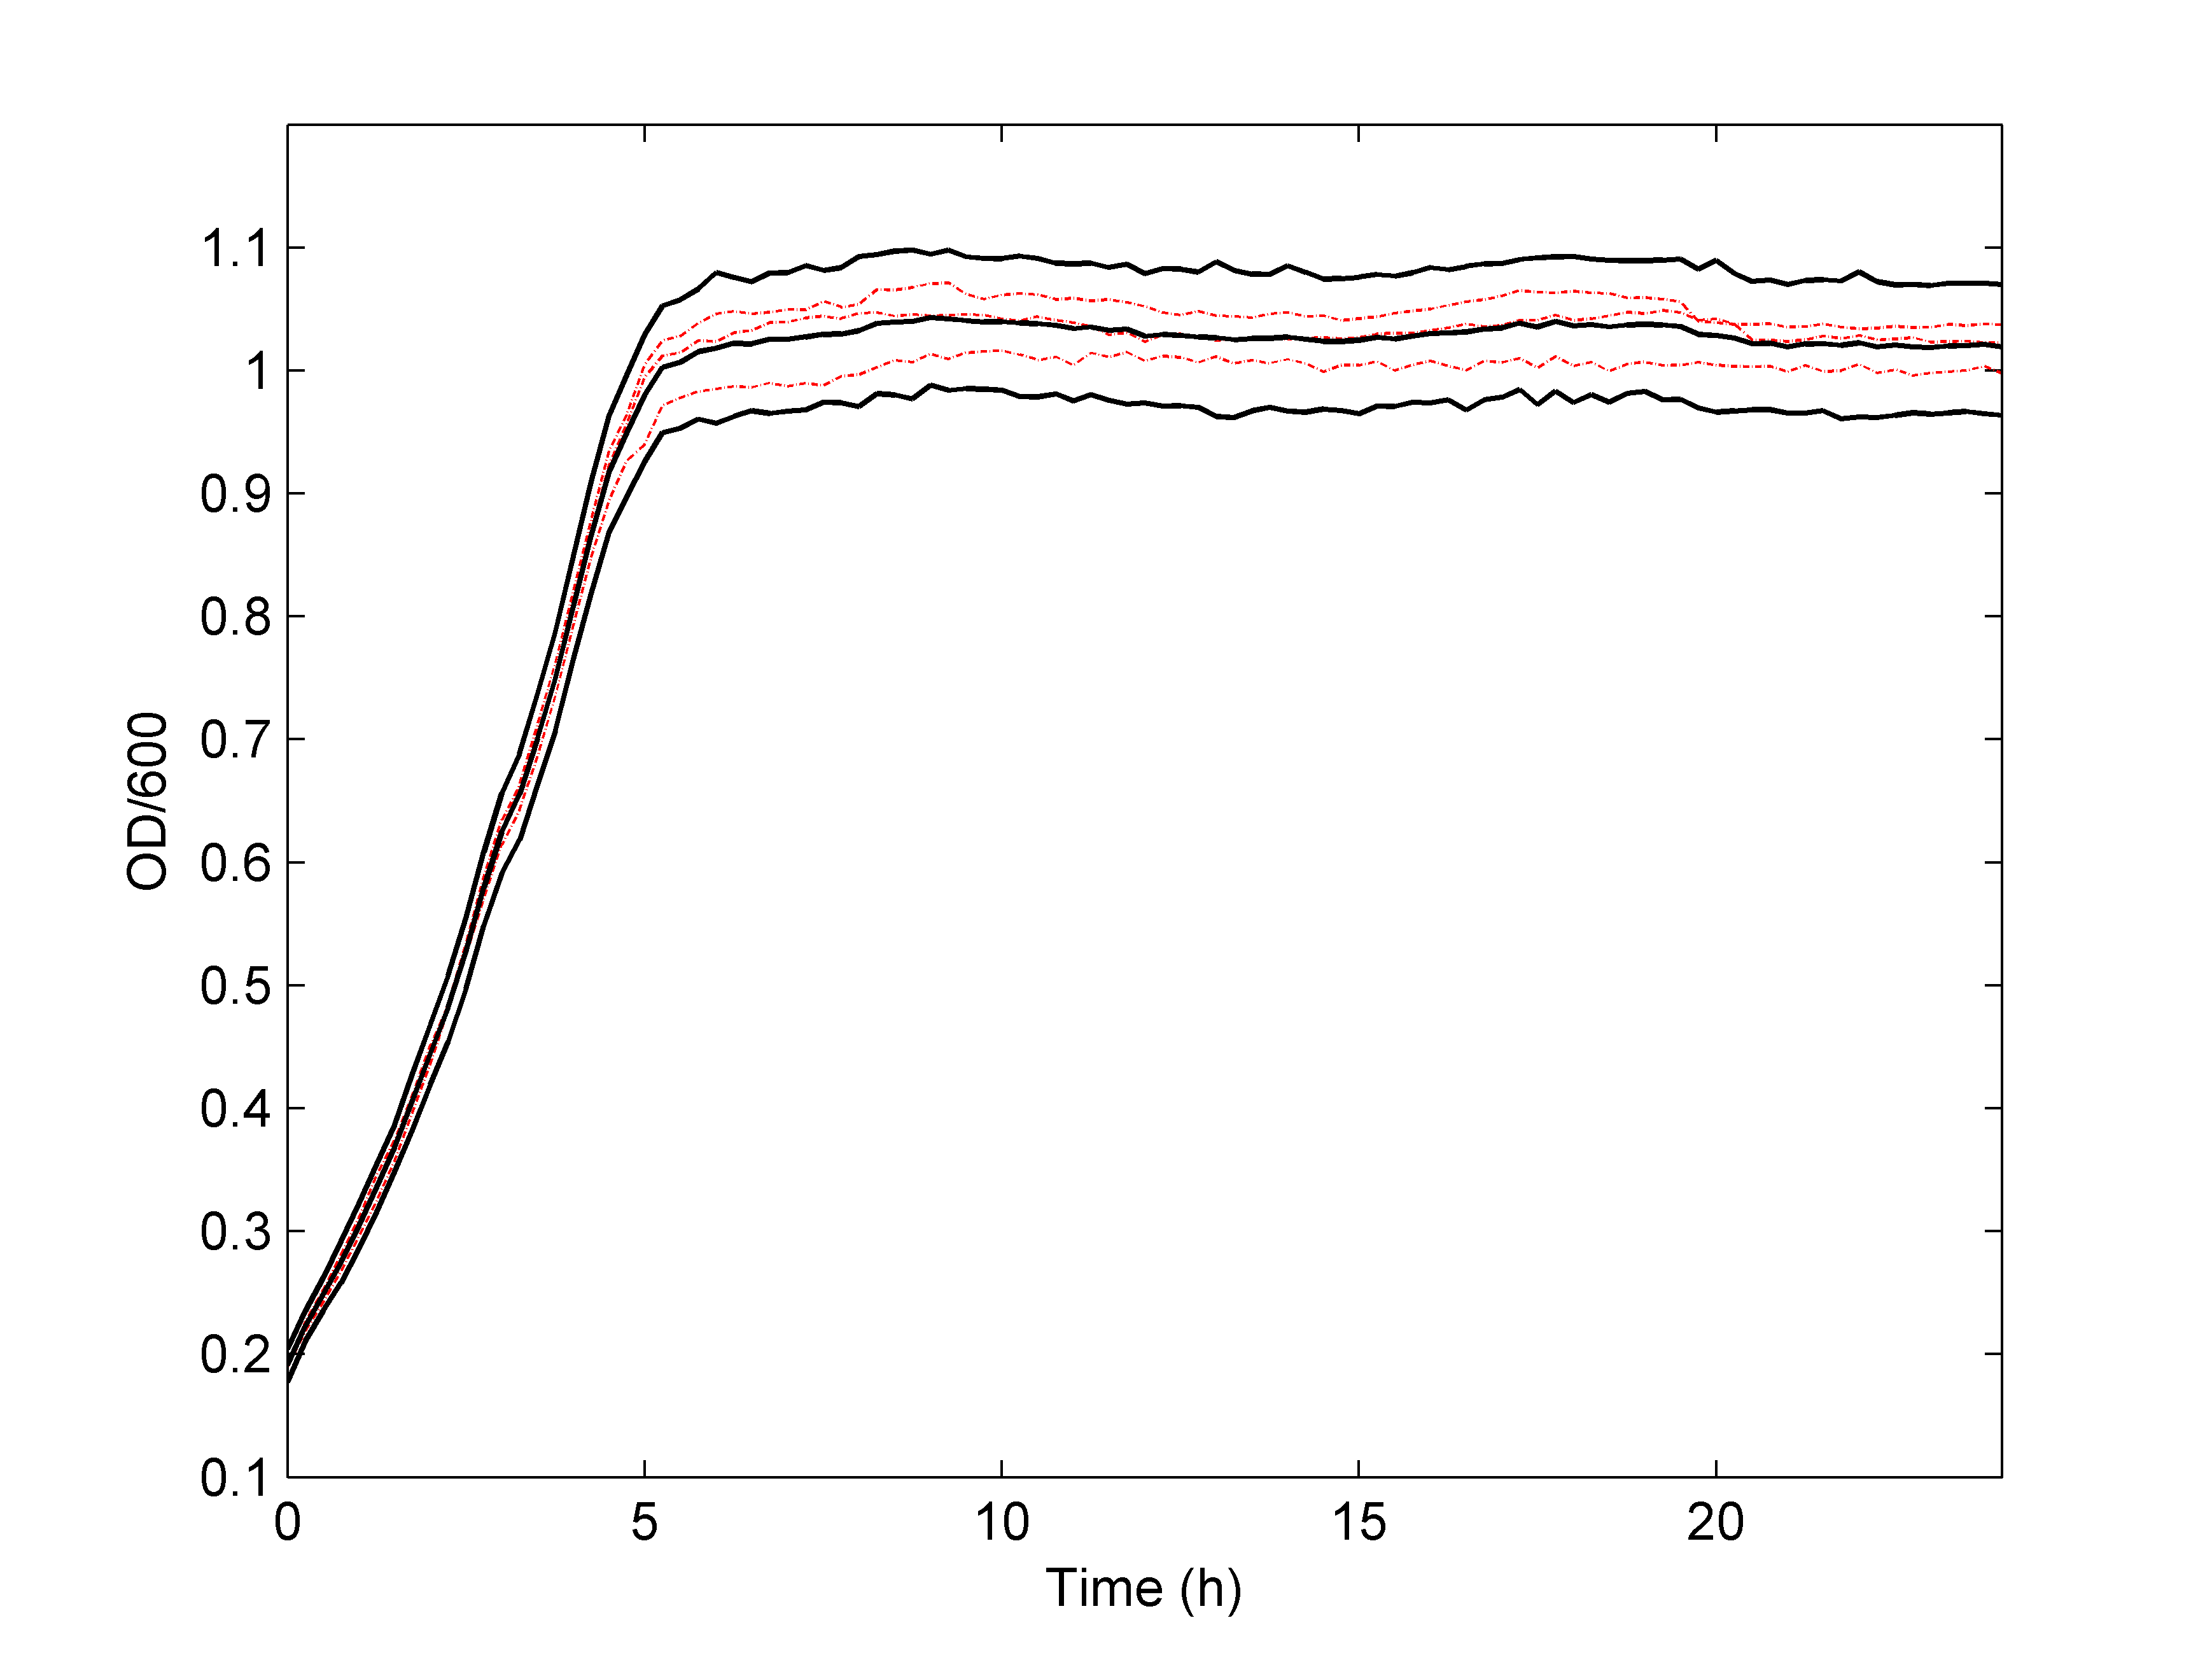
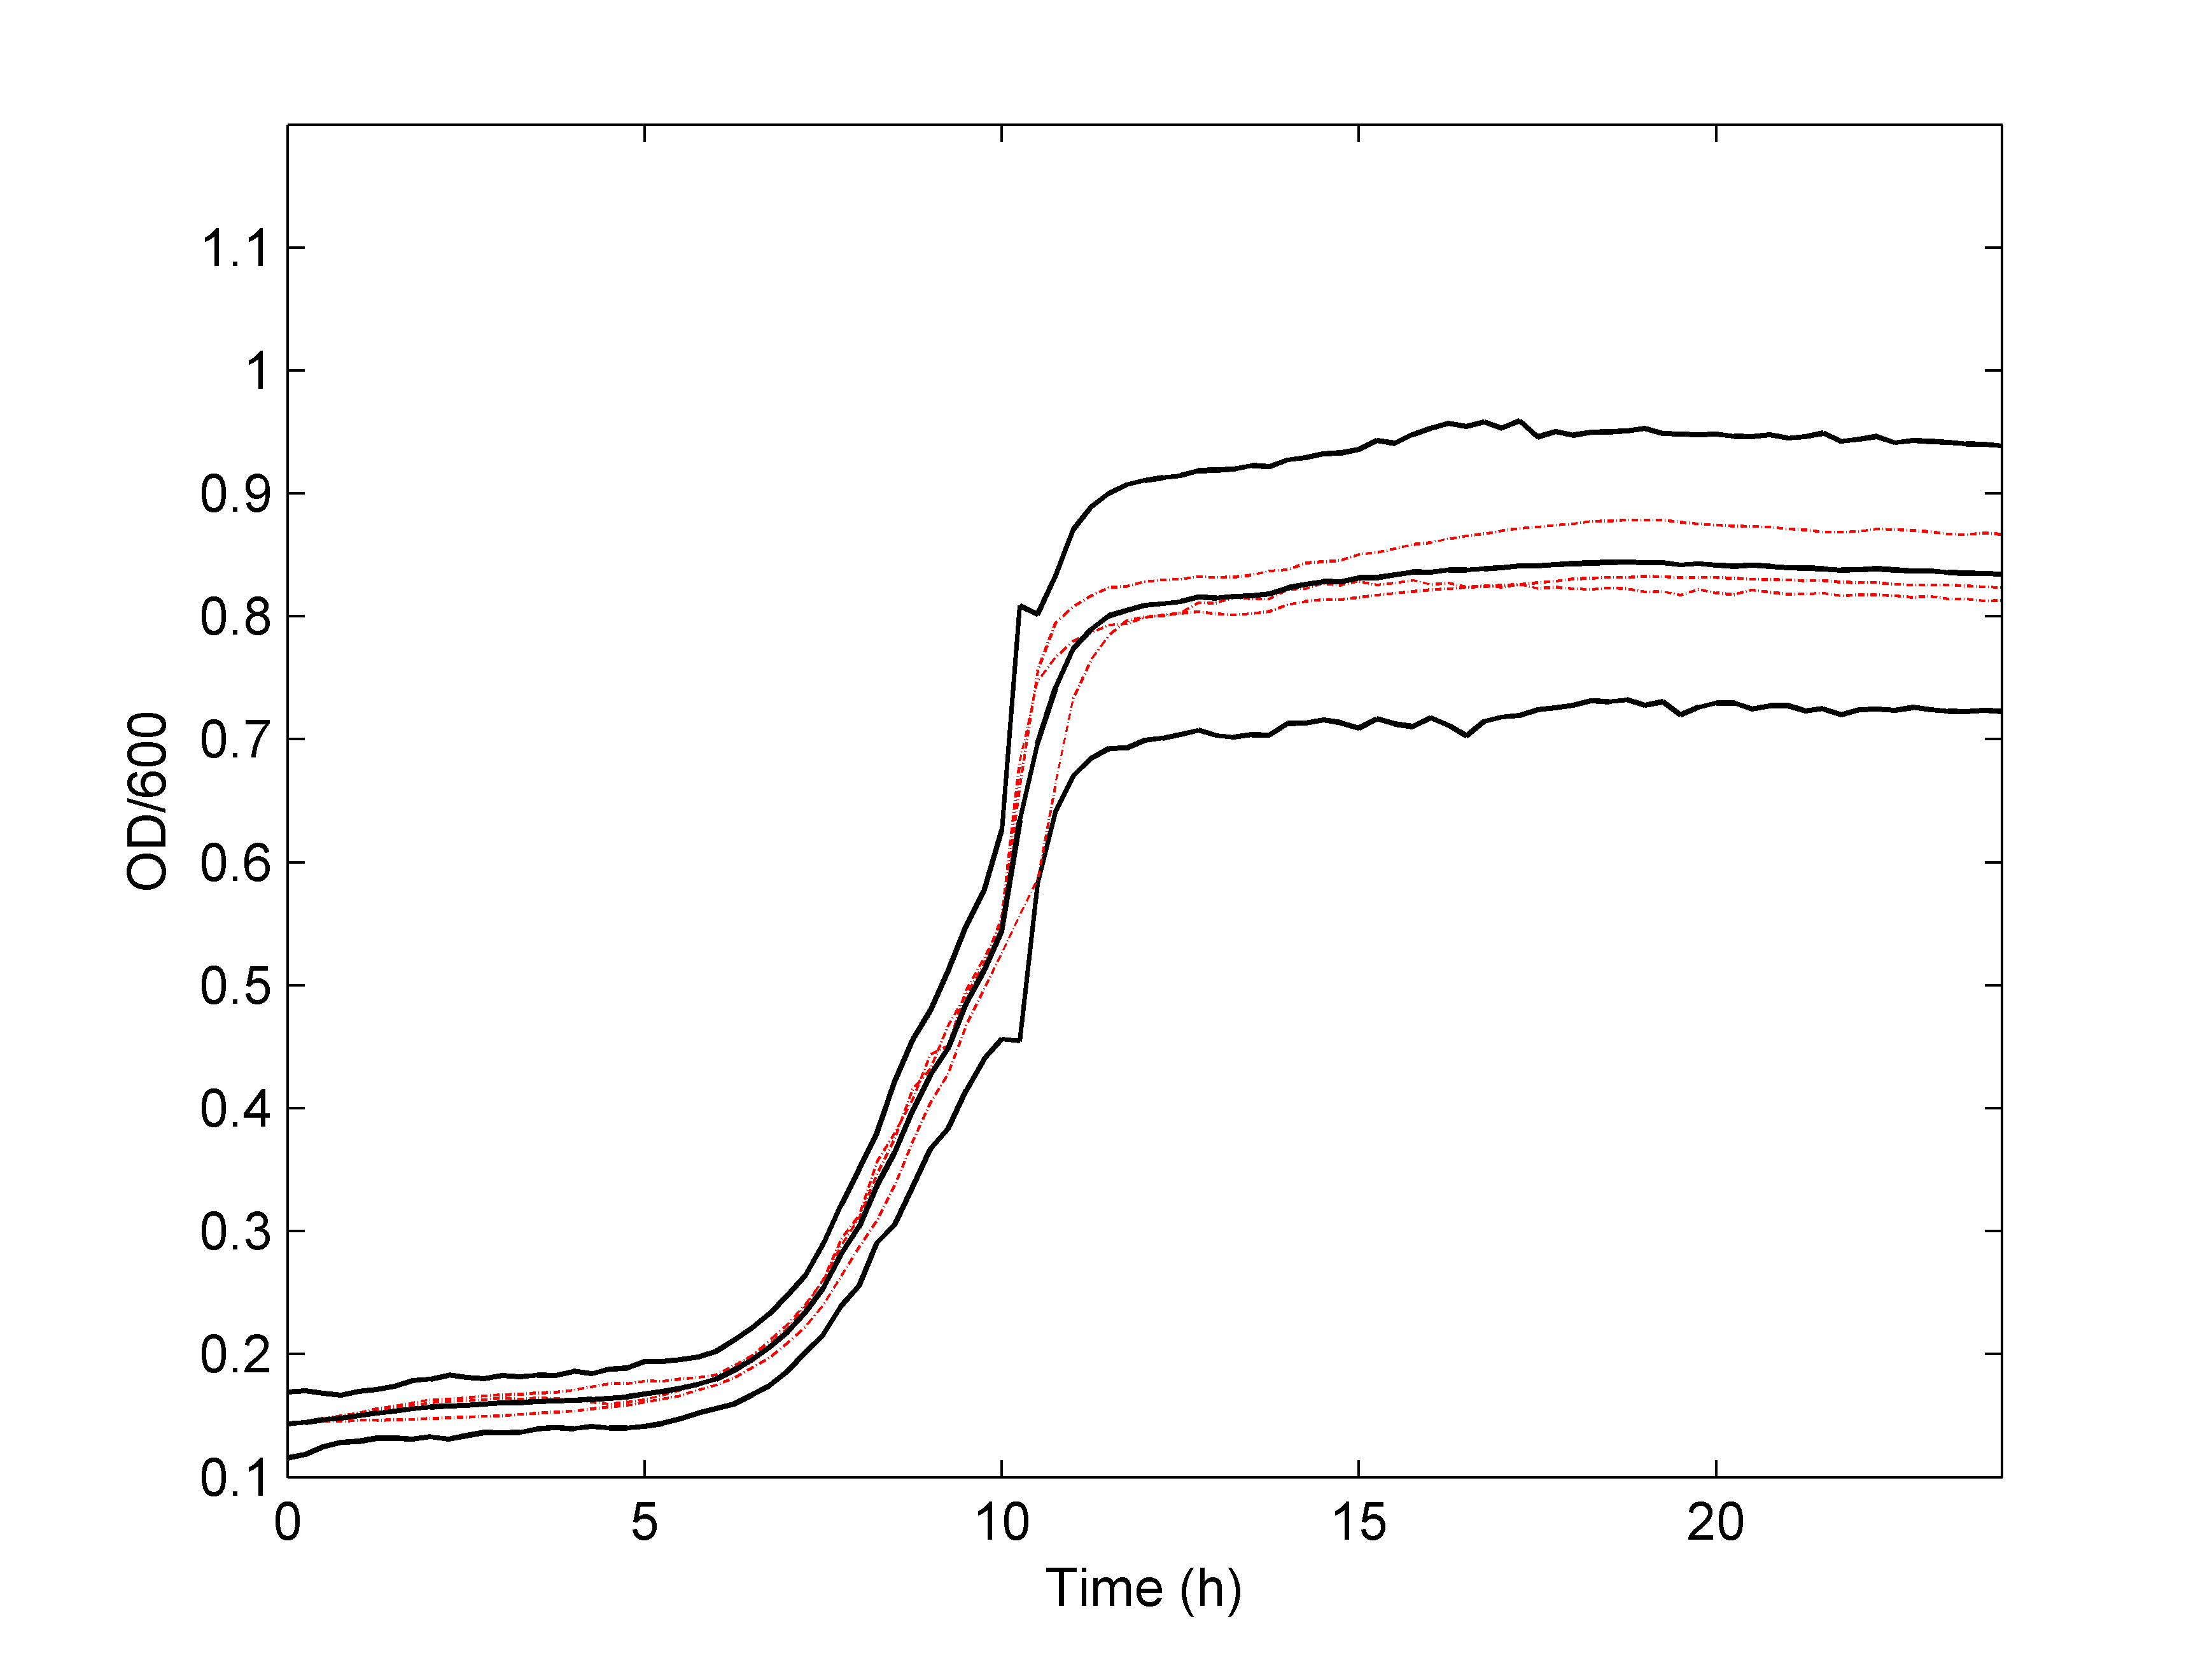
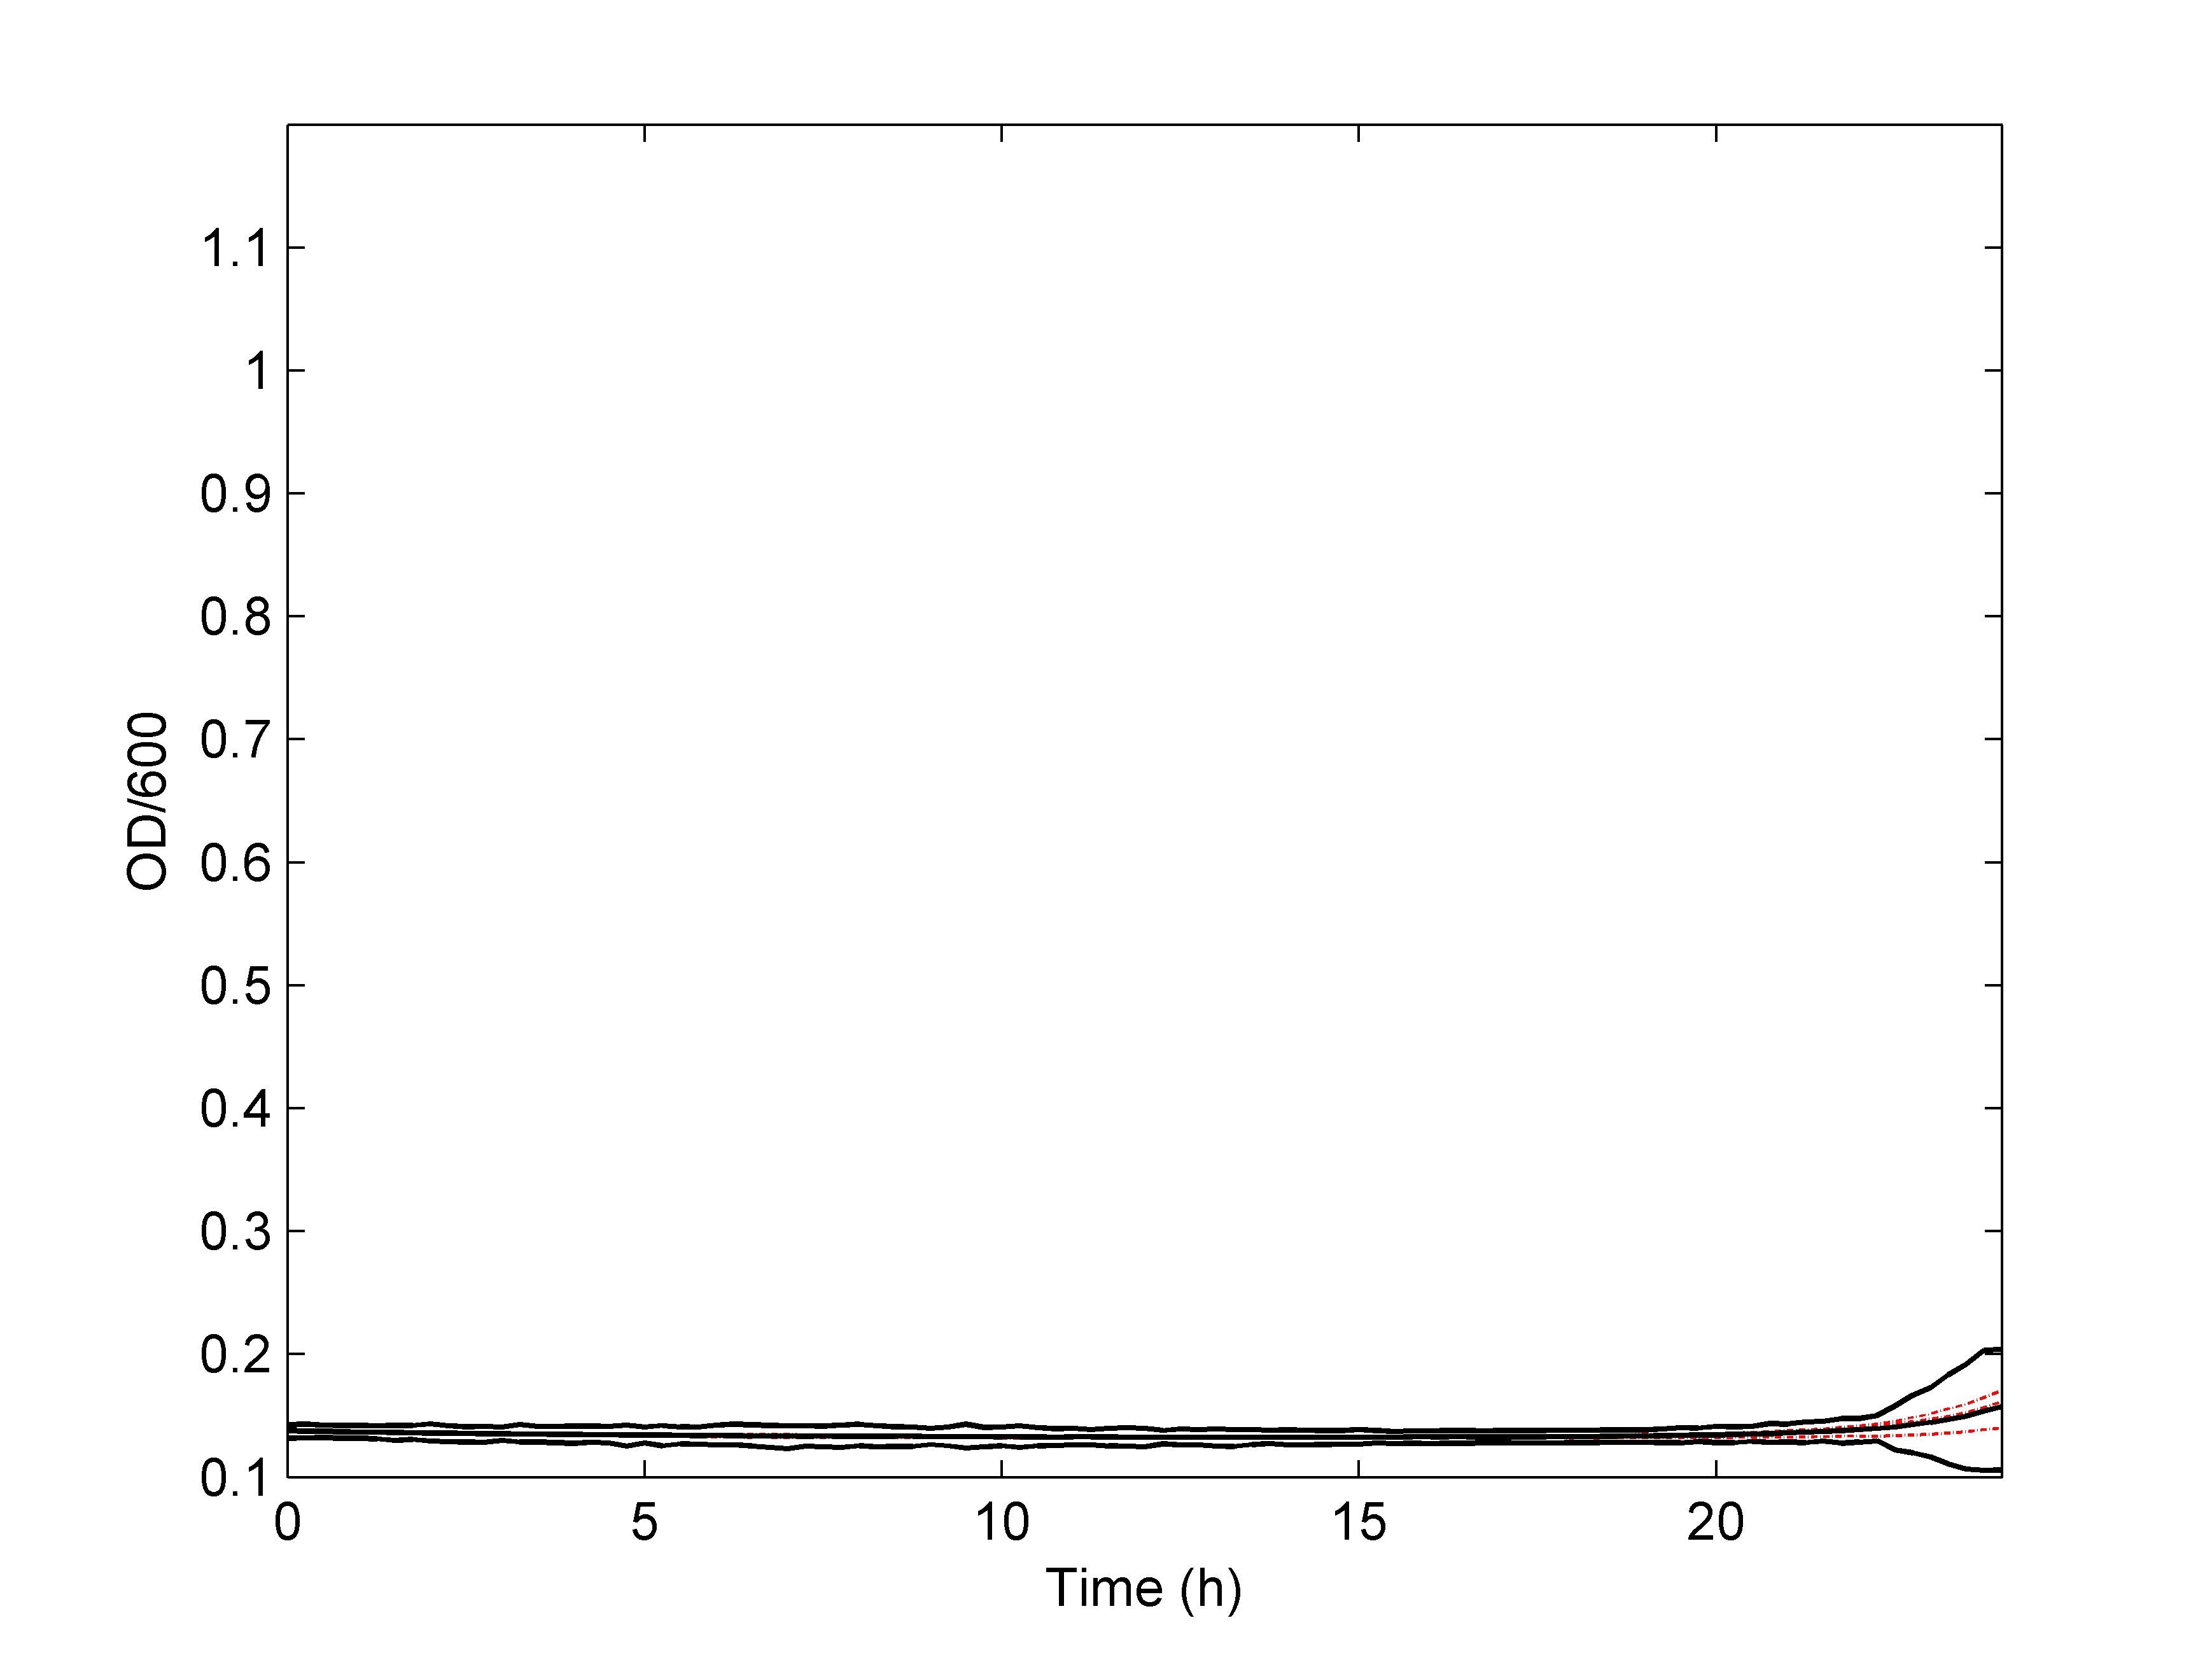
Figure 3.2 Simulated bacteria growth rate of L. lactis under different nisin concentrations.
Reference
[1]Szymanska, Z., Parisot, M., and Lachowicz, M. (2014). Mathematical modeling of the intracellular protein dynamics: the importance of active transport along microtubules. J Theor Biol 363, 118-128.
Model 4: The total protein level at the community level
Introduction
In model 1, we treated bacteria at the single cell level. In model 2, we predict the secretion and surface display efficiency of proteins base on the SPusp45 secretion signal peptide and cA anchoring domain. In model 3, we used non-parametric method to predict the growth rate of bacteria at the community level. Here, we try to combine the 3 models together to get a compound model to calculate the total protein level that can be surface displayed at the community level.
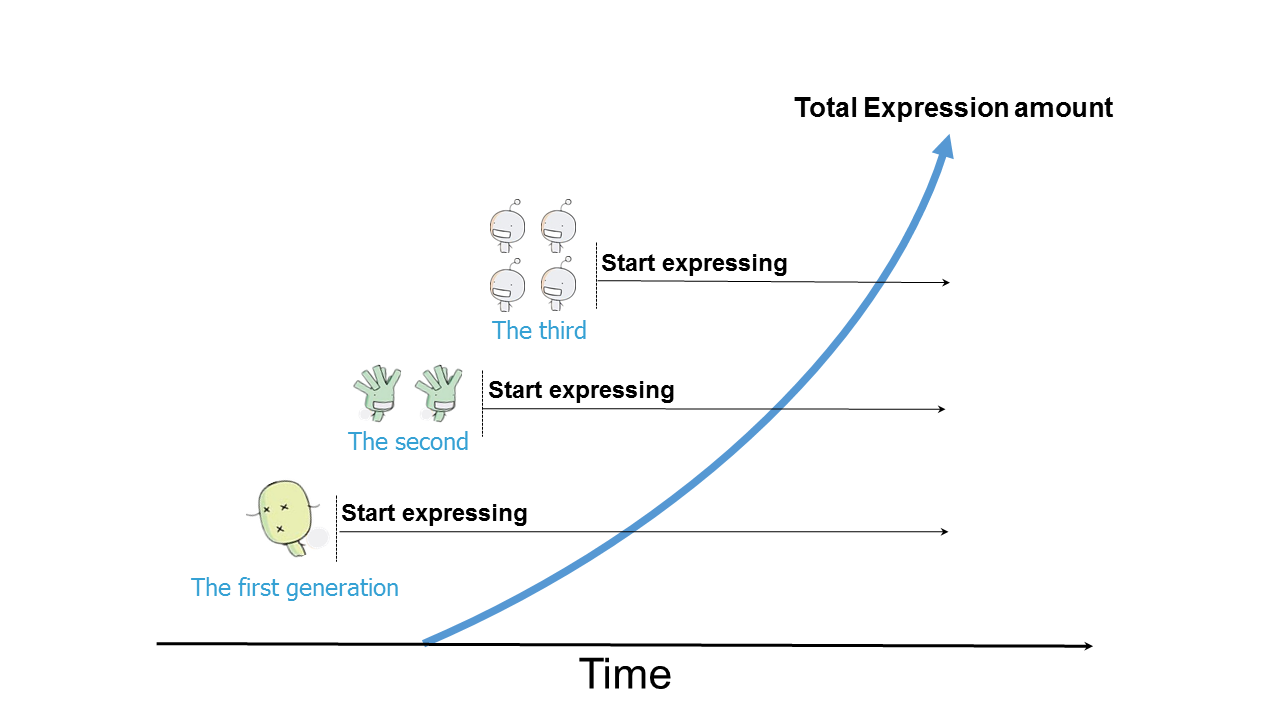
Figure 4.1 Schematic representation of the total protein level at the community level.
Modeling
We combined the best growth curve and the gene expression rate, using matlab to realize our idea by programming.
Analysis and Results
We found that when the concentration of nisin is 1 IU, the efficiency of protein expression level that can reach a peak is better than other nisin concentrations. This combined model can be used in the nisin controlled expression system, and reduce the workload of researchers.
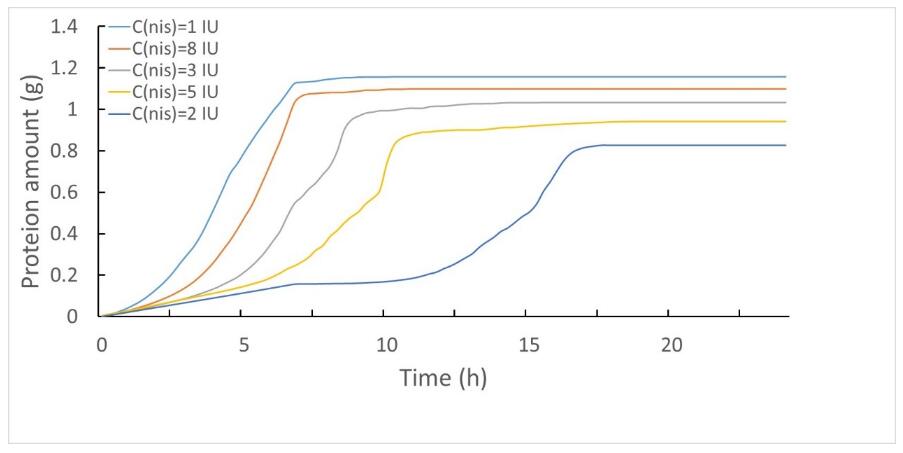
Figure 4.2 The total protein expression level under different nisin concentrations.
References
[1]Fisher, Irving (1897). A brief introduction to the infinitesimal calculus. [2]André Weil: Number theory. An approach through history. From Hammurapi to Legendre. Birkhauser Boston, Inc., Boston, MA, 1984, ISBN 0-8176-4565-9, p. 28.
Model Visualization
We expect to improve mathematical modeling to make it more convenient to use. And we collaborated with UESTC who helped us to post a visual interface of our model results on the web page. Click here to know more about the imformations.
NOTE
The process of this non-parametric model is shown in Fig 3. The theory basis of this model (including 4 steps) was supplemented in the note. Please see more details.