Team:Tianjin/Demonstrate
Results
System Working Under Real World Conditions.
Synthetic biology aims at using biological part to construct different kinds of devices to realize different functions in real world. Experiments in the laboratory is idealized so it cannot represent the real world conditions all the time. In order to simulate the real world condition without taking the biological materials outside the lab, we can use PET products bought from the regular shop instead of the chemical shop. Considering the organisms are living with each other in real world, we applied the microbial consortium to simulate the real world condition as much as possible.
Using the Real World Substrate
Our project this year is about biodegradation of the widely used palstic PET. As a polymer, PET is hard to degrade and the degrading process is time-consuming. Due to the mild condition of the biodegradation reaction and the restriction of growing of organisms, it is even slower although it is more environmental friendly. Therefore, we use the substitute pNPA (p-nitrophenyl acetate), a kind of small molecular ester as the reagent of enzymatic reaction. However, pNPA is not what we really want to degrade, so we need to measure the PET degrading effects of our enzyme. Actually, pNPA is mainly used to screen for the mutated PETase gene because of the high requirement of efficiency of this step. When we obtain the mutants we want, we used them to degrade PET. In order to simulate the real world condition as much as possible, we used the PET film bought from the online plastic products shop instead of the test reagent bought from the chemical company. The film is originally used as packing material. We soak the cut film into the 75% ethanol solution and wash them with double distilled water before degrading experiments.


SEM image of degraded PET
The main characteration method of degradation of PET applied by us is measuring the absorption peak of product MHET or TPA. However, we think it will be much more intuitive if we can directly observe the degrading results. We used the scanning electron microscope (SEM) to directly observe the surface of PET film after dealt with PETase. We took pictures under different magnifications and the results are as follows.
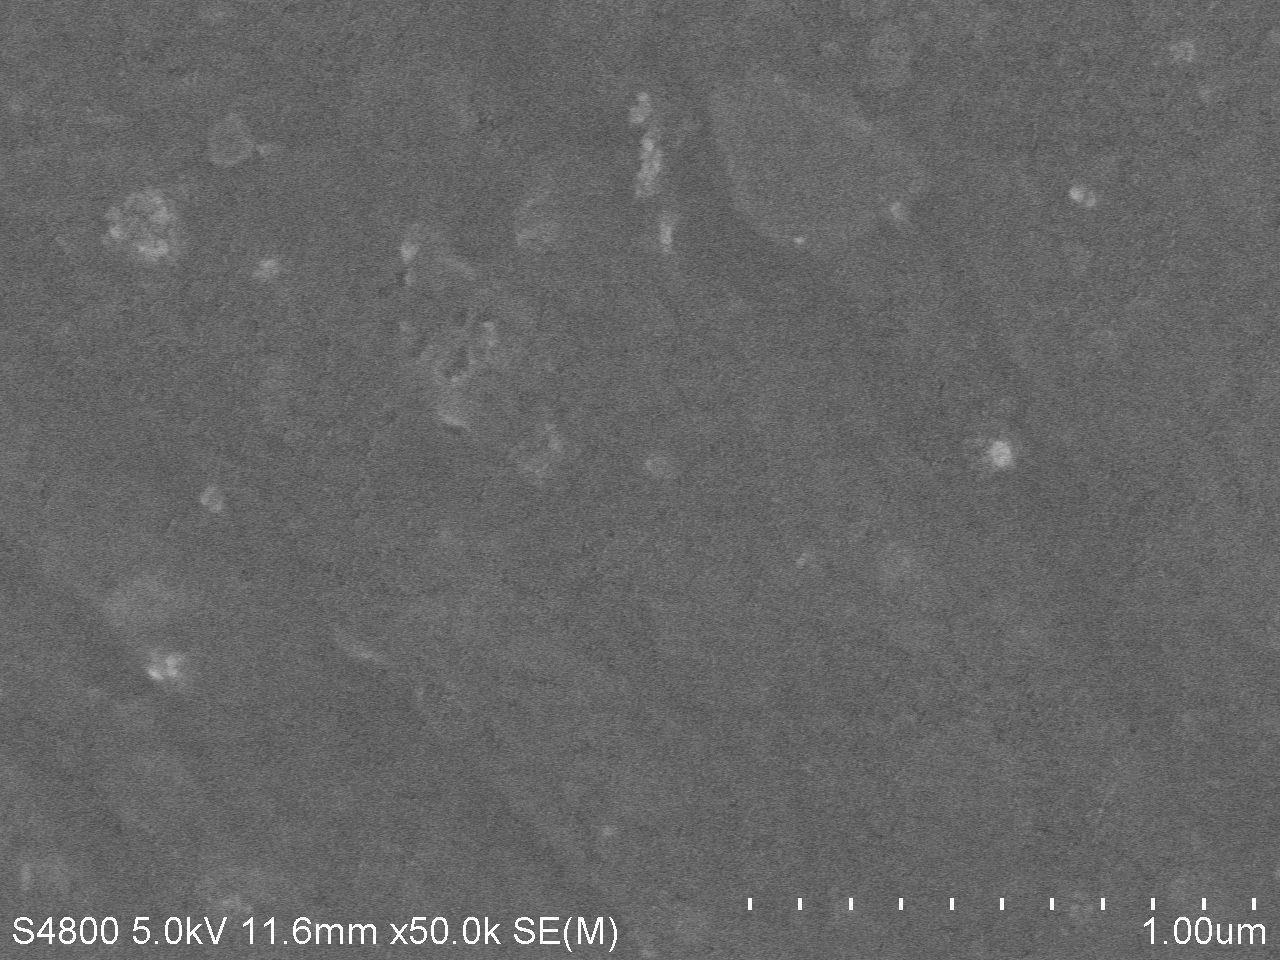

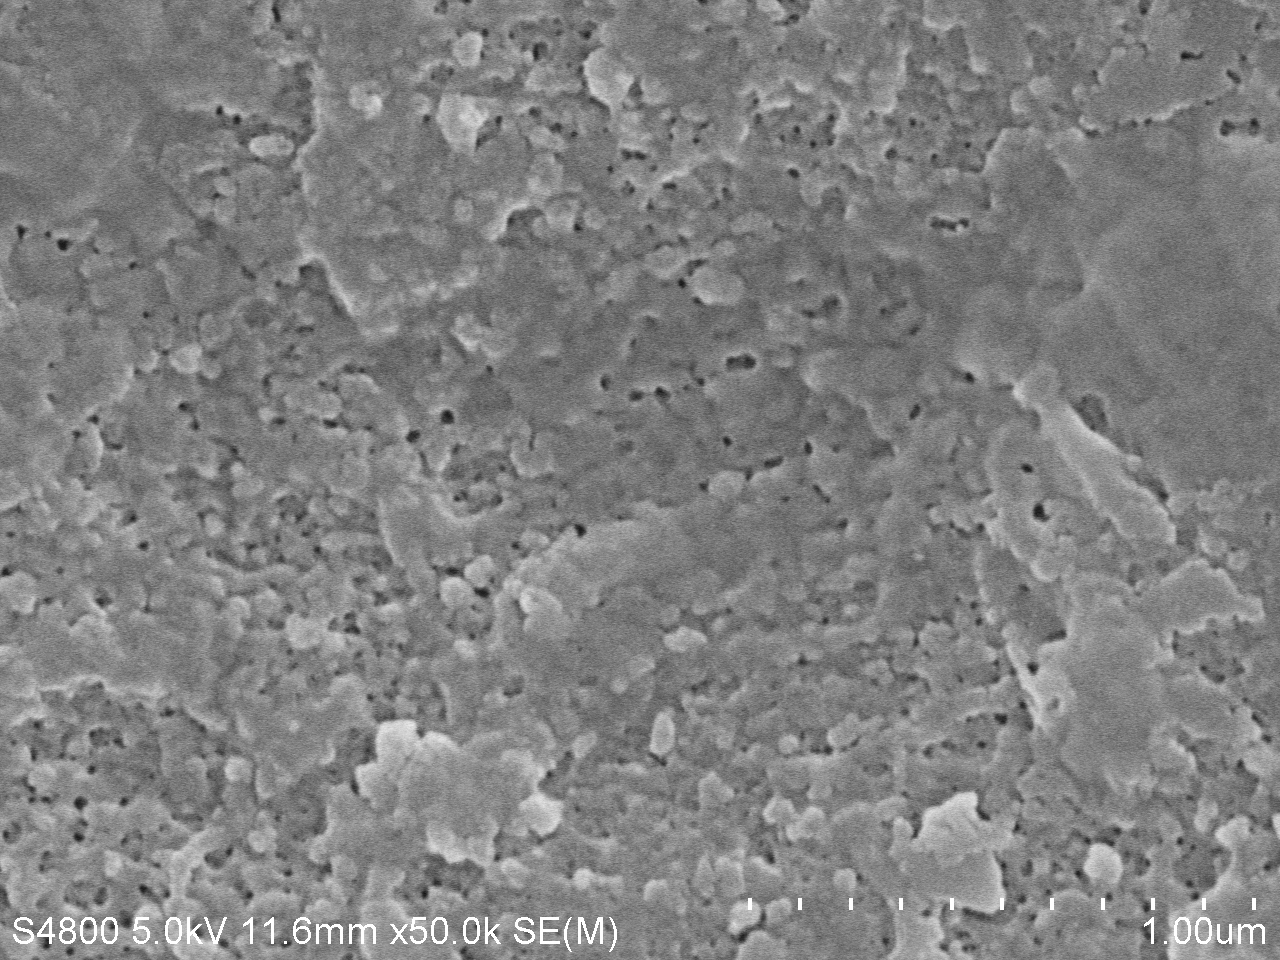

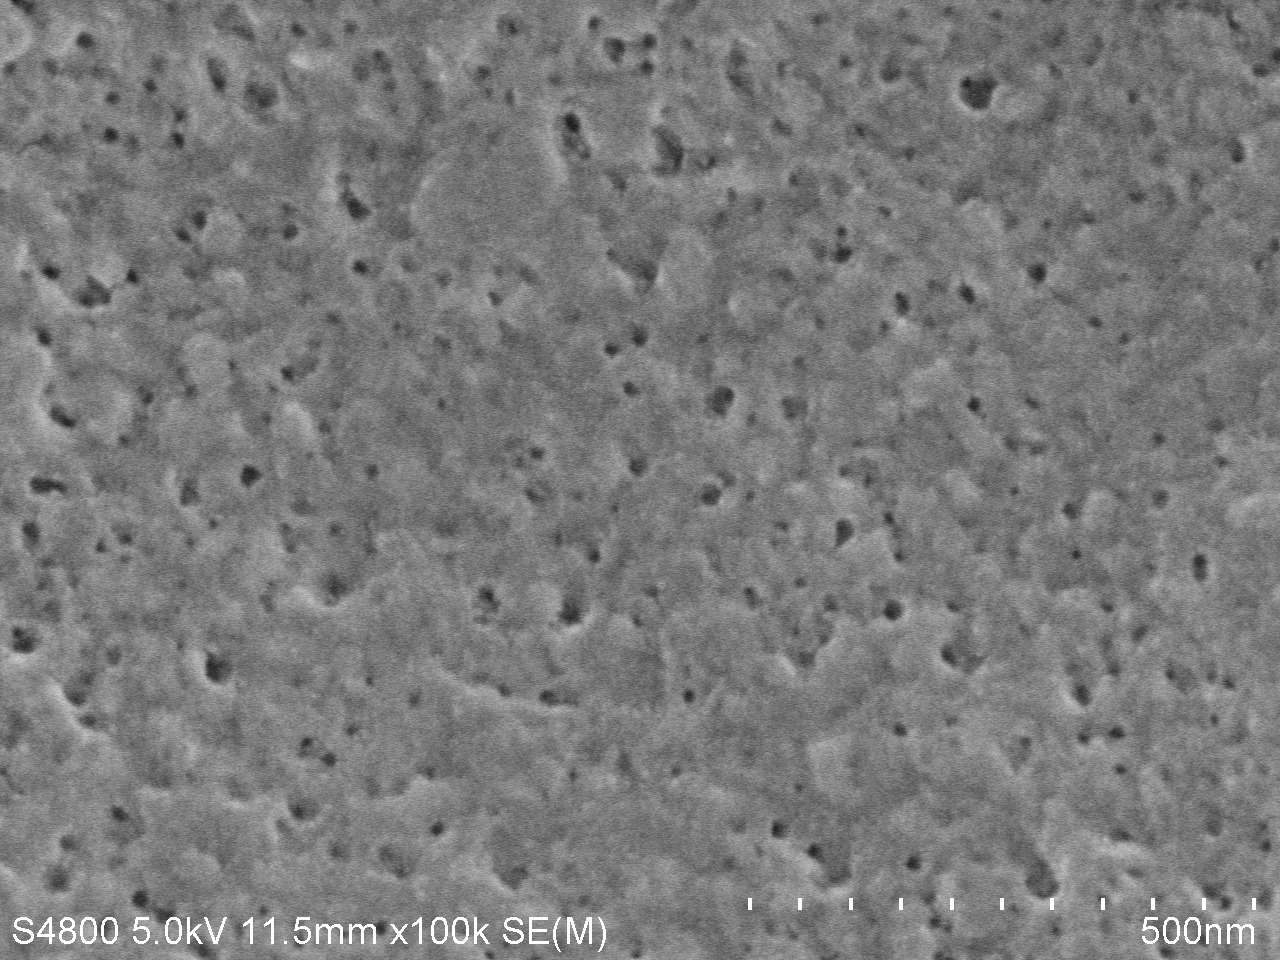
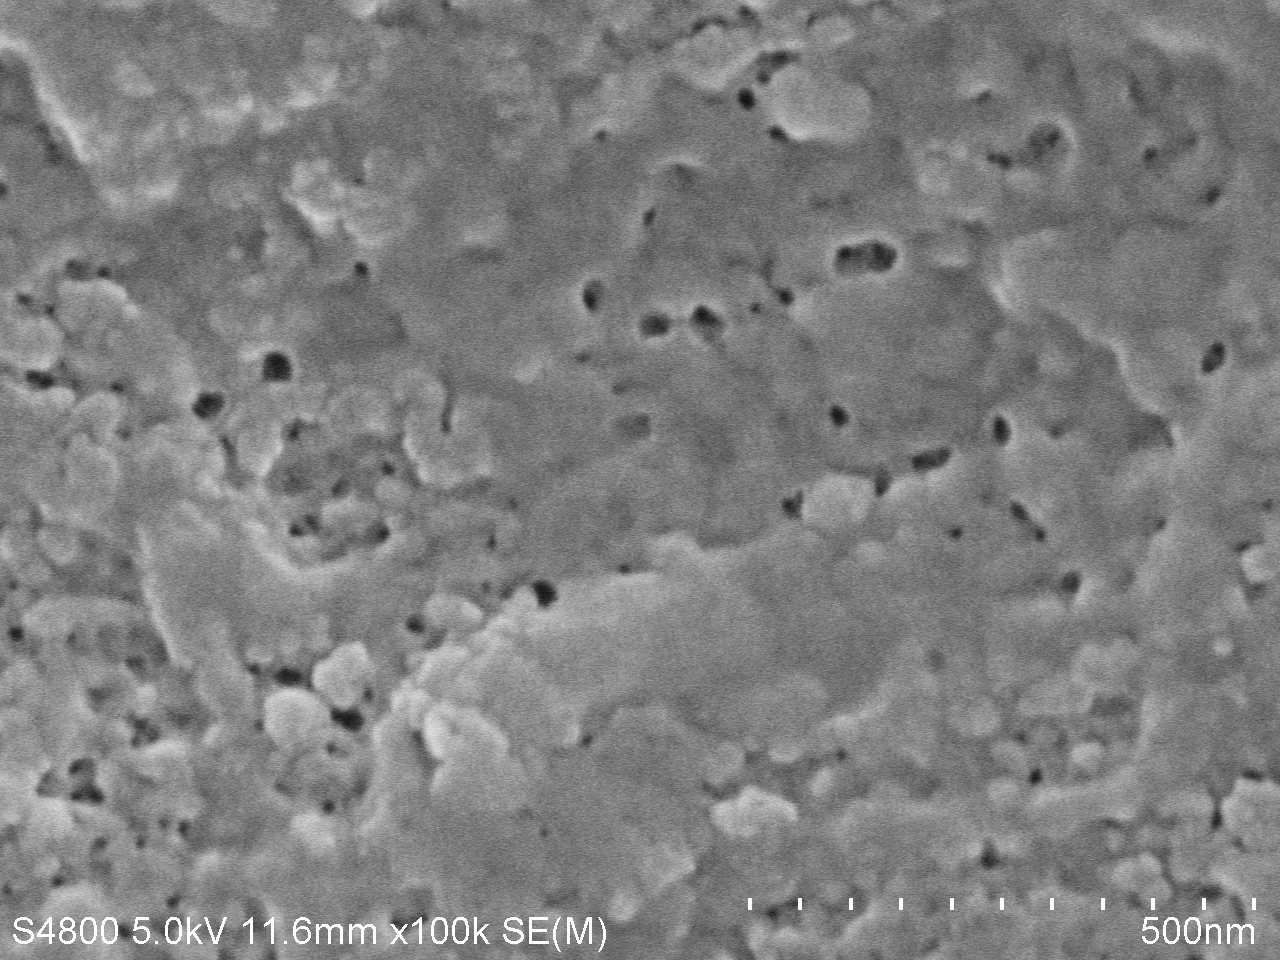
From these images, we can easily find that after cultured with Bacillus subtilis trasformed with PETase for only 7 days, the PET film showed clearly holes on its surface. What is more, with the extension of cultured time, the holes become more clear, as showed in the figure 3 and 6. These images undoubtedly verify that the PET film is degraded by the PETase synthetized by Bacillus subtilis.
Using the Real World Simulated Microbial Consortium
The inspiration of the idea of microbial consortium comes from nature. Actually, bacteria never exist alone in our nature, they co-work and cooperate together to achieve an aim or live better in a special condition. Thinking from this point, we established a special bacteria consortium for this enzyme catalysis reaction in order to not only improve the degradation effect, but also simulate the real world condition. In this system ,we applied three kinds of organisms, Pseudomonas putida KT2440, Rhodococcus jostii RHA1 and Bacillus stubtilis 168 (or Bacillus stubtilis DB 104), to degrade the PET and the harmful product EG and TPA to carbon dioxide or generate biodegradable plastic PHA. The culture medium of this consortium contains significantly less carbon source than common culture medium, which has a clearly similarity with the nature environment. We also decided to introduce the Cyanobacterial into the system in the future in order to make this system use only solar energy to work.

Results of Protein Engineering
By expressing our twenty-two PETase mutants and doing the assay in our high-throughput strategy—Cell-free protein synthesis, we successfully screened out a mutant with two-fold PET degradation activity compared to wild-type PETase.
We used PET film as our substrate and detect the hydrolysis product mono(2-hydroxyethyl) terephthalic acid (MHET) at an absorption of 260nm. The result data are as follows.

The experiments were implemented at 39 centidregrees and statically reacted for 5 days with three parallels. The spectra was detected in a plate reader. This group includes 10 mutants, a wily-type PETase as a positive control and a blank buffer(buffer solution and the E.coli lysate) in CFPS system along with PET film as a negative control. The data is original with influence of expression quantity included.
A: A few mutants are of relatively low activity compared to wild-type, some may even be inactivated as their absorption curve shapes are not exactly the same with that of wild-type. But mutant I208V is much more efficient than wild-type. Also R90I and S207T showed higher activity compared to wild-type.
B: We selected the mutants with higher degradation quantity. The position of peak and the value of absorption are noted on the curve.
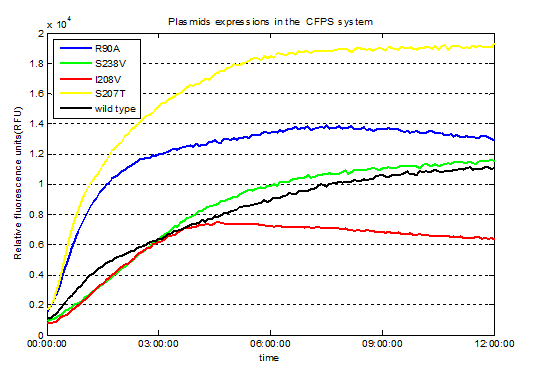
We used Cyan fluorescence protein (CFP) as a real-time approach to monitor protein expression quantity by detecting the fluorescence signal in the plate-reader. The emission wavelength of the CFP is 479nm and the absorption wavelength is 435nm. This is the real-time detection of emission wavelength at 479nm. We detected the fluorescence absorption for 12 hours before adding PET film substrate.
To exclude the influence of different expression quantity, we divided the quantity of production of PET degradation of each mutant by its expression quantity to gain the relative activity, since the final concentration of product is positively relevant to absorption at 260nm and protein expression quantity is positively relevant to the absorption of CFP at emission wavelength.
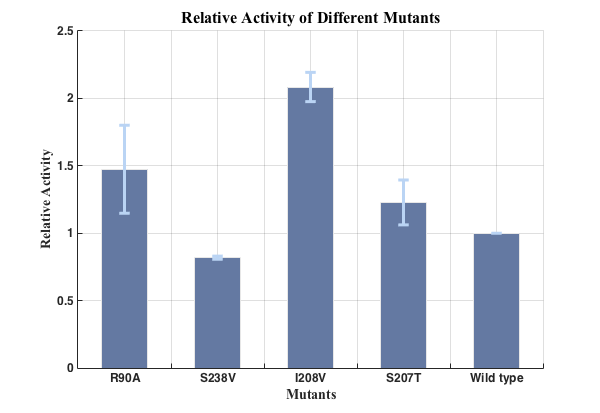
We successfully screened two mutants (I208V & R90A ) with higher enzyme activity by site-directed mutation.
You can find our part pages here: I208V(BBa_K2110105)
R90A(BBa_K2110104)

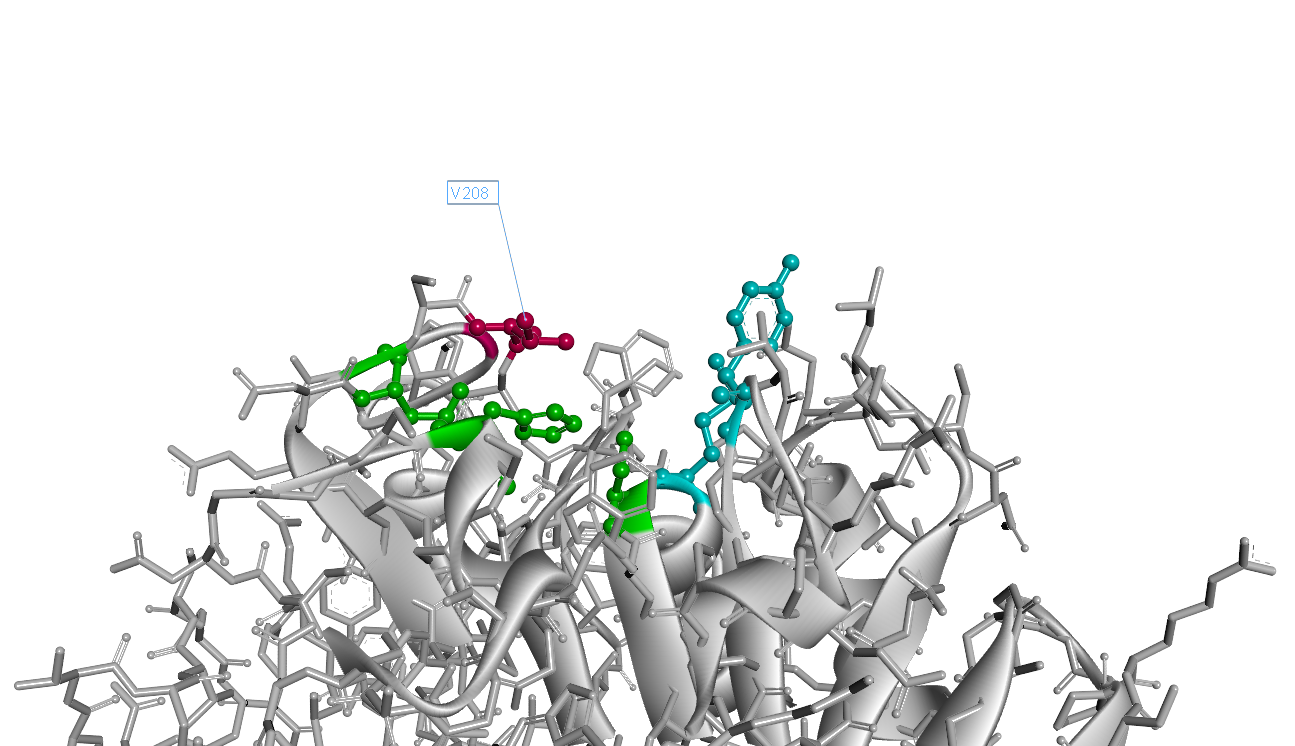
The 208th (with signal peptide excluded) amino acid residue isoleucine situates right over the catalytic triad(Fig.4). It is apperant that the interaction of catalytic triad with substrate would be inhibited due to the space oppcupied by 208th isoleucine. That's why we decided to substitue 208th isoleucine with another smaller amino acid.
Our result shows the rational design actually worked well and the mutant I208V shows a relatively improved hyfrolysis activity comparing to wild-type. Though as we can see in Fig.3, the substitution of isoleucine with valine is actually a very small change with a methyl on the 208th amino residue. However it leads to a two-fold improvement of enzyme activity, revealing that as we expected the 208th is a crucial site and the space adjacent to active center matters a lot.
Results of Microbial Consortium
Optimization of Culture Conditions
1. Exploration for an appropriate medium
(1) Co-culture in LB medium

Table.1. Microscopic examination of Co-culture in LB medium
Results of microscopic examination indicate that co-culturing these bacteria is impossible in LB medium.
(2) Co-culture in YPD medium

Table.2. Microscopic examination of Co-culture in YPD medium
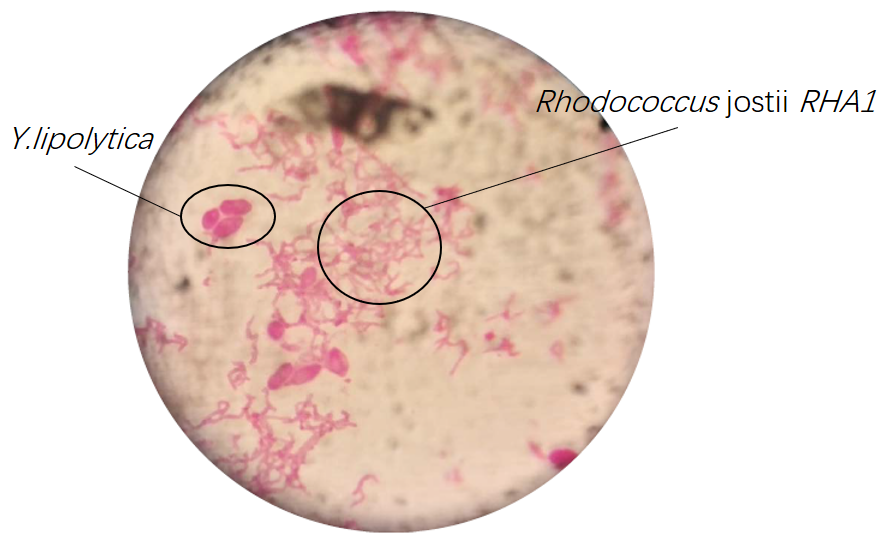
Results of microscopic examination indicate that co-culturing these bacteria is impossible in YPD medium except Rhodococcus jostii RHA1 and Y.lipolytica.
(3) Co-culture in M9 medium
We cultured bacteria as experiments for three days, and checked the bacterial concentration at OD600(See Fig.2 in details) and detectd the concentration of TPA by UV at OD242(See Fig.3 in details).


After analyzing graphs, easily, we can get a conclution that Rhodococcus jostii RHA1 can degrade TPA particularly well and Pseudomonas putida KT2440 can not degrading TPA. Obviously, Rhodococcus jostii RHA1 and Pseudomonas putida KT2440 can not live with each other in M9 medium because Group R.j + P.p is the same as control regarding concentration of TPA.
(4) Co-culture in W medium
We cultured bacteria as experiments for three days, and checked the bacterial concentration at OD600(See Fig.4 in details) and detectd the concentration of TPA by UV at OD242(See Fig.5 in details), then, observed some sample with microscope(See Fig.6 in details)
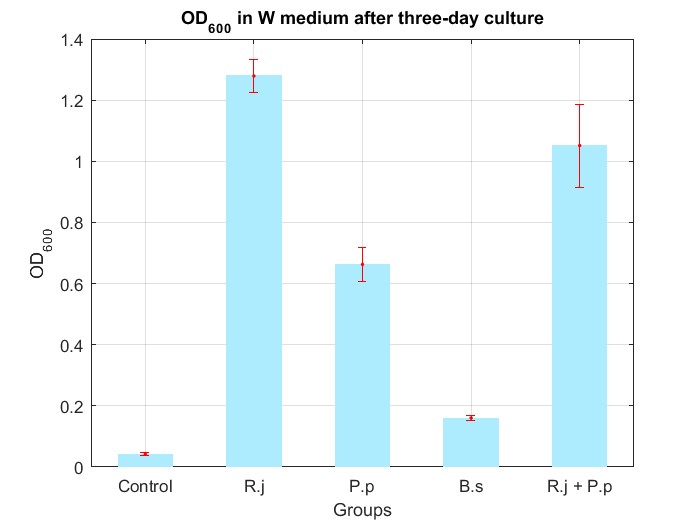
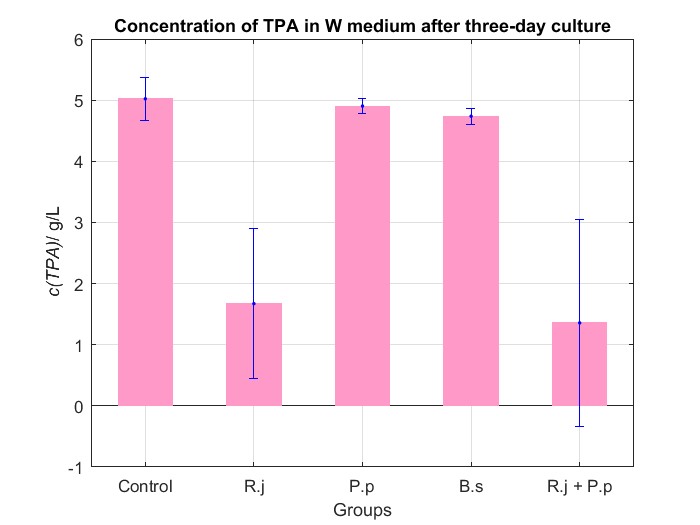
By Fig.4 and Fig.5, we can find that TPA of both Group R.j and Group R.j + P.p was degraded markedly, and degrading quantity of Group R.j + P.p is slightly larger than Group R.j. Then, by Fig.4, Fig.5, Fig.6, Fig.7, Rhodococcus jostii RHA1 and Pseudomonas putida KT2440 can be co-cultured in W medium. Besides, Bacillus stubtilis can grow better in W medium compared with M9 medium.


2. Adjustment of nitrogen source
We choose two groups of experiments to show how to change growing condition of bacterial consortium by adjusting nitrogen source. Cell growth curve and TPA concentrations changes in W2 and W3 medium are shown as Fig.8, Fig.9 and Fig.10, Fig.11, respectively.


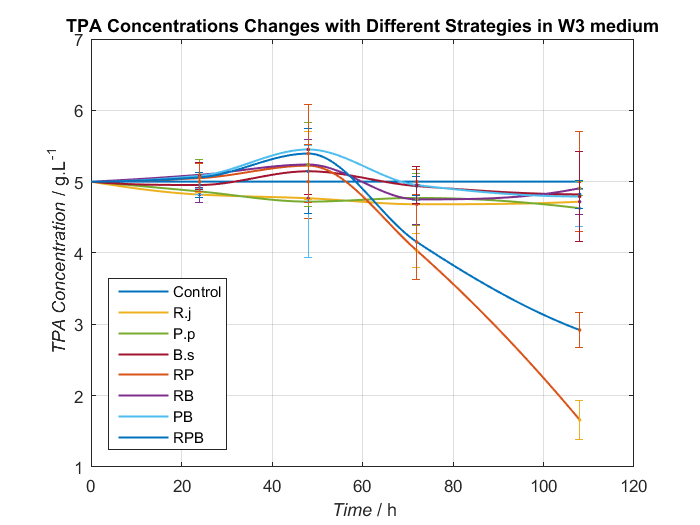
By analyzing data we have had, Bacillus stubtilis grow best in W3 medium, and in W2 and W3 medium, group RPB can both degrading TPA well. Because Bacillus stubtilis is main player to secret PETase and MHETase, we decide to add KNO3 to adjust nitrogen source at last.
3. Temperature
We cultured Rhodococcus jostii RHA1, Pseudomonas putida KT2440, Bacillus stubtilis 168 in W9 medium at 30 degrees and 37 degrees respectively. Growing conditions of bacteria the next day are shown as Fig.12.

We found that Bacillus stubtilis grew a little better at 37 degrees, however, Rhodococcus jostii could not grow at 37 degrees. So we finally chose 30 degrees as culture degree of bacterial consortium.
4. Influence of Cl-
By accident, I found Bacillus stubtilis could not grow well without Cl-, but Rhodococcus jostii RHA1, Pseudomonas putida KT2440 grew as usual. Therefore, we prepared a series of medium(add NaCl to W medium without NH4Cl ) to explore influence of Cl-. Growing conditions of Bacillus stubtilis the next day are shown as Fig.13.

(PS: Because W9 medium includes NH4Cl that disrupts our exploration to influence of Cl-, so we replace NH4Cl with (NH4)2SO4 which consists of same concentration of NH4+.)
From Fig.13, we conclude that increasing the concentration of Cl-can contribute to growth of Bacillus stubtilis, but after exceeding certain concentration, acceleration of Cl-disappears.
5. Adjustment of carbon source
We added sucrose to improve growing condition of Bacillus stubtilis, then, Cell growth curve and TPA concentrations changes in W9 medium are shown as Fig.14, Fig.15, respectively.

6.Optimum medium
Basing on experiments above, we synthesize some conclusion and design some better media to give bacterial consortium a better surrounding to degrading PET. After processing data, we find W18 medium (without PET films) can make our consortium work better(Fig.16 and Fig.17).
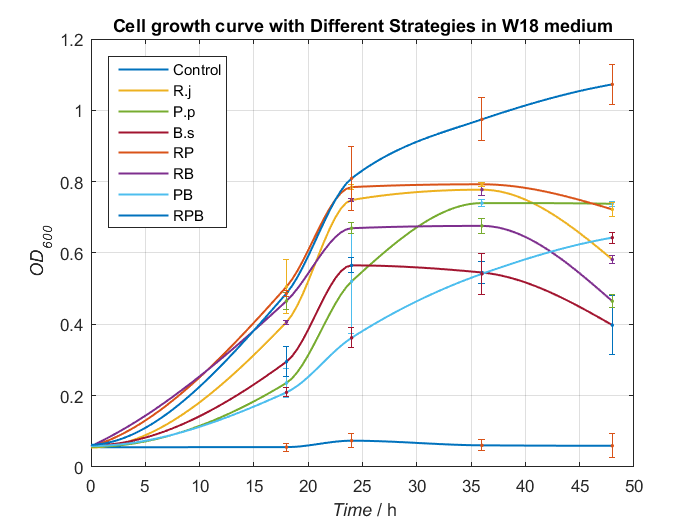

To our delight, in the medium, Bacillus stubtilis can grow better than experiments before and group RPB can degrading TPA more efficiently. Eventually, we succeed in construct a relatively more stable bacterial consortium.
Later, in order to confirm coexist of three bacteria, we firstly observed sample under the microscope(Fig.18 and Fig.19).


Regrettably, results of microscopic examinations can not confirm coexist of three bacteria certainly, therefore, we use 16SrDNA to examine further.
7.results of the first colony-pcr of 16s-rDNA: provident the specificity of the primers
The first round of colony-pcr helped us to prove the specificity of the primers. The number was collected in advance in Table 3. The result was showed in Figure 20. Only on three parallel lanes of the gel(number 1,5 and 9),three set of DNA molecules of known size(1000bp for number 1, 1500bp for number 5, 1600bp for number 9) were run.

Table.3. the number of 16s-rDNA in the first colony-pcr : the provement of primer

If number 1 had a set of DNA molecules rather than number 2/3, we got the conclusion that the primers—‘RJ-S/A’ could only get the 16s-rDNA gene of Rhodococcus RHA1 rather than ones in Pseudomonas putida KT2440 and Bacillus subtilis 168. Also,DNA molecules in number 5 and 9 could prove the specificity of the primers of other two bacteria.
8.results of the second colony-pcr: provident the possibility of consortium
At the second round, we were going to prove the possibility of consortium. We cultivate each of them and the mixture of three in the modified W0 culture medium which changed the carbon source from glucose to sugar for amplification. The numbers and formula were collected in the Table 4. The result was showed in Figure 21.

Table.4. the number of 16s-rDNA in the second colony-pcr : the possibility of consortium
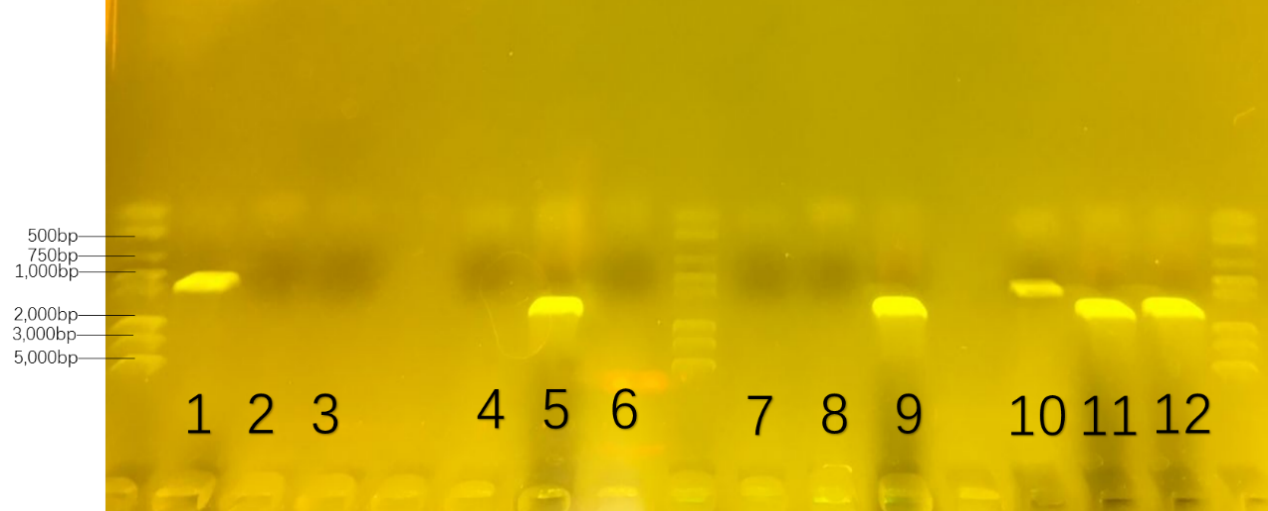
On six parallel lanes of the gel(number 1,5,9,10,11,12), six set of DNA molecules of known size( 1000bp for number 1 and 10 ; 1500bp for number 5 and 11; 1600bp for number 9 and 12) were run. From the DNA band of number 1,5 and 9,we could analyze that three bacteria growed well in each modified W0 culture medium. From the DNA band of number 10,11 and 12 , we could delightedly prove that three bacteria growed well together in the modified W0 culture medium.
In conclusion, we cultivated consortium of three bacteria in the modified W0 culture medium by the validation of 16s-rDNA.
Modification of Bacillus subtilis
1.the degree of PET degradation in Bacillus subtilis
The Plasmid-PHP13-p43 is isolated and enzyme digested using EcoR I and BamH I restriction enzyme. After gel extraction to get right band, construction of pHP13-p43 + PETase and pHP13-p43 + MHETase are caught out.(Figure 22).

Then we transport the recombinant plasmid in Bacillus subtilis 168 and Bacillus subtilis DB104. We cultivate four different strain(wild Bacillus subtilis 168,recombinant Bacillus subtilis 168 ,wild Bacillus subtilis DB104,recombinant Bacillus subtilis DB104) and blank control group in LB medium with PET slices. After 7 days, we measure the absorbancy of the product from 230nm to 300nm (Figure 23).

The curves of degradation of PET in different Bacillus subtilis pass through a maximum when the absorbancy is within 260-280nm. Also, we found the improvement in recombinant one(B.s 168+PETase/ B.s DB104+PETase) compared to three control group(B.s 168/B.s DB104/control). That was the basic provement of degradation.

From the absorbancy at 265nm in the picture, we can compare the the degree of PET degradation.Easily to see in Figure 24, Bacillus subtilis DB104 has a better secretory ability than Bacillus subtilis 168 in consideration of the higher absorbancy at 265nm, which represent the absorption peak of MHET. Also, the result helped us to affirm that PETase gene expressed well in Bacillus subtilis after using codon optimization.
2.the degree of PNPA degradation——new discovery
We make the first step of PNPA degradation after the success of transport. However, we fail to find the absorption peak of PNP at 400nm in experimental group.At first ,we attribute this result to PNP decomposition(Figure 25).Then, we search on the Internet and find that Bacillus subtilis has the ability to degree PNP.So we cannot use the degree of PNPA degradation to measure enzymatic activity.

Modification ofPseudomonas putida KT2440
Proof of overexpression in P.putida KT2440
After the experiment design was finally confirmed, we started to establish the overexpression vector based on the shuttle plasmid pBBR1MCS-2 as we described on the Experiment Page. The aim of this overexpression vector is to make KT2440 utilize EG more efficient and tend to accumulate PHA in bacterial body.
After plasmid pBBRAA (pBBR linked with AcoA and AceA) was successfully transformed into E.coli, we amplified and extracted it from E.coli to prove that the target genes had been successfully ligated into pBBR. We proved it by PCR of pBBRAA and the result is showed as below.

The PCR’s results confirmed that the target genes were ligated into pBBR, which meant the overexpression was successfully established. Then, we transformed it into P.putida KT2440 by electroporation.However, we met some problem unsolved in the electroporation.So we need some improvement in the future.
A Controllable Lipid Producer
The efficiency of Lysis System
For the construction of Synechocystis 6803-Inducible Lysis System, three lysis genes were synthesized by GENEWIZ (Figure 28), and we ligased them through overlap. After splicing those to the T vector, we put Pni, a promoter responding to Ni2+, to the upstream of lysis genes to make a nickel sensing signal system.
Up to now, we constructed the expression vector successfully and transformed it into Synechocystis 6803 via electroporation.

We hope that after adding nickel sulfate to the cultures, cyanobacteria could split in a few days, releasing plenty of lipid to feed others as the source of carbon in our mixed bacteria system.
Results of R-R system
Results of inclusion body based reporting system.
The red fluorescence can be observed by bare eyes. We set up four groups:
A. No E.coli.
B. E.coli with empty plasmid pUC19.
C. E.coli with pUC19+CpxR-RFP.
D. E.coli with pUC19+CpxR-RFP+PETase gene.
The result is as the following picture. (After centrifugation with the speed of 12000rpm for 1min)

Fig.1. Directed observed fluorescence of inclusion body based reporting system. (From left to right: A, B, C, D)
We found that the group with part BBa_K339007 and PETase gene showed deepest red in all of the four groups. The group with only part BBa_K339007 also showed a little red, we speculate that this might be caused by the basic expression of some genes in E.coli and some of the expression products formed inclusion bodies. It might also be caused by the basic expression of the RFP gene because the CpxR promoter might also, though not so strongly, start the transcription even without the induction of CpxR protein. The group with empty plasimd did not showed any red color and the group with no E.coli cultured did not have any sediment at the bottom of tube.
2.Results of cell lysis effect of ddpX gene.
We first did a experiment to measure the cell lysis effect of ddpX gene. We simply use the IPTG inducible T7 promoter to regulate the expression of ddpX gene. We totally set four groups:
1. E.coli wildtype.
2. E.coli wildtype added IPTG.
3. E.coli with ddpX gene, no induction.
4. E.coli with ddpX gene, IPTG added as induction.
Then we continuously measure the OD600 of the culture medium by 96-well Microplate Reader and draw the OD600-culturing time curve by Matlab. The graph is showed below.

From this image, we can see that in the first 5 hours, the OD600 of each group is almost the same because of the rich nutrition and the ddpX cannot take effect immidiately. However, after 5 hours, the group with ddpX transformed and IPTG induced showed the fastest decrease among all the groups. This is because of the cell lysis effect of ddpX. Comparing the group with ddpX gene and IPTG inducted with the group with wildtype bacterial and the same amount of IPTG added we can draw the conclusion that the ddpX gene can cause cell lysis significantly. However, the data of another two groups are a little strange. We think it is because of the basic expression of ddpX can partly hydrolyze the peptidoglycan in the cell wall and provide cells with D-Ala as carbon source. This is exactly the physical use the the ddpX gene when the cell is under starvation condition, see more details about this explanation in our experiment page. Therefore the group with ddpX gene but no induction can live longer and better when the nutritions are deficient.
Summary
1.We implemented the cell-free protein synthesis system as a rapid high-throughput assay method.
2.We designed twenty-two PETase muatnts and successfully screened two mutants of the wild type PETase with higher enzyme activity.
3.We successfully established a special bacteria consortium-Bacillus stubtilis 168 or DB104, Rhodococcus jostii RHA1 and Pseudomonas putida KT2440 for this enzyme catalysis reaction. We use 16s-rDNA to prove the existence of special bacteria consortium.
4.We optimized culture conditions by changing carbon source, nitrogen source and some ions. After checking the growth situations and conditions of the degrading PET, TPA and EG, we explore a suitable culture condition to co-culture our bacteria consortium.
5.We constructed pHP13-P43-PETase/MHETase plasmid for Bacillus stubtilis 168 or DB104. The recombinant strain had the ability to degree PET. Also, we found PNPA couldn’t characterize of enzyme hydrolysis rate.
6. In order to increase the Pseudomonas putida KT2440’s intake of EG, we found the main influential genes---AceA and AcoA and successfully established an overexpression vector in Pseudomonas putida KT2440, which makes this bacterium can utilize EG more efficiently.
7.We successfully applied and improved the previous part BBa_K339007 designed and constructed by the Group iGEM10_Calgary to construct our inclusion body based reporting system and inclusion body based cell lysis regulation system.
8.The red fluorescence can even be directly observed by bare eyes when we express the PETase gene in E.coli which was transformed into the CpxR-RFP fragment.
9.We measured the cell lysis effect of the novel ddpX gene and combined it with the PETase expression system in E.coli.