Team:Vanderbilt/Experiments/qPCR
![]()
Quantitative PCR
qPCR to Measure UV-induced Mutation
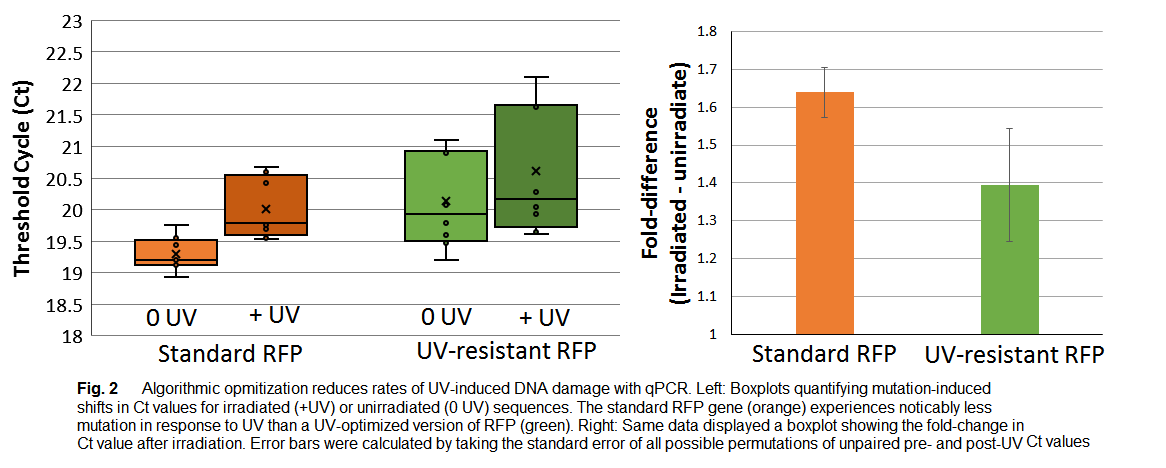
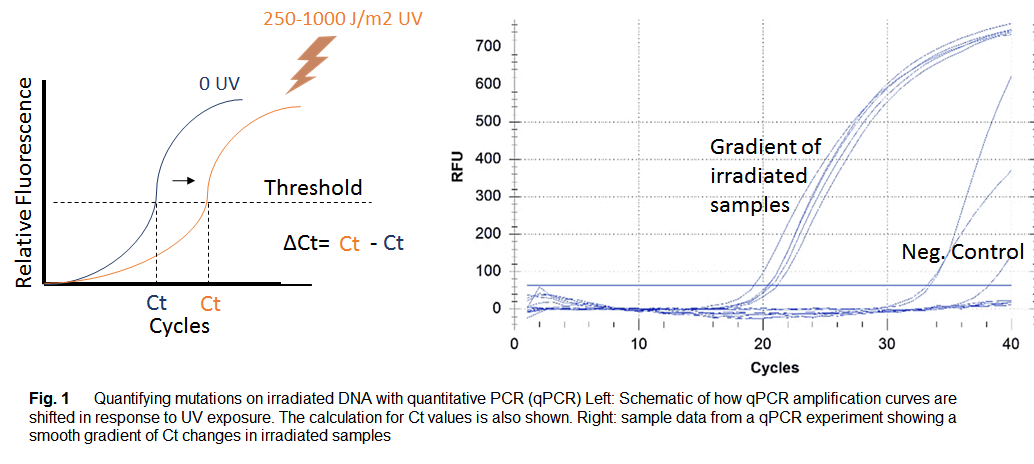
Protocol optimization led to stable reaction conditions when 15ul per sample and 105 DNA molecules per well were used for each qPCR run. From the mean C(t) and standard deviation of the qPCR run shown in Fig 2, we observed consistency among the same samples with a C(t) range of 20.36 to 21.16 and a mean of 20.39 C(t) (standard deviation = 0.690). As a comparison, the negative control samples containing no DNA showed C(t) values with magnitudes greater than 30 cycles. We generated a dose-dependence curve to assess linearity of the relationship between the magnitude of UV exposure (J/m2) and C(t) value. The pyr 50 sample was exposed to UV doses of 500, 600, 1000, 1500 J/m2 in triplicate and we generated mean C(t) values for each treatment. A strong positive correlation was observed between UV dose and mean C(t) values (R2 = 0.992).
We tested the effectiveness of our “RFPuv” optimization for the E1010 RFP sequence by performing qPCR runs comparing UV-exposed (500 J/ J/m2) and unexposed DNA samples (Fig 4). Our optimized RFPuv sequence (part: BBa_K1673101) was synthesized to achieve a 35% predicted reduction in UV mutation rate using the parameters in our algorithm. Fig 4a illustrates the raw C(t) values for UV-exposed and UV-unexposed E1010 RFP and optimized RFPuv samples. As depicted in Fig 4b, we observed a lower ΔC(t) in the RFPuv sequence-optimized from (0.725) compared to the E1010 RFP sequence (0.48). Taken together, our qPCR results suggest that the sequence optimization was effective in reducing the amount of UV-induced damage at the RFP locus.