Team:Virginia/Description

Experiments
Design
Summary
Parts
Modeling
Abstract
Synthetic biologists struggle to prevent the proliferation of genetically engineered organisms (GEOs) in natural systems. Containment methods that operate in ecological settings must provide security comparable to physical containment. Current methods fail to effectively inhibit horizontal gene transfer and environmental supplementation, and impose evolutionary pressure through the propagation of spontaneous revertants. Synthetic Translational Control (STC) currently utilizes a redesigned leucyl-tRNA synthetase and cleavage enzyme in an E. coli chassis to confer metabolic dependence on a synthetically modified leucine capable of conversion to L-leucine. Due to the semi-semantic property of this device, organisms cannot metabolically bypass our constraints using environmental supplementation and will display greater resistance to evolutionary escape relative to traditional synthetic auxotrophs. Our work provides advancement in biosafety by isolating GEOs from the environment via a reliance on modified metabolites. STC will become a benchmark for biocontainment devices and will allow for countless new applications in synthetic biology.
Pepsin Modeling
Purpose
In order to determine the relative efficiency of our enzyme, we modeled another BioBrick. BBa_M1436 codes for pepsinogen, an inactive form of the cleavage enzyme pepsin. Pepsin is a nonspecific cleavage enzyme that cleaves dipeptide bonds between amino acids. Comparisons between pepsin and our enzyme may yield interesting results, specifically regarding the relationship of substrate concentration as it varies over time.
Results
Modeling was conducted by solving for Michaelis-Menten equations in MatLab. Both Equilibrium (EA) and Quasi-Steady-State (QSSA) Approximation were used to modeling reaction rates. To determine which approach would have the most accurate results, we analysed the two error equations,  for EA and
  for QSSA. Once analysed, it became apparent that the error term of EA would always be greater than one, while the error term of QSSA was sometimes within bounds. Future graphs do not display values that fall outside of the established error ranges.
Varying concentrations of substrate and enzyme were run through the QSSA equation:  . Results were visualized on two concentration ranges, 0 to 10 mM and 0 to 1 mM. This was influenced mainly by the fact that, as [E] decreased, more values fell within error bounds.


On the left is the short range graph of reaction rates over [S]. This graph shows a zoomed in image of the low concentration reaction rates. On the right is the wide range graph of reaction rates over [S]. As concentrations of [E] decrease the number of data points that satisfied the error bounds increase. The values shown at high concentrations on the larger range determine the bounds of possible concentrations used in the next step of modeling.
Analysis of the change in reactant concentrations over time was done using a system of four differential equations. The rate constants used were found in literature or derived from known values. The values found were: Association Constant, Catalytic Rate, and the Michaelis Constant. From there the following values were derived: Forward Rate of Reaction and Reverse Rate of Reaction. A standard [S] that could be used to compare Pepsin kinematics with literature based data regarding the our enzyme was calculated based on values found in a paper written by Nanduri et alrefReference:
Nanduri, V.B., Goldberg, S., Johnston, R., and Patel, R.N. (2004). Cloning and expression of a novel enantioselective N-carbobenzyloxy-cleaving enzyme. Enzyme and Microbial Technology 34, 304–312.
. In this study, they found a 100% cleavage rate over 48 hours at an estimated concentration of 6mM substrate - This value was calculated from an estimated mass of a Cbz-amino acid molecule.

In order to draw meaningful conclusions from the concentration data, [S] was set to 6mM. As shown in the Long Range Rate of Reaction graph above, possible values along [S] = 6 is limited to a range of 0 to 2 mM of enzyme. The following graphs simulate the differential equations in [E] steps of 0.5mM from 0.5 to 2.


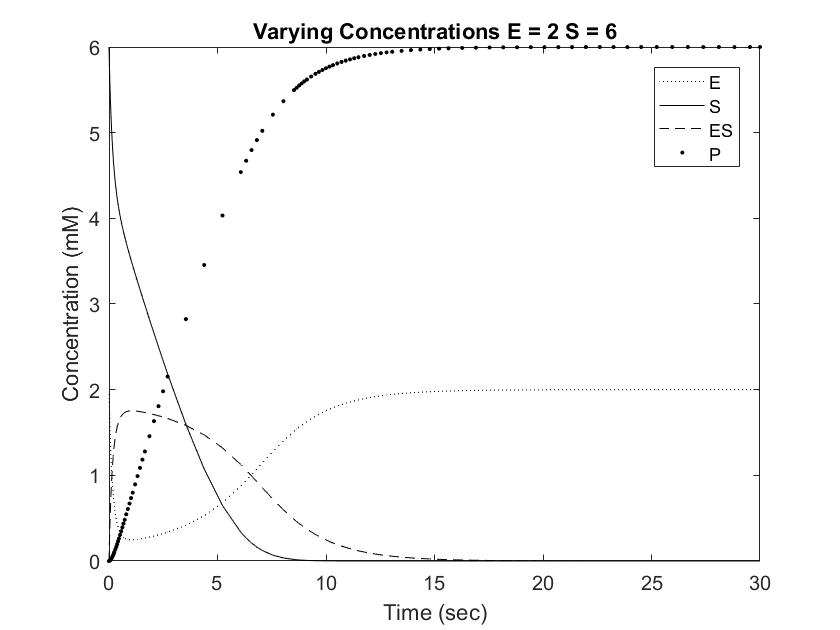
Setting [S] to 6mM ensures that the rate of reaction will always be near Vmax, or the maximum rate of reaction achievable, save for situations involving very high [E]. One location where pepsin naturally occurs is in the gut at a concentration of approximately 35mM. This value is difficult to model with Michaelis approximation due to the large error at large [E], but can be estimated using very low [S] and [E]. As shown in the Short Range Rate of Reaction graph above, the values at low [S] exhibit very clean curves down to 0. Out of curiosity, we modeled value at [E] = [S] = 0.5 to visualize the relationship between the concentrations when the rate of reaction is not equal to Vmax.

Conclusions
Pepsin acting on a [S] of 6mM reached full conversion of substrate into product within 30 seconds. This rate is significantly faster than the Cbz-enzyme, which had recorded rates of 100% conversion over 48 hours. Furthermore, pepsin concentrations in the body are usually much higher than the tested 0.5 to 2 mM, which would result in even great rates of conversion. As shown in the graphs above, increasing [E] from 0.5 to 1 resulted in an almost doubled rate of product formation. This relationship can be expected to remain constant in the Cbz-enzyme, demonstrating that small increases in concentrations can result in dramatic changes in the concentration curve. Going forward, this information can be used to test and modify the rate of Cbz-enzyme expression in order to optimize the synthetic system.