Qiuxinyuan12 (Talk | contribs) |
Qiuxinyuan12 (Talk | contribs) |
||
| (8 intermediate revisions by 3 users not shown) | |||
| Line 333: | Line 333: | ||
<span style="line-height:46px;" class="line">Development of A Novel</span></span> | <span style="line-height:46px;" class="line">Development of A Novel</span></span> | ||
<span style="line-height:46px;" class="line-wrap"> | <span style="line-height:46px;" class="line-wrap"> | ||
| − | <span style="line-height:46px;" class="line">Blood-MicroRNA | + | <span style="line-height:46px;" class="line">Blood-MicroRNA Handy Detection System with CRISPR</span></span> |
<!--</a>--></h2> | <!--</a>--></h2> | ||
</div> | </div> | ||
| Line 379: | Line 379: | ||
<h1> | <h1> | ||
| − | <span><span style="color:# | + | <span><span style="color:#7f1015">Results</span></span> |
</h1> | </h1> | ||
| − | + | </br> | |
| − | + | ||
<h2> | <h2> | ||
| − | <span><span style="color:#7f1015"> | + | <span><span style="color:#7f1015">Wet Lab</span></span> |
</h2> | </h2> | ||
</br> | </br> | ||
| Line 445: | Line 444: | ||
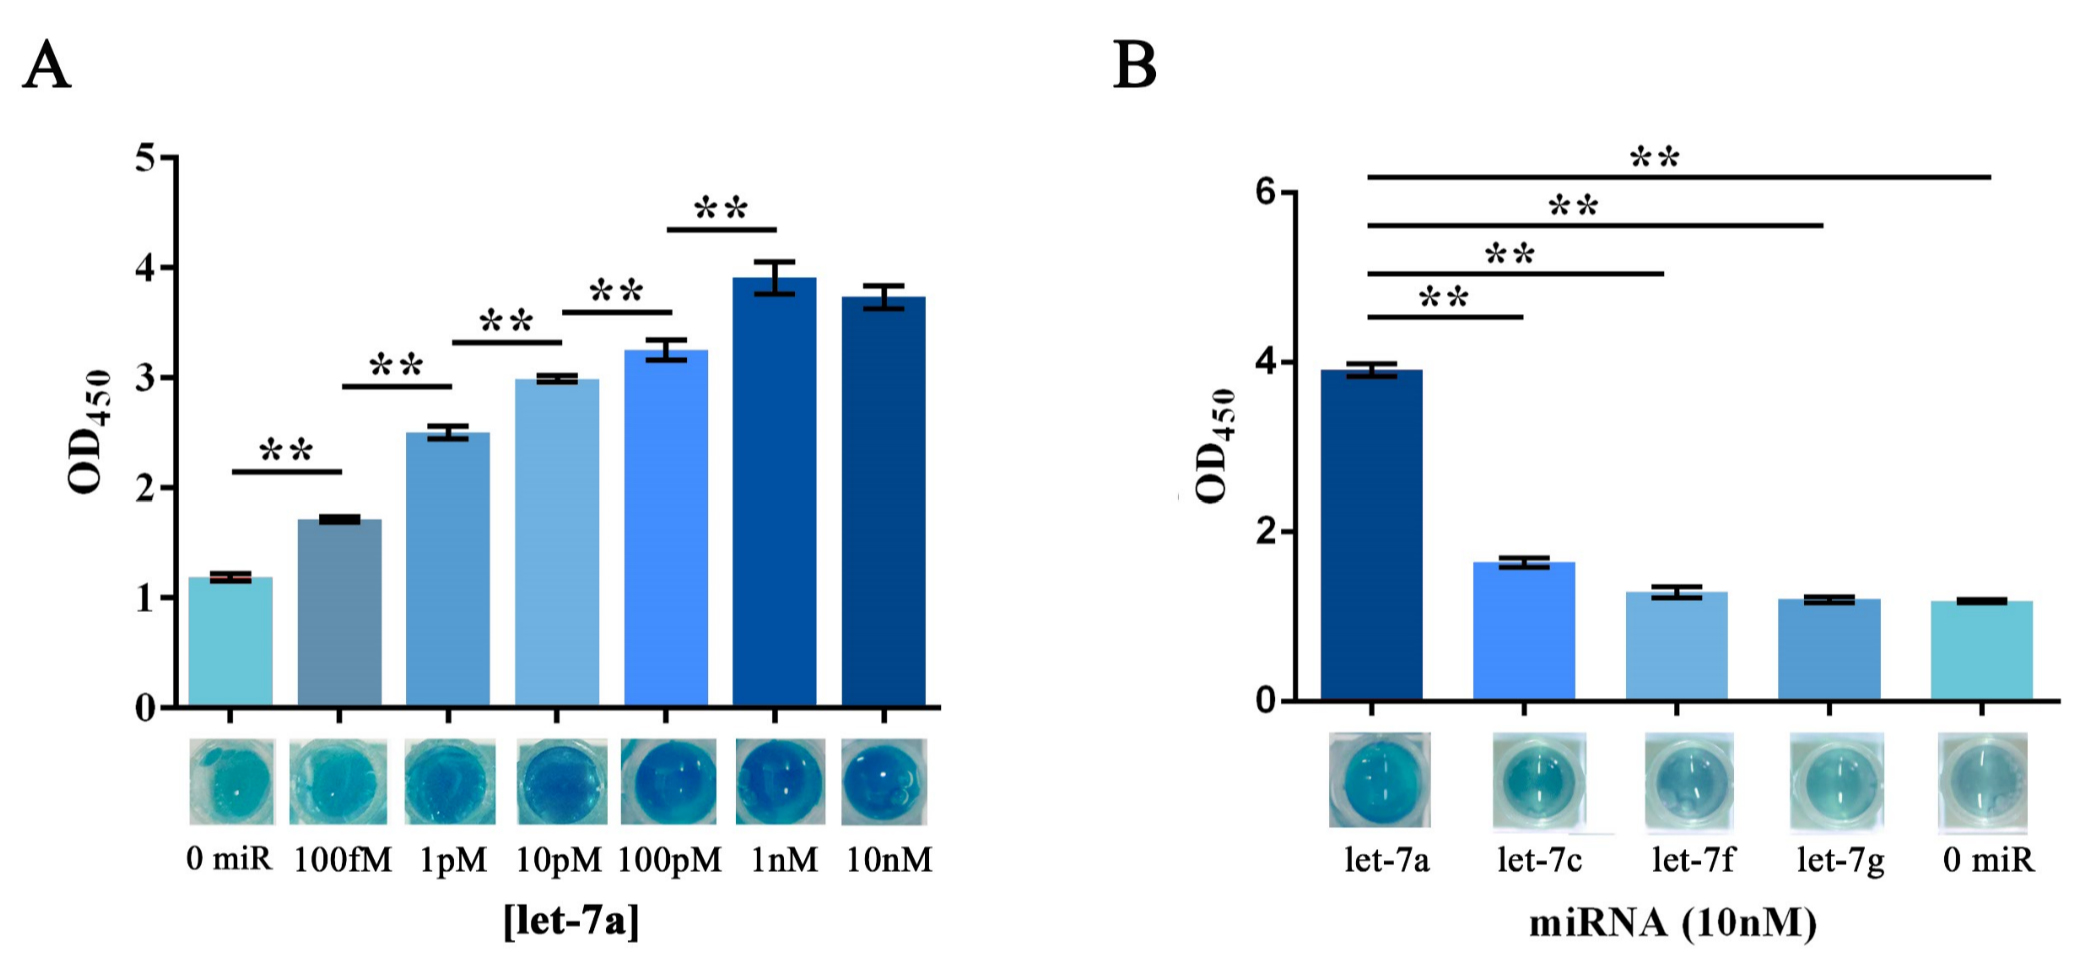
<span style="line-height:2;font-family:Perpetua;font-size:18px;">For | <span style="line-height:2;font-family:Perpetua;font-size:18px;">For | ||
the primary verification and assessment of the sensitivity and specificity of | the primary verification and assessment of the sensitivity and specificity of | ||
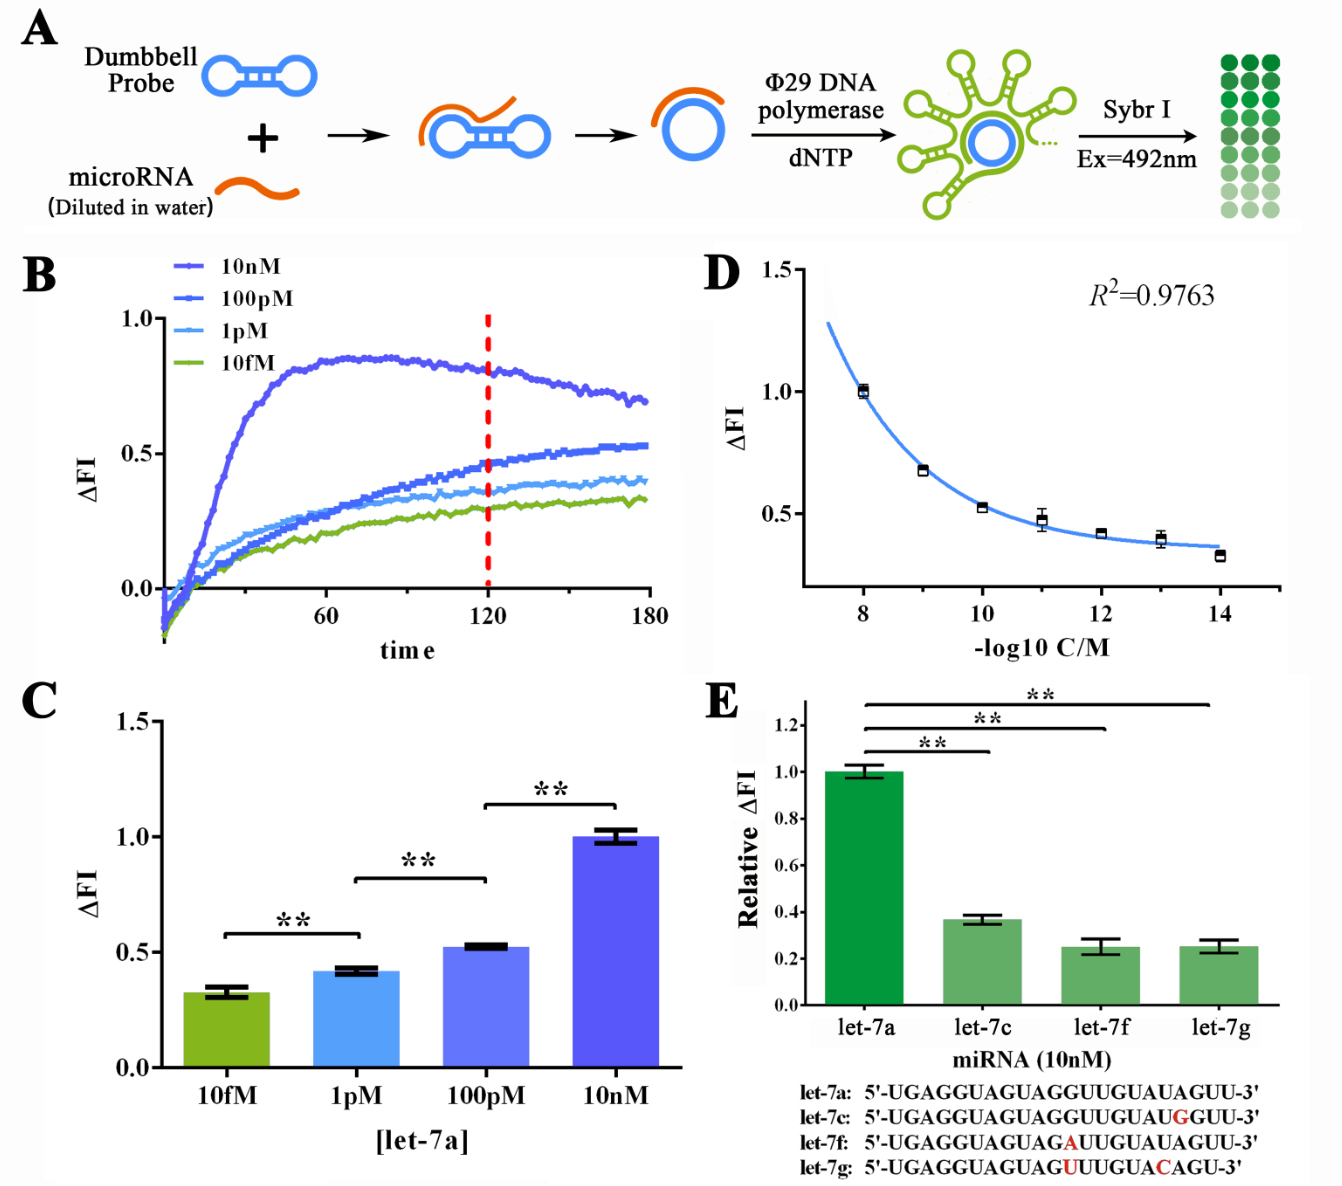
| − | the miRNA initiated RCA reaction, let-7a, as the target miRNA was | + | the miRNA initiated RCA reaction, let-7a, as the target miRNA was DISSOLVED IN |
DEPC-TREATED WATER for various concentrations to determine the sensitivity of | DEPC-TREATED WATER for various concentrations to determine the sensitivity of | ||
RCA reaction (Figure 2A). The specificity of RCA reaction was assessed through four | RCA reaction (Figure 2A). The specificity of RCA reaction was assessed through four | ||
| Line 465: | Line 464: | ||
coefficient (R</span><sup><span style="line-height:2;font-family:Perpetua;font-size:18px;">2</span></sup><span style="line-height:2;font-family:Perpetua;font-size:18px;">) of 0.9763. THE SENSITIVITY OF SUCH METHOD WAS ALSO ESTIMATED | coefficient (R</span><sup><span style="line-height:2;font-family:Perpetua;font-size:18px;">2</span></sup><span style="line-height:2;font-family:Perpetua;font-size:18px;">) of 0.9763. THE SENSITIVITY OF SUCH METHOD WAS ALSO ESTIMATED | ||
TO BE UNDER 1FM (3 times higher than the standard division of the blank group). | TO BE UNDER 1FM (3 times higher than the standard division of the blank group). | ||
| − | As for the specificity of RCA reaction in water- | + | As for the specificity of RCA reaction in water-dissolved samples, a 2-hour RCA |
reaction was performed under the 10nM input concentration of let-7a, let-7c, | reaction was performed under the 10nM input concentration of let-7a, let-7c, | ||
let-7f and let-7g solutions. Results showed an at least 5-time difference among | let-7f and let-7g solutions. Results showed an at least 5-time difference among | ||
| Line 494: | Line 493: | ||
<span style="line-height:2;font-family:Perpetua;font-size:18px;">To | <span style="line-height:2;font-family:Perpetua;font-size:18px;">To | ||
further determine if such great sensitivity and specificity could be maintained | further determine if such great sensitivity and specificity could be maintained | ||
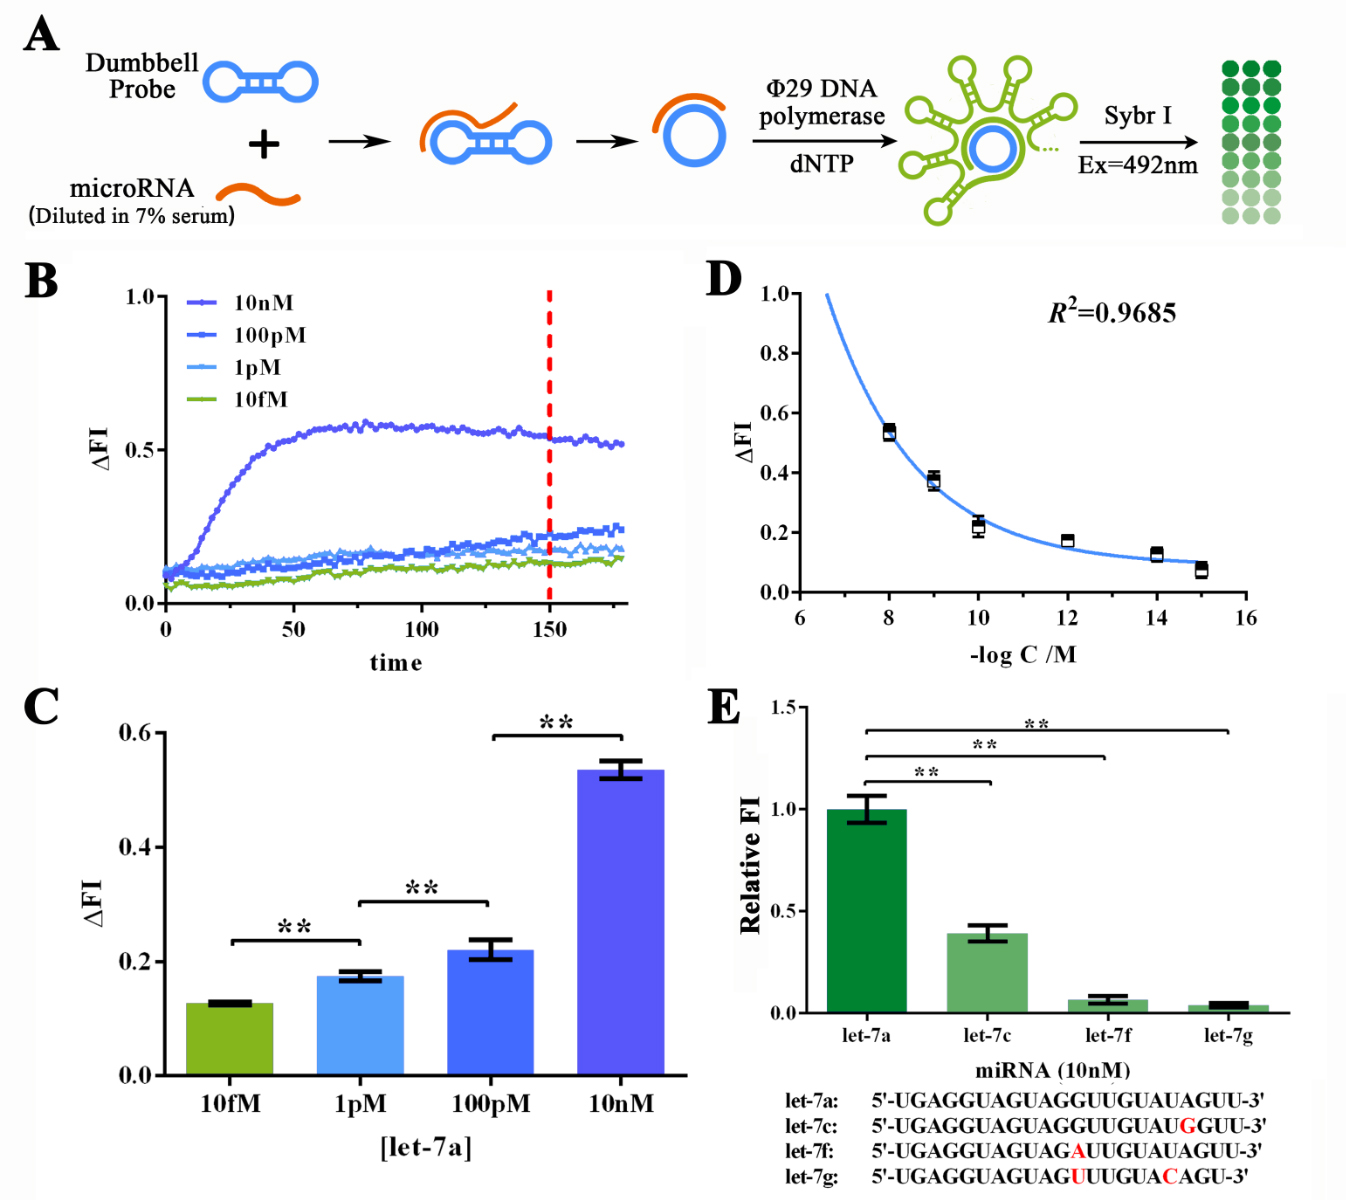
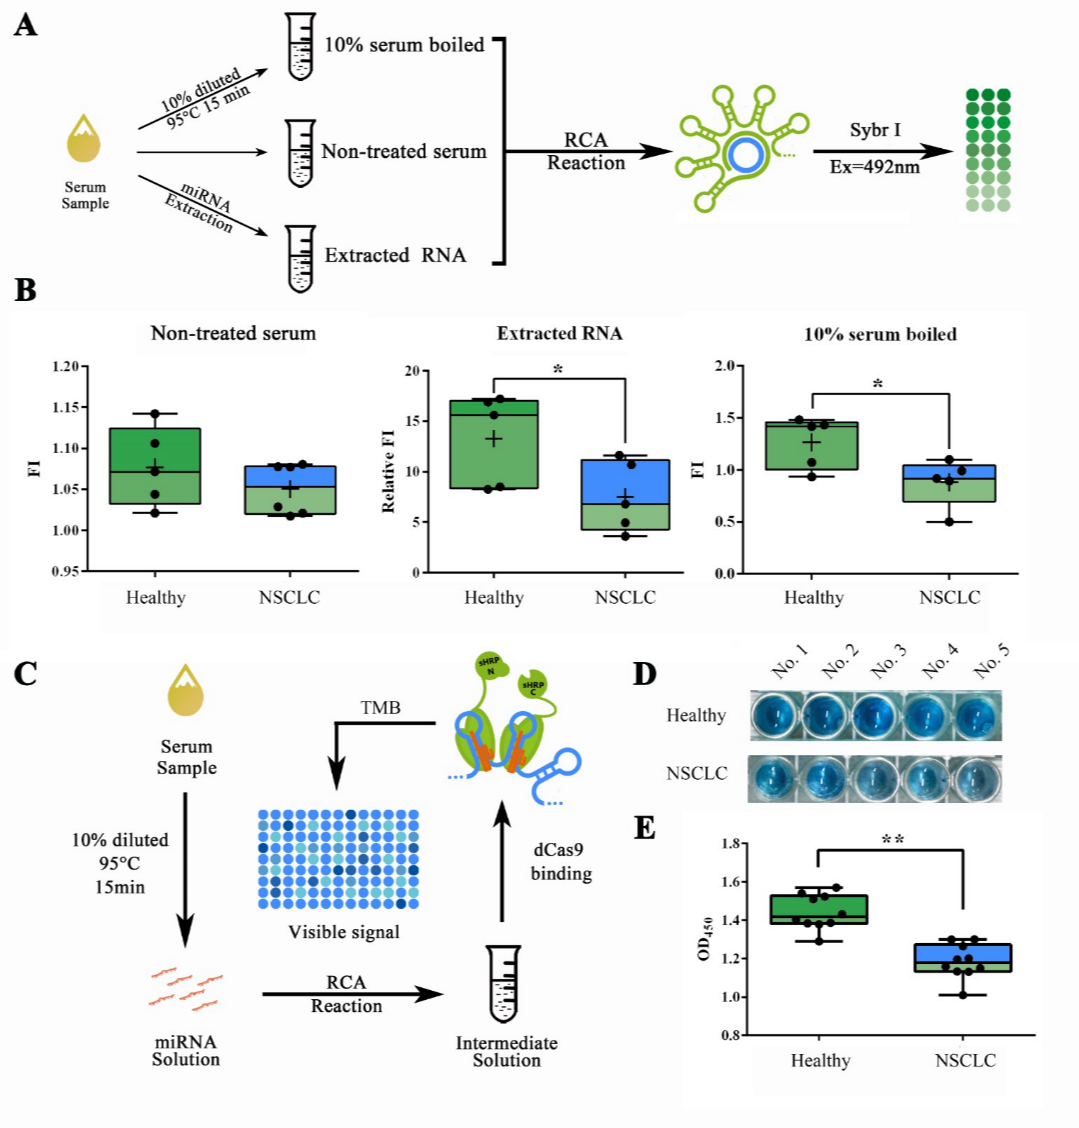
| − | working on MORE COMPLICATED SAMPLES SUCH AS SERUM, we then | + | working on MORE COMPLICATED SAMPLES SUCH AS SERUM, we then dissolved let-7a in |
7% human serum for various concentrations to determine the sensitivity of RCA | 7% human serum for various concentrations to determine the sensitivity of RCA | ||
reaction under such condition (Figure 3A). The human serum was collected and | reaction under such condition (Figure 3A). The human serum was collected and | ||
| Line 518: | Line 517: | ||
</br> | </br> | ||
<p> | <p> | ||
| − | <b><span style="line-height:2;font-family:Perpetua;font-size:18px;">Evaluation of the sensitivity and specificity of RCA reactions initiated by serum-dissolved miRNAs by Sybr I fluorescent assay.</span></b> | + | <b><span style="line-height:2;font-family:Perpetua;font-size:18px;">Figure 3. Evaluation of the sensitivity and specificity of RCA reactions initiated by serum-dissolved miRNAs by Sybr I fluorescent assay.</span></b> |
</p> | </p> | ||
<p> | <p> | ||
| Line 621: | Line 620: | ||
<p> | <p> | ||
<span style="line-height:2;font-family:Perpetua;font-size:18px;">Similarly, | <span style="line-height:2;font-family:Perpetua;font-size:18px;">Similarly, | ||
| − | the RCA result collected from the group started with a water- | + | the RCA result collected from the group started with a water-dissolved miRNA input |
was tested as a proof of concept. The OD</span><sub><span style="line-height:2;font-family:Perpetua;font-size:18px;">450 </span></sub><span style="line-height:2;font-family:Perpetua;font-size:18px;">results showed a significant | was tested as a proof of concept. The OD</span><sub><span style="line-height:2;font-family:Perpetua;font-size:18px;">450 </span></sub><span style="line-height:2;font-family:Perpetua;font-size:18px;">results showed a significant | ||
variation among groups with different protein concentration, whereas the group | variation among groups with different protein concentration, whereas the group | ||
| Line 664: | Line 663: | ||
<p> | <p> | ||
<span style="line-height:2;font-family:Perpetua;font-size:18px;">When | <span style="line-height:2;font-family:Perpetua;font-size:18px;">When | ||
| − | working with samples collected from the group started with a serum- | + | working with samples collected from the group started with a serum-dissolved |
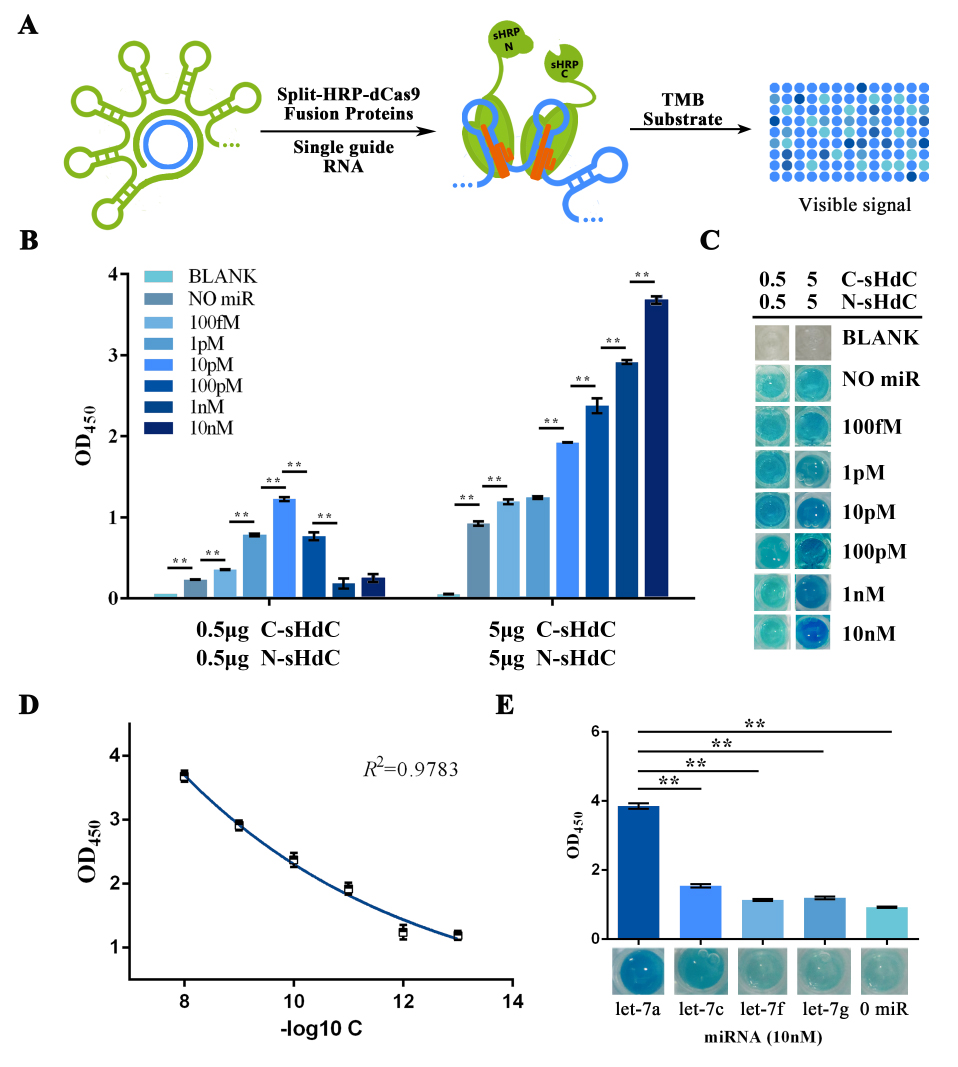
| − | miRNA input, similar trends to the water- | + | miRNA input, similar trends to the water-dissolved ones were shown on OD</span><sub><span style="line-height:2;font-family:Perpetua;font-size:18px;">450 </span></sub><span style="line-height:2;font-family:Perpetua;font-size:18px;">results and visual/imaging analyzation (Figure 7A, B). Which then, |
indicated that the visualization and further amplification of RCA outputs COULD | indicated that the visualization and further amplification of RCA outputs COULD | ||
BE ACHIEVED with a brilliant sensitivity and specificity through the single guide-RNA mediated CRISPR-Cas9 system and a | BE ACHIEVED with a brilliant sensitivity and specificity through the single guide-RNA mediated CRISPR-Cas9 system and a | ||
| Line 755: | Line 754: | ||
<b><span style="line-height:2;font-family:Perpetua;font-size:18px;"> </span></b> | <b><span style="line-height:2;font-family:Perpetua;font-size:18px;"> </span></b> | ||
</p> | </p> | ||
| + | |||
| + | |||
| + | |||
| + | |||
| + | <!--标题--> | ||
| + | <h2> | ||
| + | <span><span style="color:#7f1015">Modeling</span></span><hr /> | ||
| + | </h2> | ||
| + | |||
| + | <!--标题--> | ||
| + | <h3> | ||
| + | <span><span style="color:#7f1015">Obtaining the relationship</span></span><hr /> | ||
| + | </h3> | ||
| + | |||
| + | <!--正文--> | ||
| + | <p style="text-indent:22pt;"> | ||
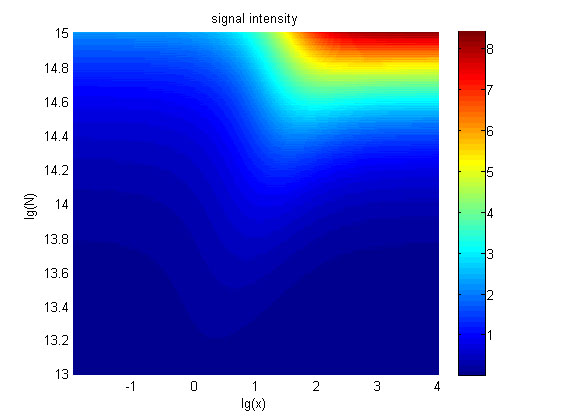
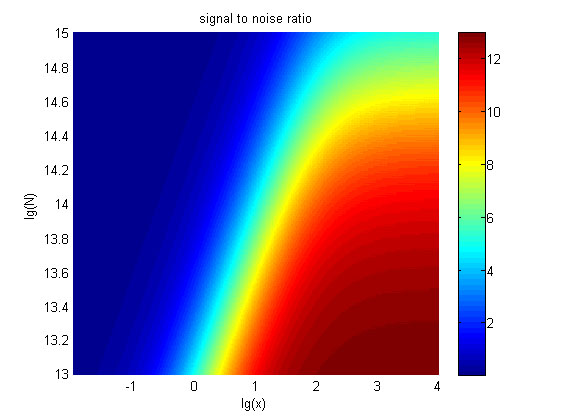
| + | <span style="line-height:2;font-family:Perpetua;font-size:18px;">The relationships between the signal to noise ratio (SNR), the signal intensity respectively and the concentration of miRNA under different additional amount of fusion proteins were discussed mainly in this model. For such matter, theoretical calculation and experimental results were well integrated and a brilliant probability model was introduced. | ||
| + | The relationships were obtained and shown below. | ||
| + | </span> | ||
| + | </p> | ||
| + | </br> | ||
| + | |||
| + | |||
| + | <!--图和图注--> | ||
| + | </br> | ||
| + | </html> | ||
| + | [[File:T--NUDT_CHINA--modelfig5.jpg|700px|center]] | ||
| + | <html> | ||
| + | </br> | ||
| + | <p> | ||
| + | <span style="line-height:2;font-family:Perpetua;font- | ||
| + | |||
| + | size:18px;"><b>Figure | ||
| + | 9. The signal intensity (OD<sub>450</sub>)</b> Three-dimensional map of signal | ||
| + | |||
| + | intensity (OD<sub>450</sub>) | ||
| + | against miRNA concentration(pM) and additional amount of fusion proteins.</span> | ||
| + | </p> | ||
| + | </br> | ||
| + | |||
| + | |||
| + | |||
| + | <!--图和图注--> | ||
| + | </br> | ||
| + | </html> | ||
| + | [[File:T--NUDT_CHINA--modelfig6.jpg|700px|center]] | ||
| + | <html> | ||
| + | </br> | ||
| + | <p> | ||
| + | <span style="line-height:2;font-family:Perpetua;font- | ||
| + | |||
| + | size:18px;"><b>Figure 10. The result of SNR</b> Three-dimensional map of signal | ||
| + | |||
| + | to noise ratio against miRNA concentration (pM) and additional amount of fusion | ||
| + | |||
| + | proteins.</span> | ||
| + | </p> | ||
| + | </br> | ||
| + | |||
| + | |||
| + | <!--标题--> | ||
| + | <h3> | ||
| + | <span><span style="color:#7f1015">Testing the model</span></span><hr /> | ||
| + | </h3> | ||
| + | |||
| + | <!--正文--> | ||
| + | <p style="text-indent:22pt;"> | ||
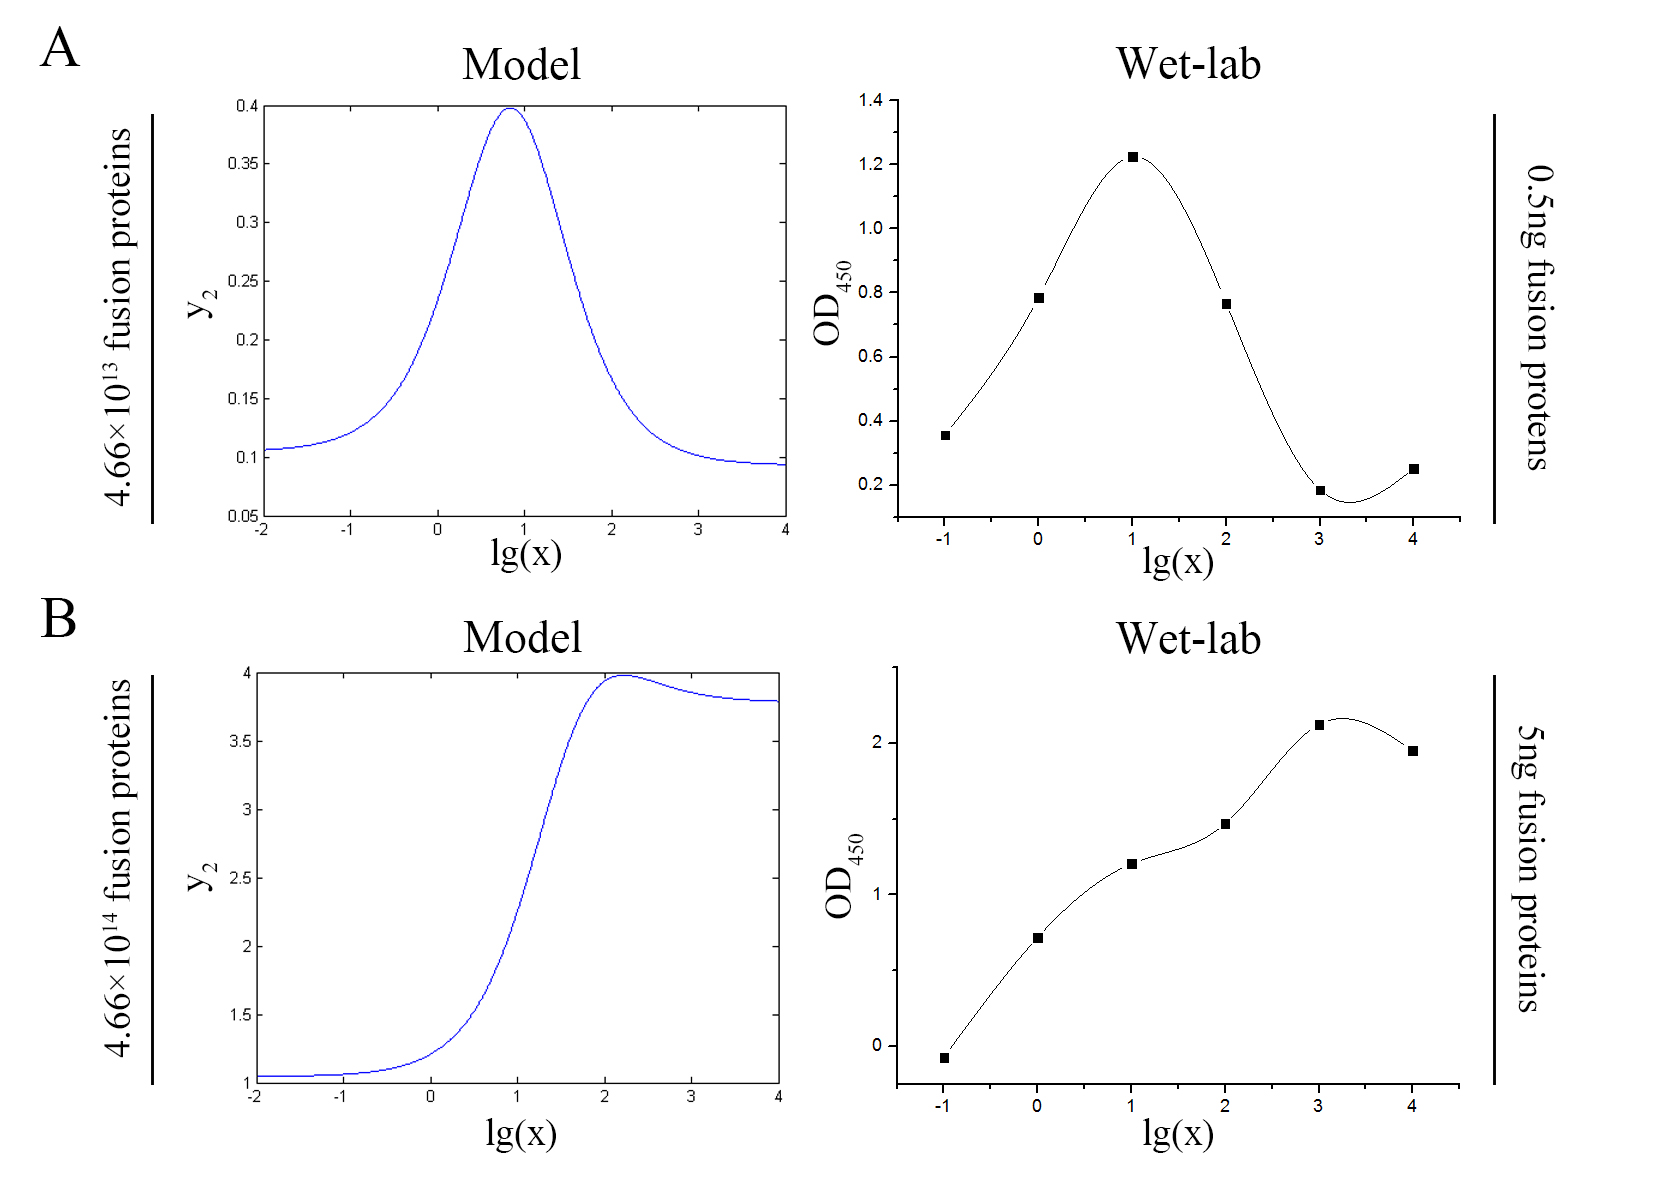
| + | <span style="line-height:2;font-family:Perpetua;font-size:18px;">The accuracy of the model was tested by comparing the curves predicted by the model with those obtained from the experiment. </span> | ||
| + | </p> | ||
| + | </br> | ||
| + | |||
| + | |||
| + | |||
| + | |||
| + | <!--图和图注--> | ||
| + | </br> | ||
| + | </html> | ||
| + | [[File:T--NUDT_CHINA--modelfig7-2.jpg|700px|center]] | ||
| + | <html> | ||
| + | </br> | ||
| + | <p> | ||
| + | <span style="line-height:2;font-family:Perpetua;font- | ||
| + | |||
| + | size:18px;"><b>Figure 11. Test of model</b> Plot of the signal intensity (OD<sub>450</sub>) against miRNA concentration (pM) predicted by the model and experimented by wet-lab. (A) The value of the molecule number of each fusion protein added to the system is set to be 4.66e+13. The mass of each fusion protein added to the system in wet-lab is 0.5 ng. (B) The value of the molecule number of each fusion protein added to the system is set to be 4.66e+14. The mass of each fusion protein added to the system in wet-lab is 5 ng.</span> | ||
| + | </p> | ||
| + | |||
| + | </br> | ||
| + | |||
| + | |||
| + | |||
| + | <!--正文--> | ||
| + | <p style="text-indent:22pt;"> | ||
| + | <span style="line-height:2;font-family:Perpetua;font-size:18px;">The general trend of curves predicted by the model were in good agreement with the experimental results.</span> | ||
| + | </p> | ||
| + | </br> | ||
| + | |||
| + | |||
| + | <!--标题--> | ||
| + | <h3> | ||
| + | <span><span style="color:#7f1015">Optimizing our wet-lab protocol</span></span><hr /> | ||
| + | </h3> | ||
| + | |||
| + | <!--正文--> | ||
| + | <p style="text-indent:22pt;"> | ||
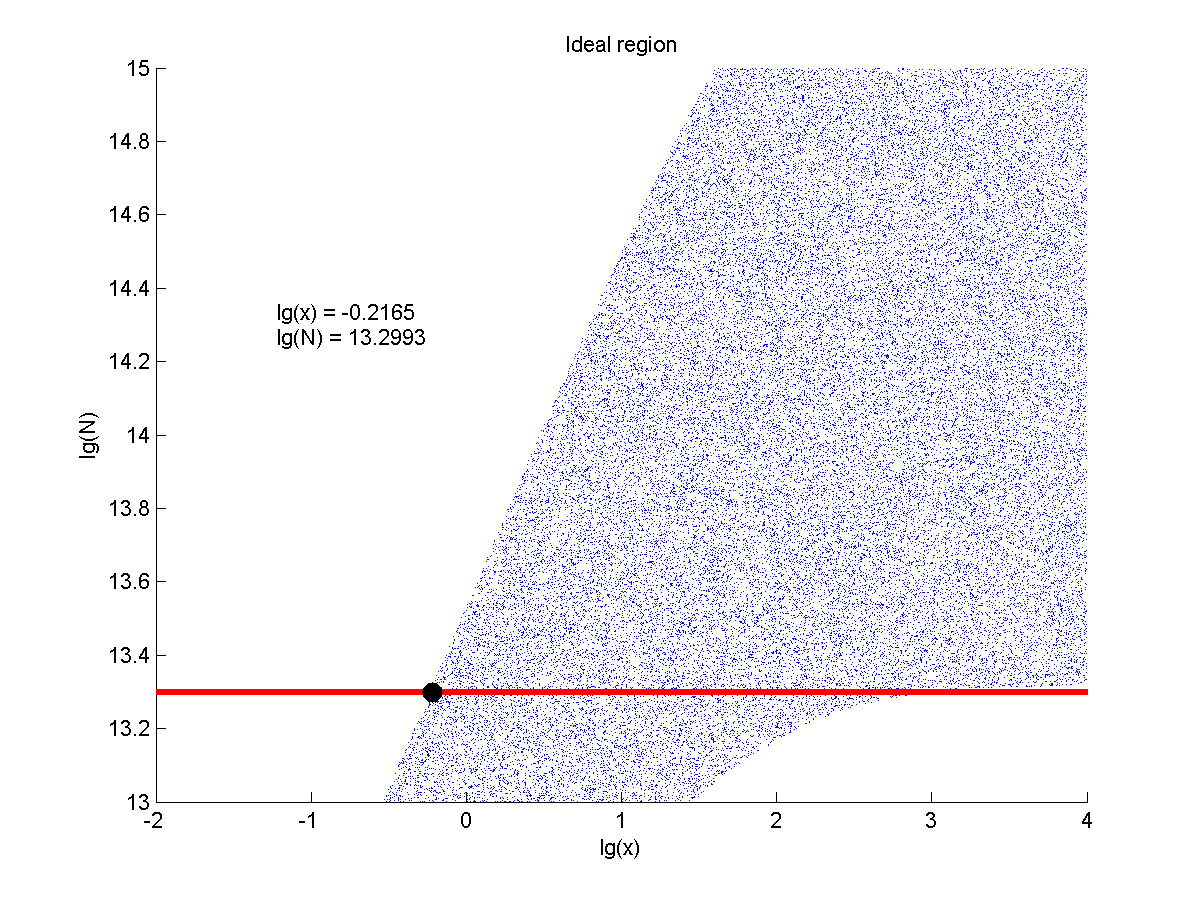
| + | <span style="line-height:2;font-family:Perpetua;font-size:18px;">The situation when the value of signal intensity and SNR were both greater than two was considered to be conducive to signal detection. Thus an ideal region was obtained through calculation.</span> | ||
| + | </p> | ||
| + | </br> | ||
| + | |||
| + | |||
| + | <!--图和图注--> | ||
| + | </br> | ||
| + | </html> | ||
| + | [[File:T--NUDT_CHINA--modelfig7.jpg|700px|center]] | ||
| + | <html> | ||
| + | </br> | ||
| + | <p> | ||
| + | <span style="line-height:2;font-family:Perpetua;font- | ||
| + | |||
| + | size:18px;"><b>Figure 8. Ideal region</b> Region of qualified logarithm of | ||
| + | |||
| + | concentrations of miRNA (pM) and logarithm of the additional amount of fusion | ||
| + | |||
| + | proteins.</span> | ||
| + | </p> | ||
| + | |||
| + | </br> | ||
| + | |||
| + | |||
| + | |||
| + | <!--正文--> | ||
| + | <p style="text-indent:22pt;"> | ||
| + | <span style="line-height:2;font-family:Perpetua;font-size:18px;">The concentration range of miRNA that can be detected is maximum when we set the value of the molecule number of the fusion proteins to be e+13.3, building on which, our wet-lab protocol could be optimized in our future work. </span> | ||
| + | </p> | ||
| + | </br> | ||
| + | |||
| + | |||
| + | |||
| + | |||
</br> | </br> | ||
<h2> | <h2> | ||
| Line 773: | Line 910: | ||
</p> | </p> | ||
| + | |||
| + | |||
| + | <h2> | ||
| + | <span><span style="color:#7f1015">Future Work</span></span><hr /> | ||
| + | </h2> | ||
| + | |||
| + | <p style="text-indent:22pt;"> | ||
| + | <span style="line-height:2;font-family:Perpetua;font-size:18px;">Since we have demonstrated the basic concept of our project. For now, most results came out to be optimistic, thus encouraged us to push our project forward in the future. Two main goals have been set for the future development of this project: to optimize the Noise-signal ratio, to enlarge the test scale, to extend its application, and to achieve a PAPER-BASED detection.</span> | ||
| + | </p> | ||
| + | </br> | ||
Latest revision as of 02:11, 20 October 2016
TOP

