Difference between revisions of "Team:Slovenia/Basic Part"
| Line 148: | Line 148: | ||
</figure> | </figure> | ||
</div> | </div> | ||
| − | + | ||
| − | + | ||
| − | + | ||
| − | + | ||
| − | + | ||
| − | + | ||
| − | + | ||
| − | + | ||
| − | + | ||
Revision as of 14:23, 18 October 2016
New Basic part
The BioBrick nominated for best part is MscS (BBa_K1965000) from our Mechanosensing Collection. This part
contains the coding sequence of the bacterial mechanosensitive channel of small conductance (MscS). It has been previously described as an important receptor involved
in bacterial sensing of mechanical stress.
We expressed and characterized it in mammalian cells, where it served as the sensor that translates the ultrasound stimulation
into calcium ion influx, thereby playing a central role our design of ultrasound responsive cells as well as cells responsive to the touch (Touchpaint).
We showed that by expressing the MscS channel, cells gained sensitivity for ultrasound stimulation in comparison to non-transfected cells ( 6 ). Influx of calcium ions was observed at a lower rate in the case of ectopically expressed TRPC1 (data not shown), probably due to its poor membrane localization.


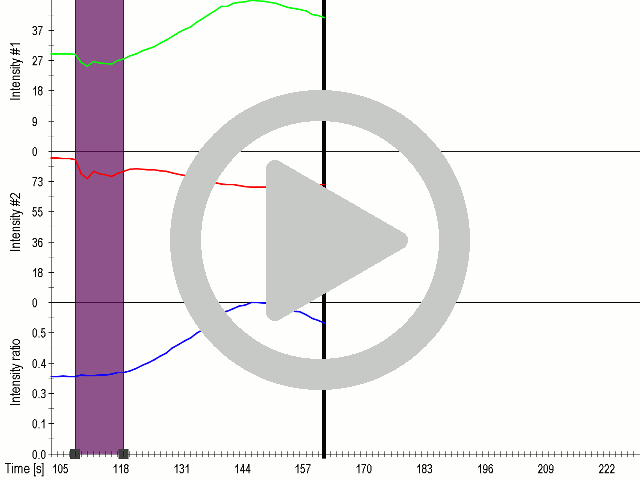


(A) Schematic representation of a stimulation sequence and (B) signal parameters used for stimulation. (C) and (D)Cells expressing MscS showed increased sensitivity to ultrasound stimulation in comparison to the cells without exogenous mechanosensitive channel. HEK293 cells expressing MscS channels or control cells transfected with vector were stimulated with ultrasound for 10 s and calcium influx was recorded in real time (D) using a confocal microscope. For comparison cells without ectopic MscS were used. Fluo-4 (D, green line) and Fura Red dyes (D, red line) were used for ratiometric calcium imaging. (D) Ratio (blue line) was calculated from fluorescence intensities of Fura Red and Fluo-4 using CaPTURE.