<p id="pp">Nagasaka and Nagashima noted that wire insulation has negligible impact on the measurement of the thermal conductivity of saline solutions (Nagasaka and Nagashima 1981) and thus can be described by the equation: $$ \lambda = \frac{Q}{4\pi\Delta T}\ \ln{(t)}$$ where $Q$ is the power per unit length of the wire, $Q = \frac{(I \times V)}{Length}$, and $\Delta T$ is the change in temperature over time $t$. A linear fit of a $T$ vs. $ln(t)$ plot following only the reading from the broth thermocouple will yield the conductivity (Fig. 2).</p>
<p id="pp">Nagasaka and Nagashima noted that wire insulation has negligible impact on the measurement of the thermal conductivity of saline solutions (Nagasaka and Nagashima 1981) and thus can be described by the equation: $$ \lambda = \frac{Q}{4\pi\Delta T}\ \ln{(t)}$$ where $Q$ is the power per unit length of the wire, $Q = \frac{(I \times V)}{Length}$, and $\Delta T$ is the change in temperature over time $t$. A linear fit of a $T$ vs. $ln(t)$ plot following only the reading from the broth thermocouple will yield the conductivity (Fig. 2).</p>
Newcastle's 2016 iGEM project looks at the creation of biological electronic components, and as part of their modelling they needed to know the thermal conductivity of different growth media. With a strong team of physicists on board the Exeter team, they came to us for help. With support from our biophysicist supervisor Ryan Edginton, we built an experimental setup (Fig. 1a) that made use of the transient hot wire method (Healy et al 1976).
A 0.65m insulated copper wire (cross-sectional area, 0.05m2) was passed through the centre of a 50mL falcon tube containing the liquid medium to be measured, suspended in a water bath (Fig. 1b). Three thermocouples (Pico Technology TC-08) were attached, one to the wire in contact with the insulation using blue tack, one suspended in the liquid medium 5mm from the wire, and one in the water bath. Power was supplied to the wire at 5A, 1.8V for 600s, generating a small temperature increase of approximately 2°C above room temperature (23 ± 1°C) to avoid convection effects. Our experimental setup was calibrated to the thermal conductivity of water at 20°C, 598.4 $\frac{mW}{Km}\text{ }$. Measurements of two growth media, liquid broth (LB) and M9 were repeated at least in quintuple.
Fig. 1 - A picture of the experimental apparatus used for finding conductivitys.
Fig. 2 - A close up of the experiment showing the wiring inside the falcon tube.
Nagasaka and Nagashima noted that wire insulation has negligible impact on the measurement of the thermal conductivity of saline solutions (Nagasaka and Nagashima 1981) and thus can be described by the equation: $$ \lambda = \frac{Q}{4\pi\Delta T}\ \ln{(t)}$$ where $Q$ is the power per unit length of the wire, $Q = \frac{(I \times V)}{Length}$, and $\Delta T$ is the change in temperature over time $t$. A linear fit of a $T$ vs. $ln(t)$ plot following only the reading from the broth thermocouple will yield the conductivity (Fig. 2).
We found the thermal conductivity of LB and M9 to be similar to that of water, at 605 $\pm$ 20 $\frac{mW}{Km}\text{ }$ and 570 $\pm$ 30 $\frac{mW}{Km}\text{ }$ respectively.
References
Healy, J.J, de Groot, J.J and Kestin, J, The Theory of the Transient Hot-Wire Method for Measuring Thermal Conductivity,Physica82C: 392-408 (1976)
Nagasaka Y, Nagashima A. Absolute measurement of the thermal conductivity of electrically conducting liquids by the transient hot-wire method. Journal of Physics E: Scientific Instruments. 1981 Dec;14(12):1435–40.
Software: Purdue
The Purdue team, for part of their human practices, aimed to create a user friendly database of past iGEM projects, making it easier for future iGEM teams to search through relevant projects and develop their own ideas. Through a series of Skype calls, we were able to set up a collaboration between our two teams. We would be writing summaries for Purdue’s database, and in return, Purdue would run a continuous culture of a kill switch and send us the resulting data.
Our team helped Purdue with this by logging data for the 46 iGEM projects, and critiquing ease of use and effectiveness of the database. Purdue told us we were instrumental in getting up the 2015 section of their database due to our contributions to writing up the project summaries.
For each team we produced a description of what their project was about (including anything that was particularly notable about the project), the project track, the number of team members, the chassis used (if relevant), any research benchmarks, a list of submitted parts with part numbers, descriptions and links, the medal achieved, and any awards and nominations. Each project was tagged with all relevant keywords, in line with Purdue’s aim of creating a user-friendly, searchable database.
Purdue conducted a continuous culture of a kill switch that the 2015 Purdue team created but never submitted, and sent us the results of their experiment to give us a broader view of the reliability of kill switches, beyond our current scope of Killer Red and Killer Orange.
They followed a continuous culture protocol written by Dan, in which they took the OD of the continuous culture every morning and evening, adding a new flask to return the OD to 0.05 each time to continue the culture. For each day of week 1, and every other day for the weeks following that, they would prepare a glycerol stock of a sample of the culture, then test it in an appropriate way for their kill switch to test if it was still functional, and to what degree it was still functioning. Purdue said once they had substituted out LB broth for yeast YPD media, the protocol was straightforward and easy to follow.
Parts:Glasgow
We collaborated with Glasgow iGEM 2016 to test the efficiency of the T7 Promoter we were using to construct the KillerRed, KillerOrange and Lysozyme kill switches. We new that it was leaky and we speculated that it was reducing the efficiency of our project but we needed proof that the leakiness of the promoter could affect our project. In return they gave us a DH5α.Z1 strain in the hopes it would improve the efficiency of our promoter. After subsequent testing we were unable to express our KillerRed and KillerOrange proteins in this strain. This is the report they sent us for the test of the T7 promoter:
Exeter and Glasgow iGEM 2016 Collaboration:
KillerRed and KillerOrange Promoter Efficiency Experiment
Methods
First, we transformed the plasmids for testing promoter efficiency into the E. coli strain DH5α.Z1:
J04450 (RFP with a lac-repressible promoter) in pSB1C3
lac-repressible promoter + KillerRed in pSB1C3
lac-repressible promoter + KillerOrange in pSB1C3
Next, we set up 5ml LB broth overnight cultures in boiling tubes with loose caps at 37°C shaking at 225rpm of:
DH5α, no plasmid
DH5α, J04450-pSB1C3
DH5α, KillerRed-pSB1C3
DH5α, KillerOrange-pSB1C3
DH5α.Z1, no plasmid
DH5α.Z1, J04450-pSB1C3
DH5α.Z1, KillerRed-pSB1C3
DH5α.Z1, KillerOrange-pSB1C3
We set up each of these both with 1mM IPTG and without, so 16 overnights in total, with 25μg/ml chloramphenicol for the strains with plasmids.
The next day, we spun down 500μl of each overnight in 1.5ml eppendorfs, resuspended in 1ml PBS buffer (PBS gives less background fluorescence than LB broth), and transferred to cuvettes for OD600 measurements. For the fluorescence measurements, we used a Typhoon FLA 9500 with the samples in a 96-well plate. Each of the 16 samples were pipetted into 3 wells with 300μl each. The settings on the Typhoon were: 1) excitation laser at 532nm and emission filter above 575nm (so would detect any wavelength above 575nm) and 2) excitation laser at 473nm and emission filter above 575nm. Both were across the whole 96-well plate, but the second lower excitation wavelength was included in case the first was too high to excite KillerOrange.
Results
For each of the wells, a fluorescence value in arbitrary units (au) was calculated using ImageQuant software, where we set the 3 wells of PBS only blanks as 0% fluorescence, and the well with the highest value as 100% to convert au into percentage. Next, we normalised for any natural fluorescence in the cells by subtracting the average of the “cells only” wells (DH5α, and Dh5α.Z1, both with and without IPTG) from all wells, and then corrected for the difference in OD600 values between samples by dividing the normalised fluorescence measurements by the OD600 values. The table below shows the average across the 3 wells of each of the 16 samples.
Strain + Plasmid
No IPTG
1mM IPTG
DH5α
0.016009
-0.00115
DH5α J04450
99.84583
90.32377
DH5α KillerRed
0.003236
-0.00109
DH5α KillerOrange
-0.02212
-0.02343
DH5α.Z1
-0.02934
0.015912
DH5α.Z1 J04450
14.20878
80.45877
DH5α.Z1 KillerRed
-0.03287
-0.00517
DH5α.Z1 KillerOrange
-0.01994
-0.02095
Graph of these averages. The error bars are standard deviation but are very small because the 3 replicates for each sample are technical replicates, so do not show the variation that would be seen with biological replicates (3 different colonies for each of the 16 samples).
Fluorescence scan image from the Typhoon with labels for which samples are in each well.
These data indicate that there is no difference in fluorescence between either KillerRed or KillerOrange and the cells only control either with or without induction with IPTG. There could be several reasons for this, including the light was not intense enough to excite the fluorescent proteins, however no fluorescence from this type of the test with a laser for excitation would be unlikely. It is also possible that no protein is being produced, which could be due to insufficient IPTG. However, the RFP in J04450 under the control of the lac-repressible promoter R0010 clearly shows that in the DH5α.Z1 strain, there is less fluorescence without IPTG, than with IPTG. This is not a perfect control for the concentration of IPTG used unless KillerRed and KillerOrange also have the R0010 promoter. Interestingly, in the DH5α strain, there is no significant difference between RFP fluorescence with or without IPTG – this is due to DH5α not having a functional copy of LacI, the lac repressor, therefore lac-repressible promoters are not “OFF”, so cannot be switched “ON” by IPTG induction.
Sequencing
Another reason there may not be any KillerRed or KillerOrange protein produced, is mutations in the promoter. This was something we encountered when attempting to clone a promoter in front of the toxin from the toxin-antitoxin system we were working with. If a protein is toxic to produce, any cell which is producing less or no protein will grow faster than a cell which is producing the toxic protein. This means a mutated, non-functional promoter will have a proliferative advantage during transformation. So, as we were sending our BioBricks for registry for submission, we decided to sequence the minipreps of KillerRed and KillerOrange as well with the registry standard pSB1C3 sequencing primer VF2, to check for any mutations. The results are shown below in screenshots of a plasmid editor software called ApE.
Both plasmids had the BioBrick prefix, and the correct sequence for both KillerRed and KillerOrange open reading frame, according to the papers cited on the Exeter 2016 iGEM wiki. The sequence between the prefix and the ATG start codon, we checked against lac-repressible promoters in the iGEM registry. We found a match to R0184, which is a T7 lac-repressible promoter. T7 promoters require T7 polymerase to be transcribed, as they are not recognised by E. coli polymerases. This results confirms the result of the fluorescence measurements. No KillerRed or KillerOrange protein was observed by fluorescence, as neither gene was being transcribed by either DH5α or DH5α.Z1 as neither strain produces the required T7 polymerase. A protein overexpression E. coli strain such as BL21 which has the T7 polymerase gene inserted into its genome is designed to use T7 promoters would have been able to express these KillerRed and KillerOrange constructs.
Glasgow iGEM did fantastic work for us, providing us with detailed analysis of the T7 promoter and suggestions for improving the efficiency of our project. Whilst their data on the DH5alpha Z1 strain is accurate and in accordance with subsequent research and advice, we have since noted there is expression of KillerRed and KillerOrange in DH5alpha in lab tests.
We are proud and grateful in saying that we have helped and been helped by various other teams in this years iGEM competition. Utilising other teams equipment and different ways of thinking towards solving problems has provided us all with some great data and innovative solutions to some problems we have encountered. We are confident that what we have achieved will benefit the iGEM competition as a whole.
Good inter-team communication is a vital factor in all disciplines and at the core of the iGEM spirit. We hope to have contributed to this in several ways.
Theory: Edinburgh
Optimising methods of data mutation detection in BabbleBlocks
Storing information on DNA offers many advantages over current methods, however mutations
need to be carefully monitored to ensure incorrect data is not read as a false positive.
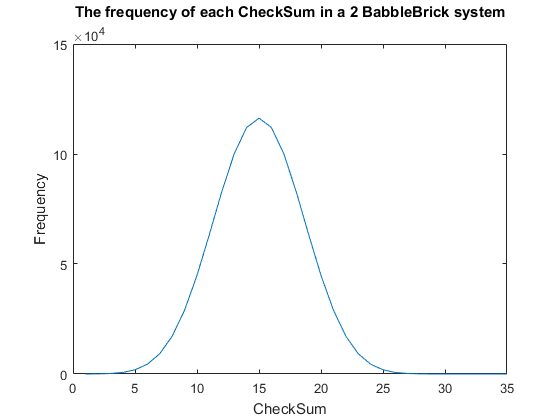
Currently for information stored on a BabbleBrick a ‘CheckSum’ is calculated by taking the
sum of the values on each base of DNA. If the checksum of a BabbleBlock has changed between
the time of writing and reading, the data is considered to be corrupt.
$C = \sum^{bp}_{n=1} bp_n$
$C$: Frequency of checksum
$n$: The integer address of base pair
$bp$: Amount of base pairs (5 times the number of BabbleBricks)
$bp_n$: The value of the $n^{th}$ base pair
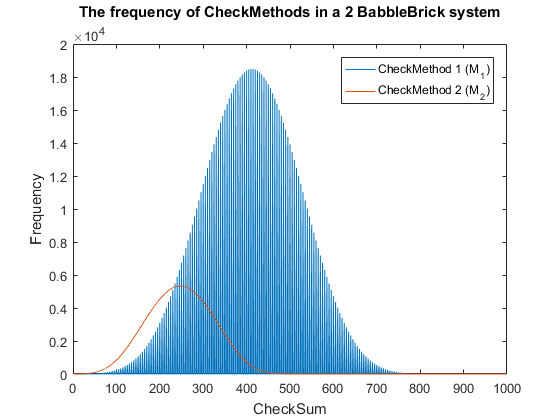
Fig. 1. The frequency of all checksums in a babbleBlock system containing two BabbleBricks.
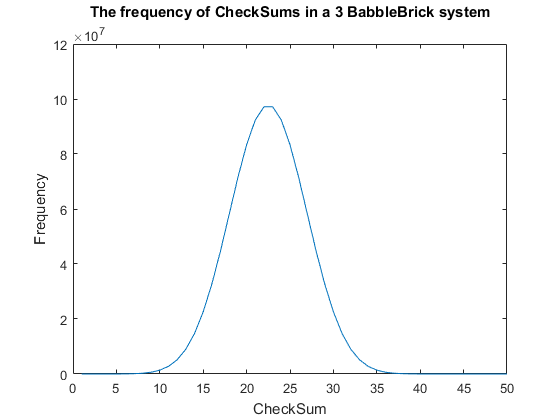
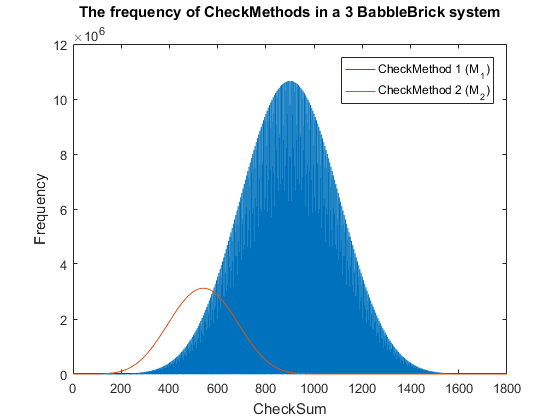
Fig. 2. The frequency of all checksums in a babbleBlock system containing three BabbleBricks.
Currently a checksum utilizes only a small percentage of the values that can be stored.
A BabbleBrick contains 5 base 4 digits meaning that 4$^{\text{5}B}$ unique bits of
information share one of 15$B$ checksums where $B$ is the amount of BabbleBricks in one
BabbleBlock. This data has been plotted for BabbleBlocks containing 2 and 3 BabbleBricks
in Fig.1 and Fig.2 respectively. Assuming that between the time of writing and reading
any number of mutations can occur, the maximum probability of a mutation event resulting
in the same checksum can be calculated by comparing the frequency of one checksum to the
total frequency of unique bits of information.
$P_C = \big(\frac{C_{max}}{F}) \approx \big(\frac{1.2 \times 10^5}{4^{10}}) = 11$% in a 2 BabbleBrick system $\:\:\:\:\:\:\:\:\:\:\:\:\:\:\:\:\:\:\:\:\:\:\:\:\:\:\:\:\:\:\approx \big(\frac{10^8}{4^{15}}) = 9$% in a 3 BabbleBrick system
$P_C$: Maximum probability of the same checksum occuring after any number of mutations
$C_{max}$: Frequency of most common checksum
$F$: Frequency of possible unique bits of information
Therefore, it can be predicted that for an average sentence containing 9 words the maximum
probability of the same checksum occurring will be of the magnitude of 1%. The probability
should decrease marginally when adding BabbleBricks due to the slightly increased range of
checksums that become available. This value can be optimized by altering the method of the
checksum to utilize a greater range of values and to spread out the frequency more evenly as
to reduce the maximum probability of the same checksum occurring.
Currently one BabbleBlock has 4 BabbleBricks dedicated to storing the checksum, giving a maximum
10$^4$ possible values. The first step in determining a ‘CheckMethod’ is to ensure that all checksums
for a suitable amount of BabbleBricks can be stored without going over 10$^4$. It is also important
to not use operators that will result in negative numbers or decimals, therefore limiting the
possible checksum values to integers up to but not including 10$^4$, this rules out operators such
as subtract and divide. For this example, a suitable number of words in a sentence and therefore
BabbleBricks in a BabbleBlock shall be 20. All simulations will be carried out on 3 BabbleBrick
systems due to computing limitations.
Checksums are non-directional, for example a BabbleBrick of bases [2,2,2,2,2] would have the
same checksum as [2,1,3,2,2]. To alter this a checkmethod will incorporate the position
of the base in to the calculation. At each point the digit is multiplied by its position
in the BabbleBlock, where the first BabbleBrick has digit positions 1 to 5 and the last
BabbleBrick (20$^{th}$) has positions 96 to 100. A scaler $\alpha$ has been included to
increase the range of results. To ensure multiplications don’t result in a null result
the value of each base had a value of 1 added to it. The first checkemethod of one
BabbleBlock can be defined as:
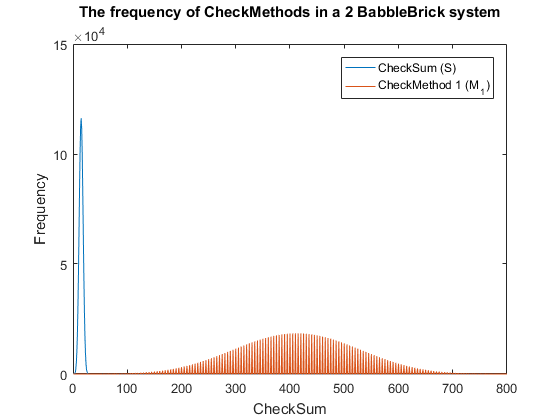
$M_1 = \sum_{n=1}^{bp}(bp_n + 1) . \alpha . bp$
$M_1$: Frequency of CheckMethod 1
$\alpha$: Scaler ($\alpha = 5$ in this example)
Fig. 3. The frequency of checkmethod 1 for all possible bits of information in a babbleBlock system containing two BabbleBricks.
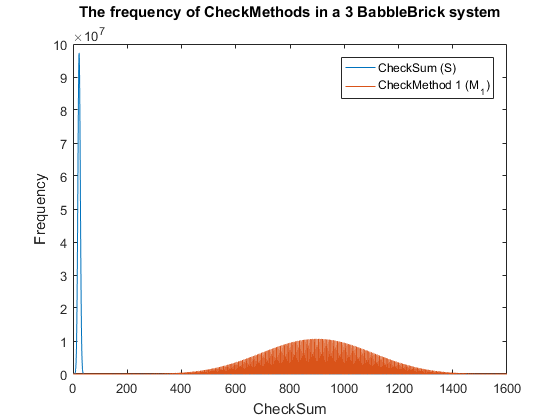
Fig. 4. The frequency of checkmethod 1 for all possible bits of information in a babbleBlock system containing three BabbleBricks.
This method results in Fig.3 and Fig.4 for a 2 and 3 BabbleBlock system respectively,
which shows a large improvement over the original checksum method. The maximum frequency
of a single checksum has been significantly decreased whichwill lower the probability of
a flase positive occuring; this is largely due to the large range of results available to
the method. However, there is still room for improvement as the shaded area of the graph
indicates that on a smaller scale the frequency of checkmethod 1 varies between high and low
values. Eliminating this fluctuation would allow for the data to be spread out more evenly.
To improve this
method a second layer of multiplication will be implamented, each digit will
now be multiplied by a constant depending on its relative position in the BabbleBrick.
$M_2 = \sum_{p=1}^B \sum_{q=1}^{5}(bp_{(5B_p + q)} + 1) . q . bp$ Or using the remainder modulo '%' $M_2 = \sum_{n=1}^{bp} (bp_n + 1) . ((bp \text{ % } 5) + 1) . bp$
$M_2$: Frequency of CheckMethod 2
$B$: Number of BabbleBricks in the BabbleBlock
$p$: Local integer address of BabbleBrick
$q$: Local integer address of base pair in BabbleBrick
$B_p$: The $p^{th}$ Babblebrick in the BabbleBlock
Fig. 5. The frequency of checkmethod 2 for all possible bits of information in a babbleBlock system containing two BabbleBricks.
Fig. 6. The frequency of checkmethod 2 for all possible bits of information in a babbleBlock system containing three BabbleBricks.
$P_{M_2} = \big(\frac{M_{2\:max}}{F}) \approx \big(\frac{6 \times 10^3}{4^{10}}) = 0.6$% in a 2 BabbleBrick system ($11$% for checksum) $\:\:\:\:\:\:\:\:\:\:\:\:\:\:\:\:\:\:\:\:\:\:\:\:\:\:\:\:\:\approx \big(\frac{3 \times 10^6}{4^{15}}) = 0.3$% in a 3 BabbleBrick system ($9$% for checksum)
$P_{M_2}$: Maximum probability of the same checkmethod 2 value occuring after any number of mutations
$M_{2\:max}$: Frequency of most common checkmethod 2 value
$F$: Frequency of possible unique bits of information
This has been plotted for a 2 and 3 BabbleBlock system in Fig.5 and Fig.6 respectively.
When comparing checksum to checkcethod 2 the frequency peak is approximately 20 to 30
times smaller in both cases whilst utilizing more values. In Fig.5 and Fig.6 the largest
improvement using the second iteration of the checkmethod is the utilization of every
integer value, checkmethod 1 appears shaded as the frequency varies frequently. The last
step is to test checkmethod 2 when used in a babbleBlock containing 20 BabbleBricks; the
largest value possible assuming a BabbleBlock containing the value ‘3’ in each digit will
grant a value of 60600 which falls out of the current limit of 10$^4$ values. Therefore,
it is recommended that one more BabbleBrick is added to the end of the BabbleBlock in order
to store 10$^5$ values.
To improve this method further more complex multiplications could be added, it would be
a decision based on optimising efficiency of calculations and minimising false positives.
In a 2 and 3 BabbleBrick system the probability of a false positives occurring was reduced by
approximately 20 and 30 times respectively, although the numbers are too large to compute,
this new method has the possibility of lowering the maximum false positive error of the previously
used checksum by one or more orders of magnitude.
If continued further, research should also be done in to the reconstruction of data after it has been lost.