(Created page with "<html lang="en"> <head> <meta content="text/html; charset=utf-8" http-equiv="Content-Type"/> <meta charset="utf-8"/> <meta content="IE=edge" http-equiv="X-UA-Compatible...") |
|||
| (16 intermediate revisions by 4 users not shown) | |||
| Line 29: | Line 29: | ||
<div style="height:100%"> | <div style="height:100%"> | ||
<section class="sciencephoto parallax" style="text-align: center"> | <section class="sciencephoto parallax" style="text-align: center"> | ||
| − | <h2 class="title"> | + | <h2 class="title" style="padding-top: 0;"> |
Laboratory | Laboratory | ||
</h2> | </h2> | ||
| Line 88: | Line 88: | ||
<li style="float:left; font-family: bebas_neuebold;"> | <li style="float:left; font-family: bebas_neuebold;"> | ||
<b> | <b> | ||
| − | <a href="index | + | <a href="index" style="margin-left: 10px; font-size:22px; position:absolute;"> |
AALTO-HELSINKI 2016 | AALTO-HELSINKI 2016 | ||
</a> | </a> | ||
| Line 107: | Line 107: | ||
<div class="container" style="width: 75%; font-family: robotolight; color: #4d4d33"> | <div class="container" style="width: 75%; font-family: robotolight; color: #4d4d33"> | ||
<br/> | <br/> | ||
| − | |||
| − | |||
| − | |||
<br/> | <br/> | ||
| − | |||
| − | |||
| − | |||
| − | |||
| − | |||
| − | |||
| − | |||
| − | |||
| − | |||
| − | |||
| − | |||
| − | |||
| − | |||
| − | |||
<br/> | <br/> | ||
<br/> | <br/> | ||
| − | |||
| − | |||
| − | |||
| − | |||
<br/> | <br/> | ||
| − | <h1 id=" | + | <h1 id="ONE"> |
Assays | Assays | ||
</h1> | </h1> | ||
| − | |||
<h2> | <h2> | ||
Fluorescence assays | Fluorescence assays | ||
| Line 149: | Line 127: | ||
<br/> | <br/> | ||
<p class="justify" style="font-size:19px;"> | <p class="justify" style="font-size:19px;"> | ||
| − | For measuring fluorescence, we decided to use a microplate reader (Cytation3, BioTek) in order to be able to easily monitor the development of the fluorescence. In our microplate reader experiments, liquid cultures of yeast cells containing the stress promoter plasmids were induced with different concentrations of hydrogen peroxide on a 96-well plate. The plate | + | For measuring fluorescence, we decided to use a microplate reader (Cytation3, BioTek) in order to be able to easily monitor the development of the fluorescence. In our microplate reader experiments, liquid cultures of yeast cells containing the stress promoter plasmids were induced with different concentrations of hydrogen peroxide on a 96-well plate. The plate was sealed with an optically clear cover, and incubated in the microplate reader at +30 °C with vertical shaking. Yeast has a tendency to clump when grown in microtiter plates, but vigorous vertical shaking is suitable for limiting this. OD600 and fluorescence values can then be measured throughout the growth of the cultures at defined intervals to observe the development of fluorescence and obtain an expression profile for the newly constructed stress promoters. |
</p> | </p> | ||
<br/> | <br/> | ||
| Line 157: | Line 135: | ||
<br/> | <br/> | ||
<p class="justify" style="font-size:19px;"> | <p class="justify" style="font-size:19px;"> | ||
| − | From the plate reader results, multiple different curves could be drawn. Plots of OD600 and fluorescence as functions of time are straightforward to draw, but as hydrogen peroxide slows the cell growth significantly, comparisons of fluorescence values at any given time point would not be informative in telling about the amount of fluorescence produced by the cells. A more representative graph would thus be one where fluorescence is presented as the function of cell density (OD600); this way, fluorescence signals given by cell populations of equal density can be compared. All the sample values can then be compared to an uninduced control and to a positive control (Venus under GDP1 promoter). As our sensor is based on detecting differences | + | From the plate reader results, multiple different curves could be drawn. Plots of OD600 and fluorescence as functions of time are straightforward to draw, but as hydrogen peroxide slows the cell growth significantly, comparisons of fluorescence values at any given time point would not be informative in telling about the amount of fluorescence produced by the cells. A more representative graph would thus be one where fluorescence is presented as the function of cell density (OD600); this way, fluorescence signals given by cell populations of equal density can be compared. All the sample values can then be compared to an uninduced control and to a positive control (Venus under GDP1 promoter). As our sensor is based on detecting differences in fluorescence between induced and uninduced conditions, we can use Venus under GPD promoter dually also as a negative control; with this negative control, we see whether H |
<sub> | <sub> | ||
2 | 2 | ||
| Line 169: | Line 147: | ||
<br/> | <br/> | ||
<p class="justify" style="font-size:19px;"> | <p class="justify" style="font-size:19px;"> | ||
| − | As a second method for measuring fluorescence, we used a flow cytometer (FACSaria III, BDBiosciences). In flow cytometry, the fluorescence can be measured from individual cells in a cell suspension. The fluorescent signal of thousands of cells can be rapidly measured to produce information on the mean or median fluorescence values and distribution of fluorescence. This means that the development of the fluorescence as a function of time can’t be assessed as easily, as samples of each measured time point have to be prepared separately. However, more precise values are obtained, with less bias from background. To analyze fluorescence, induction is performed by adding hydrogen peroxide to a cell culture to the desired concentration, and incubating the cell cultures at +30 °C with shaking | + | As a second method for measuring fluorescence, we used a flow cytometer (FACSaria III, BDBiosciences). In flow cytometry, the fluorescence can be measured from individual cells in a cell suspension. The fluorescent signal of thousands of cells can be rapidly measured to produce information on the mean or median fluorescence values and distribution of fluorescence. This means that the development of the fluorescence as a function of time can’t be assessed as easily, as samples of each measured time point have to be prepared separately. However, more precise values are obtained, with less bias from background. To analyze fluorescence, induction is performed by adding hydrogen peroxide to a cell culture to the desired concentration, and incubating the cell cultures at +30 °C with shaking. A sample of cells can then be collected from the cell culture, and diluted to a an appropriate cell density in PBS for analysis with the flow cytometer. |
</p> | </p> | ||
<br/> | <br/> | ||
| Line 204: | Line 182: | ||
Our plan was to use a simple visual catalase assay for this functionality verification (Iwase et al., 2013). In preparation for this assay, yeast cells are incubated with microcystin. After the incubation, to perform the catalase assay on the cells, hydrogen peroxide and the detergent Triton X-100 are added. As catalase breaks down hydrogen peroxide to water and oxygen, bubbles are formed in the samples; Triton X functions as a surfactant, enhancing the formation and stability of a foam layer. The quantity of formed foam is relative to catalase activity in the cells, so by comparing the thicknesses of the foam layers, catalase activities can be compared. | Our plan was to use a simple visual catalase assay for this functionality verification (Iwase et al., 2013). In preparation for this assay, yeast cells are incubated with microcystin. After the incubation, to perform the catalase assay on the cells, hydrogen peroxide and the detergent Triton X-100 are added. As catalase breaks down hydrogen peroxide to water and oxygen, bubbles are formed in the samples; Triton X functions as a surfactant, enhancing the formation and stability of a foam layer. The quantity of formed foam is relative to catalase activity in the cells, so by comparing the thicknesses of the foam layers, catalase activities can be compared. | ||
</p> | </p> | ||
| − | < | + | <p class="justify" style="font-size:19px;"> |
We have three hypotheses for the results of our assay. | We have three hypotheses for the results of our assay. | ||
<br/> | <br/> | ||
<br/> | <br/> | ||
| + | </p> | ||
| + | <ul class="justify" style="font-size:19px;"> | ||
<li> | <li> | ||
VL3 and SS328-leu with the QDR2 from VL3, having the MC-transporter for microcystin would have highest catalase activities in the presence of microcystin. | VL3 and SS328-leu with the QDR2 from VL3, having the MC-transporter for microcystin would have highest catalase activities in the presence of microcystin. | ||
| Line 315: | Line 295: | ||
</p> | </p> | ||
<br/> | <br/> | ||
| − | + | </div> | |
| − | + | ||
| − | + | ||
| − | + | ||
| − | + | ||
| − | + | ||
| − | + | ||
| − | + | ||
| − | + | ||
| − | + | ||
| − | + | ||
| − | + | ||
| − | + | ||
<div class="sectionjee" style="background-color: #8a4b29"> | <div class="sectionjee" style="background-color: #8a4b29"> | ||
| − | <h2 style=" | + | <h2 style="font-family: im_fell_french_canon_proIt; font-size: 20px;"> |
“ | “ | ||
<i style="font-family: robotolight; font-size: 19px;"> | <i style="font-family: robotolight; font-size: 19px;"> | ||
| − | + | Our sensor is based on detecting differences in fluorescence | |
</i> | </i> | ||
” | ” | ||
| Line 342: | Line 310: | ||
<br/> | <br/> | ||
<div class="container" style="width: 75%; font-family: robotolight; color: #4d4d33"> | <div class="container" style="width: 75%; font-family: robotolight; color: #4d4d33"> | ||
| − | + | <h1 id="TWO"> | |
| − | <h1 id=" | + | Results - Detection |
| − | Results | + | |
</h1> | </h1> | ||
<br/> | <br/> | ||
| − | < | + | <br/> |
| − | + | <figure style="text-align: center"> | |
| − | </ | + | <img src="/wiki/images/e/e1/T--Aalto-Helsinki--kaava1.png" style="width:50%; height: 90%;"/> |
| + | </figure> | ||
| + | <br/> | ||
<br/> | <br/> | ||
<h3> | <h3> | ||
| Line 450: | Line 419: | ||
<figure style="text-align: center"> | <figure style="text-align: center"> | ||
<img src="/wiki/images/9/9b/T--Aalto-Helsinki--results2.png" style="width:100%; height: 100%;"/> | <img src="/wiki/images/9/9b/T--Aalto-Helsinki--results2.png" style="width:100%; height: 100%;"/> | ||
| − | <figcaption style="text-align: | + | <figcaption style="text-align: center"> |
Figure 6. Effect of different H | Figure 6. Effect of different H | ||
<sub> | <sub> | ||
| Line 465: | Line 434: | ||
<br/> | <br/> | ||
<p class="justify" style="font-size:19px;"> | <p class="justify" style="font-size:19px;"> | ||
| − | Attempts were made to produce a second negative control by performing measurements with the basic yeast strain without plasmid. However, for some reason the growth of this strain was extremely poor when grown on the same medium where stress promoter constructs were cultured (SD-medium; for plasmid-free strain, leucine was supplemented to the medium, as leucine auxotrophy was used for plasmid selection). As e.g. YPD medium is unsuitable for direct cell culture fluorescence measurements, we didn’t obtain this additional control. A better alternative would have been having an empty, non-YFP producing plasmid in the negative control, but we decided to make do with our existing controls. | + | Attempts were made to produce a second negative control by performing measurements with the basic yeast strain without plasmid. However, for some reason the growth of this strain was extremely poor when grown on the same medium where stress promoter constructs were cultured (SD-medium; for plasmid-free strain, leucine was supplemented to the medium, as leucine auxotrophy was used for plasmid selection). As e.g. YPD medium is unsuitable for direct cell culture fluorescence measurements, we didn’t obtain this additional control. A better alternative would have been having an empty, non-YFP producing plasmid in the negative control, but we decided to make do with our existing controls due to time constaints. |
</p> | </p> | ||
<br/> | <br/> | ||
| Line 475: | Line 444: | ||
<figure style="text-align: center"> | <figure style="text-align: center"> | ||
<img src="/wiki/images/5/5d/T--Aalto-Helsinki--results3.png" style="width:100%; height: 100%;"/> | <img src="/wiki/images/5/5d/T--Aalto-Helsinki--results3.png" style="width:100%; height: 100%;"/> | ||
| − | <figcaption style="text-align: | + | <figcaption style="text-align: center"> |
Figure 7. Effect of different H | Figure 7. Effect of different H | ||
<sub> | <sub> | ||
| Line 504: | Line 473: | ||
<figure style="text-align: center"> | <figure style="text-align: center"> | ||
<img src="/wiki/images/6/6a/T--Aalto-Helsinki--results4.png" style="width:50%; height: 50%;"/> | <img src="/wiki/images/6/6a/T--Aalto-Helsinki--results4.png" style="width:50%; height: 50%;"/> | ||
| − | <figcaption style="text-align: | + | <figcaption style="text-align: center"> |
Figure 8. Fluorescence produced under TSA1 promoter in different H | Figure 8. Fluorescence produced under TSA1 promoter in different H | ||
<sub> | <sub> | ||
| Line 584: | Line 553: | ||
<figure style="text-align: center"> | <figure style="text-align: center"> | ||
<img src="/wiki/images/d/d5/T--Aalto-Helsinki--results7.png" style="width:100%; height: 100%;"/> | <img src="/wiki/images/d/d5/T--Aalto-Helsinki--results7.png" style="width:100%; height: 100%;"/> | ||
| − | <figcaption style="text-align: | + | <figcaption style="text-align: center"> |
Figure 10. Effect of different H | Figure 10. Effect of different H | ||
<sub> | <sub> | ||
| Line 605: | Line 574: | ||
<figure style="text-align: center"> | <figure style="text-align: center"> | ||
<img src="/wiki/images/d/d5/T--Aalto-Helsinki--results8.png" style="width:100%; height: 100%;"/> | <img src="/wiki/images/d/d5/T--Aalto-Helsinki--results8.png" style="width:100%; height: 100%;"/> | ||
| − | <figcaption style="text-align: | + | <figcaption style="text-align: center"> |
Figure 11. Effect of different H | Figure 11. Effect of different H | ||
<sub> | <sub> | ||
| Line 626: | Line 595: | ||
<figure style="text-align: center"> | <figure style="text-align: center"> | ||
<img src="/wiki/images/d/d7/T--Aalto-Helsinki--results9.png" style="width:100%; height: 100%;"/> | <img src="/wiki/images/d/d7/T--Aalto-Helsinki--results9.png" style="width:100%; height: 100%;"/> | ||
| − | <figcaption style="text-align: | + | <figcaption style="text-align: center"> |
Figure 12. Effect of 0 mM H | Figure 12. Effect of 0 mM H | ||
<sub> | <sub> | ||
| Line 677: | Line 646: | ||
<figure style="text-align: center"> | <figure style="text-align: center"> | ||
<img src="/wiki/images/9/9b/T--Aalto-Helsinki--results10.png" style="width:100%; height: 100%;"/> | <img src="/wiki/images/9/9b/T--Aalto-Helsinki--results10.png" style="width:100%; height: 100%;"/> | ||
| − | <figcaption style="text-align: | + | <figcaption style="text-align: center"> |
Figure 13. Fluorescence produced by the different promoters after 2 h induction (left) and 4 h (right) as a function of H | Figure 13. Fluorescence produced by the different promoters after 2 h induction (left) and 4 h (right) as a function of H | ||
<sub> | <sub> | ||
| Line 698: | Line 667: | ||
<figure style="text-align: center"> | <figure style="text-align: center"> | ||
<img src="/wiki/images/f/f0/T--Aalto-Helsinki--results100.png" style="width:100%; height: 100%;"/> | <img src="/wiki/images/f/f0/T--Aalto-Helsinki--results100.png" style="width:100%; height: 100%;"/> | ||
| − | <figcaption style="text-align: | + | <figcaption style="text-align: center"> |
Figure 14. Fluorescence produced by the different promoters after 2 h induction (left) and 4 h (right) normalized to the uninduced values, as a function of H | Figure 14. Fluorescence produced by the different promoters after 2 h induction (left) and 4 h (right) normalized to the uninduced values, as a function of H | ||
<sub> | <sub> | ||
| Line 793: | Line 762: | ||
<figure style="text-align: center"> | <figure style="text-align: center"> | ||
<img src="/wiki/images/1/13/T--Aalto-Helsinki--results12.png" style="width:20%; height: 20%;"/> | <img src="/wiki/images/1/13/T--Aalto-Helsinki--results12.png" style="width:20%; height: 20%;"/> | ||
| − | <figcaption style="text-align: | + | <figcaption style="text-align: center"> |
Figure 16. Western blot gel of step-tagged transporter construct. SS328-leu + QDR2 is the transporter containing C-terminal strep-tag. SS328-leu without transporter is used as a negative control. Both P and S samples are obtained after cell lysis and centrifugation: S is the soluble supernatant and P is the pellet. MW is the molecular weight marker. | Figure 16. Western blot gel of step-tagged transporter construct. SS328-leu + QDR2 is the transporter containing C-terminal strep-tag. SS328-leu without transporter is used as a negative control. Both P and S samples are obtained after cell lysis and centrifugation: S is the soluble supernatant and P is the pellet. MW is the molecular weight marker. | ||
</figcaption> | </figcaption> | ||
| Line 834: | Line 803: | ||
<figure style="text-align: center"> | <figure style="text-align: center"> | ||
<img src="/wiki/images/9/90/T--Aalto-Helsinki--results13.png" style="width:70%; height: 70%;"/> | <img src="/wiki/images/9/90/T--Aalto-Helsinki--results13.png" style="width:70%; height: 70%;"/> | ||
| − | <figcaption style="text-align: | + | <figcaption style="text-align: center"> |
Figure 17. Results from visual catalase assay with H | Figure 17. Results from visual catalase assay with H | ||
<sub> | <sub> | ||
| Line 852: | Line 821: | ||
<figure style="text-align: center"> | <figure style="text-align: center"> | ||
<img src="/wiki/images/7/78/T--Aalto-Helsinki--results14.png" style="width:40%; height: 40%;"/> | <img src="/wiki/images/7/78/T--Aalto-Helsinki--results14.png" style="width:40%; height: 40%;"/> | ||
| − | <figcaption style="text-align: | + | <figcaption style="text-align: center"> |
Figure 18. Comparison of foam layer thicknesses from the results of figure 14. The relative foam thickness, which corresponds to relative catalase activity, is calculated by dividing the height of foam layer with the diameter of the tube. The error (10%) is an estimate based on earlier experiments. | Figure 18. Comparison of foam layer thicknesses from the results of figure 14. The relative foam thickness, which corresponds to relative catalase activity, is calculated by dividing the height of foam layer with the diameter of the tube. The error (10%) is an estimate based on earlier experiments. | ||
</figcaption> | </figcaption> | ||
| Line 911: | Line 880: | ||
<br/> | <br/> | ||
<br/> | <br/> | ||
| − | < | + | </div> |
| − | Degradation | + | <div class="container" style="width: 75%; font-family: robotolight; color: #4d4d33"> |
| − | </ | + | <h1 id="THREE"> |
| + | Results - Degradation | ||
| + | </h1> | ||
| + | <br/> | ||
| + | <br/> | ||
| + | <figure style="text-align: center"> | ||
| + | <img src="/wiki/images/1/19/T--Aalto-Helsinki--kaava2.png" style="width:60%; height: 90%;"/> | ||
| + | </figure> | ||
<br/> | <br/> | ||
<br/> | <br/> | ||
| Line 997: | Line 973: | ||
<figure style="text-align:center"> | <figure style="text-align:center"> | ||
<img src="/wiki/images/6/62/T--Aalto-Helsinki--1.png" style="width:30%; height: 30%;"/> | <img src="/wiki/images/6/62/T--Aalto-Helsinki--1.png" style="width:30%; height: 30%;"/> | ||
| − | <figcaption style="text-align: | + | <figcaption style="text-align: center"> |
Figure 20. Western blot from initial MlrAE expression. Based on the western blot, we expressed a protein of about 28 kDa, which corresponds to the expected size of MlrA. The molecular weight standards (MW) are attached here from the digitized version of this blot. BI - before induction, AI - after induction, S1 - supernatant after expression culture is spinned down, P2 - pellet after cell lysis with sonication and spin, S2.1 - supernatant after cell lysis with glass beads and spin, S2.2 - supernatant after cell lysis with sonication and spin. | Figure 20. Western blot from initial MlrAE expression. Based on the western blot, we expressed a protein of about 28 kDa, which corresponds to the expected size of MlrA. The molecular weight standards (MW) are attached here from the digitized version of this blot. BI - before induction, AI - after induction, S1 - supernatant after expression culture is spinned down, P2 - pellet after cell lysis with sonication and spin, S2.1 - supernatant after cell lysis with glass beads and spin, S2.2 - supernatant after cell lysis with sonication and spin. | ||
</figcaption> | </figcaption> | ||
| Line 1,014: | Line 990: | ||
<figure style="text-align: center"> | <figure style="text-align: center"> | ||
<img src="/wiki/images/d/d5/T--Aalto-Helsinki--2.png" style="width:50%; height: 50%;"/> | <img src="/wiki/images/d/d5/T--Aalto-Helsinki--2.png" style="width:50%; height: 50%;"/> | ||
| − | <figcaption style="text-align: | + | <figcaption style="text-align: center"> |
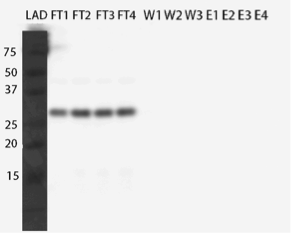
Figure 21. Western blot of different purification fractions from initial purification of MlrAE. The protein came out in the flow through fractions. FT - flow through, W - wash, E - elution. | Figure 21. Western blot of different purification fractions from initial purification of MlrAE. The protein came out in the flow through fractions. FT - flow through, W - wash, E - elution. | ||
</figcaption> | </figcaption> | ||
| Line 1,076: | Line 1,052: | ||
<figure style="text-align: center"> | <figure style="text-align: center"> | ||
<img src="/wiki/images/6/69/T--Aalto-Helsinki--4.png" style="width:40%; height: 40%;"/> | <img src="/wiki/images/6/69/T--Aalto-Helsinki--4.png" style="width:40%; height: 40%;"/> | ||
| − | <figcaption style="text-align: | + | <figcaption style="text-align: center"> |
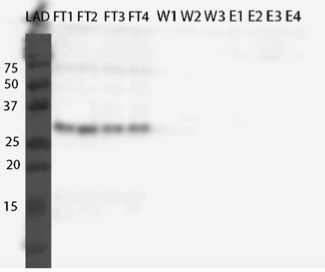
Figure 23. Western blot of purification of MlrAE without imidazole in the loading buffer. The enzyme came out in the flow through fractions. FT - flow through, W - wash, E - elution. | Figure 23. Western blot of purification of MlrAE without imidazole in the loading buffer. The enzyme came out in the flow through fractions. FT - flow through, W - wash, E - elution. | ||
</figcaption> | </figcaption> | ||
| Line 1,083: | Line 1,059: | ||
<br/> | <br/> | ||
<figure style="text-align: center"> | <figure style="text-align: center"> | ||
| − | <img src=" | + | <img src="/wiki/images/9/99/T--Aalto-Helsinki--5.png" style="width:40%; height: 40%;"/> |
| − | <figcaption style="text-align: | + | <figcaption style="text-align: center"> |
Figure 24. Western blot of purification of MlrAE with denaturing conditions.The enzyme came out in the flow through fractions. FT - flow through, W - wash, E - elution. | Figure 24. Western blot of purification of MlrAE with denaturing conditions.The enzyme came out in the flow through fractions. FT - flow through, W - wash, E - elution. | ||
</figcaption> | </figcaption> | ||
| Line 1,108: | Line 1,084: | ||
<img src="/wiki/images/0/0e/T--Aalto-Helsinki--6a.png" style="width:60%; height: 60%;"/> | <img src="/wiki/images/0/0e/T--Aalto-Helsinki--6a.png" style="width:60%; height: 60%;"/> | ||
<img src="/wiki/images/a/ab/T--Aalto-Helsinki--6b.png" style="width:10%; height: 10%;"/> | <img src="/wiki/images/a/ab/T--Aalto-Helsinki--6b.png" style="width:10%; height: 10%;"/> | ||
| − | <figcaption style="text-align: | + | <figcaption style="text-align: center"> |
Figure 25a and 25b. The chromatogram from FPLC. The blue line corresponds to UV (280nm) reading, and the green line to the concentration elution buffer. A small hill was observed within the eluted fractions (6b), with the peak in fraction A.3-C.3. | Figure 25a and 25b. The chromatogram from FPLC. The blue line corresponds to UV (280nm) reading, and the green line to the concentration elution buffer. A small hill was observed within the eluted fractions (6b), with the peak in fraction A.3-C.3. | ||
</figcaption> | </figcaption> | ||
| Line 1,121: | Line 1,097: | ||
<figure style="text-align: center"> | <figure style="text-align: center"> | ||
<img src="/wiki/images/e/e1/T--Aalto-Helsinki--7.png" style="width:40%; height: 40%;"/> | <img src="/wiki/images/e/e1/T--Aalto-Helsinki--7.png" style="width:40%; height: 40%;"/> | ||
| − | <figcaption style="text-align: | + | <figcaption style="text-align: center"> |
Figure 26. Western blot of FPLC purification fractions, LAD (the molecular weight standard) is drawn since we weren’t able to get it clearly visible with adjusting the picture settings. AI S - supernatant fraction after cell lysis, AI P - pellet fraction after cell lysis, A1-C2 fractions from the FPLC, check figure 25a. About 28 kDa protein in the A1, B1, C1 fractions which correspond to the flow through fractions. | Figure 26. Western blot of FPLC purification fractions, LAD (the molecular weight standard) is drawn since we weren’t able to get it clearly visible with adjusting the picture settings. AI S - supernatant fraction after cell lysis, AI P - pellet fraction after cell lysis, A1-C2 fractions from the FPLC, check figure 25a. About 28 kDa protein in the A1, B1, C1 fractions which correspond to the flow through fractions. | ||
</figcaption> | </figcaption> | ||
| Line 1,129: | Line 1,105: | ||
<figure style="text-align: center"> | <figure style="text-align: center"> | ||
<img src="/wiki/images/b/be/T--Aalto-Helsinki--8.png" style="width:70%;"/> | <img src="/wiki/images/b/be/T--Aalto-Helsinki--8.png" style="width:70%;"/> | ||
| − | <figcaption style="text-align: | + | <figcaption style="text-align: center"> |
Figure 27: Western blot (left) and SDS-PAGE (right) of FPLC purification fractions. D2 - B4 fractions from FPLC, check figure 25a, MW - molecular weight standard. There are proteins in the elution fractions that have been detected by the anti-His antibody, and there seems to be a right sized protein also (about 28 kDa), most of it being in the C3 fraction. | Figure 27: Western blot (left) and SDS-PAGE (right) of FPLC purification fractions. D2 - B4 fractions from FPLC, check figure 25a, MW - molecular weight standard. There are proteins in the elution fractions that have been detected by the anti-His antibody, and there seems to be a right sized protein also (about 28 kDa), most of it being in the C3 fraction. | ||
</figcaption> | </figcaption> | ||
| Line 1,172: | Line 1,148: | ||
<p class="justify" style="font-size:19px;"> | <p class="justify" style="font-size:19px;"> | ||
<b> | <b> | ||
| − | + | Optimizing yeast growth conditions | |
</b> | </b> | ||
</p> | </p> | ||
| Line 1,205: | Line 1,181: | ||
<br/> | <br/> | ||
<figure style="text-align: center"> | <figure style="text-align: center"> | ||
| − | <img src=" | + | <img src="/wiki/images/1/18/T--Aalto-Helsinki--10.png" style="width:40%; height: 40%;"/> |
| − | <figcaption style="text-align: | + | <figcaption style="text-align: center"> |
Figure 29. Western blot of different yeast MlrA constructs. pAH12 refers to MlrAY, pAH13 is MlrAYa, pAH14 is MlrAY3a, S1 - the growth medium, CL - cell lysate, S2 - supernatant from CL and P2 - pellet from CL. | Figure 29. Western blot of different yeast MlrA constructs. pAH12 refers to MlrAY, pAH13 is MlrAYa, pAH14 is MlrAY3a, S1 - the growth medium, CL - cell lysate, S2 - supernatant from CL and P2 - pellet from CL. | ||
</figcaption> | </figcaption> | ||
| Line 1,279: | Line 1,255: | ||
<br/> | <br/> | ||
<figure style="text-align: center"> | <figure style="text-align: center"> | ||
| − | <img src=" | + | <img src="/wiki/images/a/a6/T--Aalto-Helsinki--12.png" style="width:40%; height: 40%;"/> |
| − | <figcaption style="text-align: | + | <figcaption style="text-align: center"> |
Figure 31. Western blot of localization experiment. The enzymes seem to localize in the insoluble fraction. LAD - molecular weight, NC - negative control S. cerevisiae SS328-leu without mlrA gene, S1 - growth medium, S2 - supernatant after cell lysis, P2 - pellet after cell lysis, S3 - re-folded proteins, P3 - plasma membrane + cell wall, S4 - soluble protein, P4 - inner membranes. | Figure 31. Western blot of localization experiment. The enzymes seem to localize in the insoluble fraction. LAD - molecular weight, NC - negative control S. cerevisiae SS328-leu without mlrA gene, S1 - growth medium, S2 - supernatant after cell lysis, P2 - pellet after cell lysis, S3 - re-folded proteins, P3 - plasma membrane + cell wall, S4 - soluble protein, P4 - inner membranes. | ||
</figcaption> | </figcaption> | ||
| Line 1,324: | Line 1,300: | ||
<br/> | <br/> | ||
<figure style="text-align: center"> | <figure style="text-align: center"> | ||
| − | <img src=" | + | <img src="/wiki/images/2/25/T--Aalto-Helsinki--14.png" style="width:40%; height: 40%;"/> |
<figcaption style="text-align: center"> | <figcaption style="text-align: center"> | ||
Figure 33. Enzymatic activity of MlrAYa. Results show that the 1:10 dilution has the highest activity whereas 1:1000 has the lowest. | Figure 33. Enzymatic activity of MlrAYa. Results show that the 1:10 dilution has the highest activity whereas 1:1000 has the lowest. | ||
| Line 1,339: | Line 1,315: | ||
</p> | </p> | ||
<h2> | <h2> | ||
| − | + | Protocols and lab book | |
</h2> | </h2> | ||
<br/> | <br/> | ||
<p class="justify" style="font-size:19px;"> | <p class="justify" style="font-size:19px;"> | ||
| − | + | If you are interested in viewing or using our protocols, more details on how we have conducted our experiments, or want to view our lab notes, email us at team [a] aaltohelsinki . com . | |
<br/> | <br/> | ||
<br/> | <br/> | ||
| − | |||
| − | |||
| − | |||
| − | |||
</div> | </div> | ||
| + | <br/> | ||
<br/> | <br/> | ||
<div class="sectionjee" style="background-color: #8a4b29"> | <div class="sectionjee" style="background-color: #8a4b29"> | ||
| − | <h2 style=" | + | <h2 style="font-family: im_fell_french_canon_proIt; font-size: 20px;"> |
“ | “ | ||
<i style="font-family: robotolight; font-size: 19px;"> | <i style="font-family: robotolight; font-size: 19px;"> | ||
| − | + | Our assumption was that if the enzymes have activity, they are most probably localized in the plasma membrane in an active form | |
</i> | </i> | ||
” | ” | ||
| Line 1,363: | Line 1,336: | ||
<br/> | <br/> | ||
</div> | </div> | ||
| + | <br/> | ||
<br/> | <br/> | ||
<div class="container" style="width: 75%; font-family: robotolight; color: #4d4d33"> | <div class="container" style="width: 75%; font-family: robotolight; color: #4d4d33"> | ||
| Line 1,377: | Line 1,351: | ||
page. | page. | ||
</p> | </p> | ||
| + | <br/> | ||
<p class="justify" style="font-size:19px;"> | <p class="justify" style="font-size:19px;"> | ||
Our work mainly involved safety level 1 practices; all organisms that we used belong to biosafety level 1. We worked with | Our work mainly involved safety level 1 practices; all organisms that we used belong to biosafety level 1. We worked with | ||
| Line 1,416: | Line 1,391: | ||
<br/> | <br/> | ||
<div class="sectionjee" style="background-color: #8a4b29"> | <div class="sectionjee" style="background-color: #8a4b29"> | ||
| − | <h2 style=" | + | <h2 style="font-family: im_fell_french_canon_proIt; font-size: 20px;"> |
“ | “ | ||
<i style="font-family: robotolight; font-size: 19px;"> | <i style="font-family: robotolight; font-size: 19px;"> | ||
| − | + | Our safety training has included topics such as disposal of GMO waste, chemical work, emergency prevention and what to do in case of emergency | |
</i> | </i> | ||
” | ” | ||
| Line 1,429: | Line 1,404: | ||
<br/> | <br/> | ||
<div class="container" style="width: 75%; font-family: robotolight; color: #4d4d33"> | <div class="container" style="width: 75%; font-family: robotolight; color: #4d4d33"> | ||
| − | < | + | <h1 id="FIVE"> |
References | References | ||
| − | </ | + | </h1> |
<br/> | <br/> | ||
<p class="justify" style="font-size:19px;"> | <p class="justify" style="font-size:19px;"> | ||
| Line 1,474: | Line 1,449: | ||
<script src="./Tinyone - HTML_files/offcanvas.js"></script> | <script src="./Tinyone - HTML_files/offcanvas.js"></script> | ||
<script src="./Tinyone - HTML_files/function.js"></script--> | <script src="./Tinyone - HTML_files/function.js"></script--> | ||
| − | <div class="navbar navbar-fixed-bottom navbar-default"> | + | <div class="navbar navbar-fixed-bottom navbar-default" style="text-align: center;"> |
| − | <ul class="botnav" style=" | + | <ul class="botnav" style="margin: 0 auto;"> |
<progress id="progressbar" value="0"> | <progress id="progressbar" value="0"> | ||
</progress> | </progress> | ||
Latest revision as of 08:35, 5 December 2016
Laboratory
Assays
Fluorescence assays
The principle of our sensor is that a gene coding for yellow fluorescent protein is coupled to different promoters sensitive to oxidative stress. Thus, in the case of oxidative stress, they start to produce fluorescent protein. We hope that this fluorescent signal will be proportional to the quantity of the inducer - in this case, microcystin or another factor that produces oxidative stress.
As microcystin needs a specific transporter to enter yeast cells, and when we started our experiments we didn’t have this transporter and the stress promoters in the same strain, we had to use something else to induce the promoters. As microcystin exposure results in increased levels of reactive oxygen species in yeast cells, we decided to use one such reactive oxygen species - hydrogen peroxide - to directly induce the promoters.
For measuring fluorescence, we decided to use a microplate reader (Cytation3, BioTek) in order to be able to easily monitor the development of the fluorescence. In our microplate reader experiments, liquid cultures of yeast cells containing the stress promoter plasmids were induced with different concentrations of hydrogen peroxide on a 96-well plate. The plate was sealed with an optically clear cover, and incubated in the microplate reader at +30 °C with vertical shaking. Yeast has a tendency to clump when grown in microtiter plates, but vigorous vertical shaking is suitable for limiting this. OD600 and fluorescence values can then be measured throughout the growth of the cultures at defined intervals to observe the development of fluorescence and obtain an expression profile for the newly constructed stress promoters.
As the excitation and emission wavelengths of Venus were too close together for measuring with our microplate reader (515 nm/excitation and 528 nm/emission), the excitation wavelength was decreased to 502 nm, although this likely reduced the fluorescence signals to some extent. As no secondary peaks could be measured, this seemed to be the best option.
From the plate reader results, multiple different curves could be drawn. Plots of OD600 and fluorescence as functions of time are straightforward to draw, but as hydrogen peroxide slows the cell growth significantly, comparisons of fluorescence values at any given time point would not be informative in telling about the amount of fluorescence produced by the cells. A more representative graph would thus be one where fluorescence is presented as the function of cell density (OD600); this way, fluorescence signals given by cell populations of equal density can be compared. All the sample values can then be compared to an uninduced control and to a positive control (Venus under GDP1 promoter). As our sensor is based on detecting differences in fluorescence between induced and uninduced conditions, we can use Venus under GPD promoter dually also as a negative control; with this negative control, we see whether H 2 O 2 concentration differences have unintended background effects to fluorescence, and differentiate these from the effect of actual induction.
As a second method for measuring fluorescence, we used a flow cytometer (FACSaria III, BDBiosciences). In flow cytometry, the fluorescence can be measured from individual cells in a cell suspension. The fluorescent signal of thousands of cells can be rapidly measured to produce information on the mean or median fluorescence values and distribution of fluorescence. This means that the development of the fluorescence as a function of time can’t be assessed as easily, as samples of each measured time point have to be prepared separately. However, more precise values are obtained, with less bias from background. To analyze fluorescence, induction is performed by adding hydrogen peroxide to a cell culture to the desired concentration, and incubating the cell cultures at +30 °C with shaking. A sample of cells can then be collected from the cell culture, and diluted to a an appropriate cell density in PBS for analysis with the flow cytometer.
For the concentrations used to induce fluorescence in our fluorescence assays, we used microcystin concentrations of 0, 1, 10 and 100 μg/L, as these concentrations cover the normal possible range of microcystin in lakes; 1 μg/L is the safety limit, and without the formation of scum, maximal concentrations of 20 μg/L (Chorus and Bartram, 1999) are possible. For hydrogen peroxide concentrations, because a clear relationship can’t be drawn between hydrogen peroxide concentrations corresponding to the oxidative stress of a certain microcystin concentration, we decided to determine a suitable concentration range experimentally. This way, we started out by testing a broad range which we narrowed down to conditions suitable for testing YFP expression based on our observations.
Catalase assays
Microcystin cannot be imported into yeast cells without a specific transporter. A major part of our project was to transfer a microcystin importing transporter from S. cerevisiae strain VL3 into SS328-leu, the strain we used in our experiments. As SS328-leu has a transporter corresponding to the MC-importing one of VL3, we decided to replace this transporter with the VL3 variant.
In strain VL3, differences in microcystin concentration have a characteristic effect on the catalase activity of the cell (Figure 1). We reasoned that this should be the case also in our lab strain after the insertion of a microcystin transporter. As non-modified lab strains (e.g. SS328-leu) don’t import the toxin naturally, the toxin shouldn’t have much effect on their catalase activity levels. However, if the VL3 QDR2 transporter is produced in the cell, the toxin uptake increases, resulting in increased catalase production. Based on this reasoning, we planned to verify the functionality of the new transporter with a catalase activity assay.
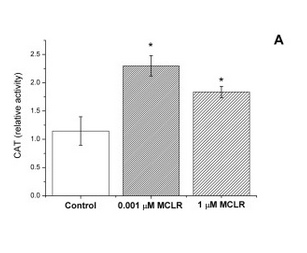
Our plan was to use a simple visual catalase assay for this functionality verification (Iwase et al., 2013). In preparation for this assay, yeast cells are incubated with microcystin. After the incubation, to perform the catalase assay on the cells, hydrogen peroxide and the detergent Triton X-100 are added. As catalase breaks down hydrogen peroxide to water and oxygen, bubbles are formed in the samples; Triton X functions as a surfactant, enhancing the formation and stability of a foam layer. The quantity of formed foam is relative to catalase activity in the cells, so by comparing the thicknesses of the foam layers, catalase activities can be compared.
We have three hypotheses for the results of our assay.
- VL3 and SS328-leu with the QDR2 from VL3, having the MC-transporter for microcystin would have highest catalase activities in the presence of microcystin.
- Foam layer in SS328-leu shouldn’t change with varying toxin concentrations.
- Increasing catalase concentrations would increase the foam layer thicknesses in VL3 and SS328-leu with the QDR2 from VL3. The increase would stop sometime before 1000 μg/l.
For our catalase tests, we used microcystin concentrations of 0, 1, 10, 100 and 1000 μg/L (0-1 μM MC). We chose this range because it corresponded to the concentrations in our reference article - 0, 1, and 1000 μg/L (Valério et al., 2014), but added two more concentrations to the test range (10 and 100 μg/L) to gain more information on the behavior of catalase activity.
Enzyme activity
For the second part of our project, our goal was to produce the microcystin-degrading enzyme microcystinase (MlrA). To see whether the produced enzyme degrades microcystin, we had to test its activity. We were fortunate to have talked to Kaarina Sivonen’s Cyanobacteria research group from the University of Helsinki, who were kind enough to help us with this.
We measured enzyme activity by preparing enzyme-microcystin reactions, incubating them and taking samples at different time points. The samples were then analysed by Matti Wahlsten from Kaarina Sivonen’s group with liquid chromatography - mass spectrometry (LC-MS), and as a result we got the relative amount of microcystin-LR (and -RR, but our focus is on -LR), from which we could plot graphs showing the degradation.
The reactions contained the enzyme to be tested for activity, either diluted or undiluted. There was also 0.1% BSA, which functions as a blocking agent, so that the enzyme does not stick to the walls of the tube. The microcystin concentration used in our activity reactions is 1 μg/L, which corresponds to WHO’s safety limit (WHO, 2003), also used in previous experiments (Dziga, 2012; Edwards, 2008) when measuring microcystinase activity. We used a microcystin extract which was prepared from freeze-dried Anabaena sp. strain 90 cyanobacteria, according to protocol provided to us by Matti Wahlsten. The concentration of microcystin-LR in the extract can only be estimated; in our case it should have been approximately one promille of the freeze dried cyanobacteria’s weight. Also, microcystins have high affinity to plastic. This meant that we had to do our reactions in glassware, and, more importantly, take the time point samples with pasteur pipettes made of glass, since our lab did not have small enough glass pipettes to measure volumes such as 100 μl. This meant that our enzyme activity measurements wouldn’t be exact, and there would be a bigger error margin.
The enzyme reactions were incubated at +37 °C and the time point samples were taken at certain times. The 0h samples were taken right after the microcystin extract was added to the reaction, before starting the incubation, to ensure that there was no degradation of the initial amount of microcystin in the sample. After the samples of 100 μl were taken, 100 μl of methanol was added to inactivate the enzyme. This is why taking the samples with pasteur pipettes is not ideal: the amount of sample is not exact whereas the amount of methanol is. This potentially leads to slight errors in microcystin concentrations in the samples, as some might have more than 100 μl of the reaction and some less, but all are inactivated with the same amount of methanol.
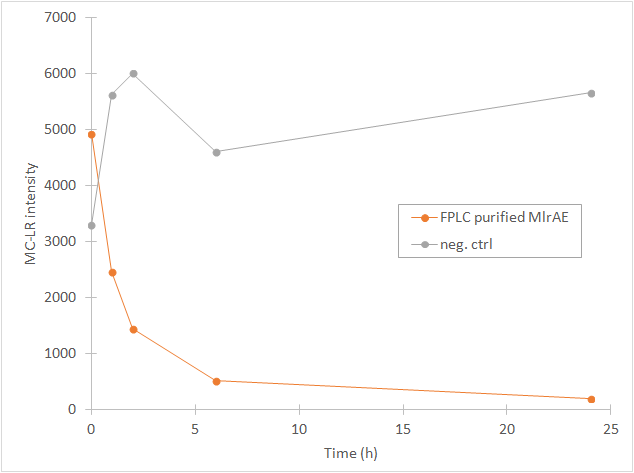
The samples were then analysed with LC-MS, which first separates different components of the sample with liquid chromatography and then analyses the the relative abundance of these components with mass spectrometry. In our case, the results should show that the peak corresponding to microcystin-LR in the chromatograph grows smaller when different time points are being compared. Also, the peak corresponding to the degradation product of microcystin-LR should grow bigger as time passes. Example results can be seen from Figures 2a and 2b.

From the chromatography graphs, the relative abundance of microcystin in each sample is obtained, and it can be then plotted against time. This should give a graph where the amount of microcystin diminishes as time increases. As an example, see Figure 3, which we obtained for MlrA we produced in E. coli .
Localization workflow
In addition to verifying the activity of the produced MlrAs, we aimed to determine where in the cells the enzymes are localized and see if our hypotheses are correct. Our work flow for this is presented in Figure 4.
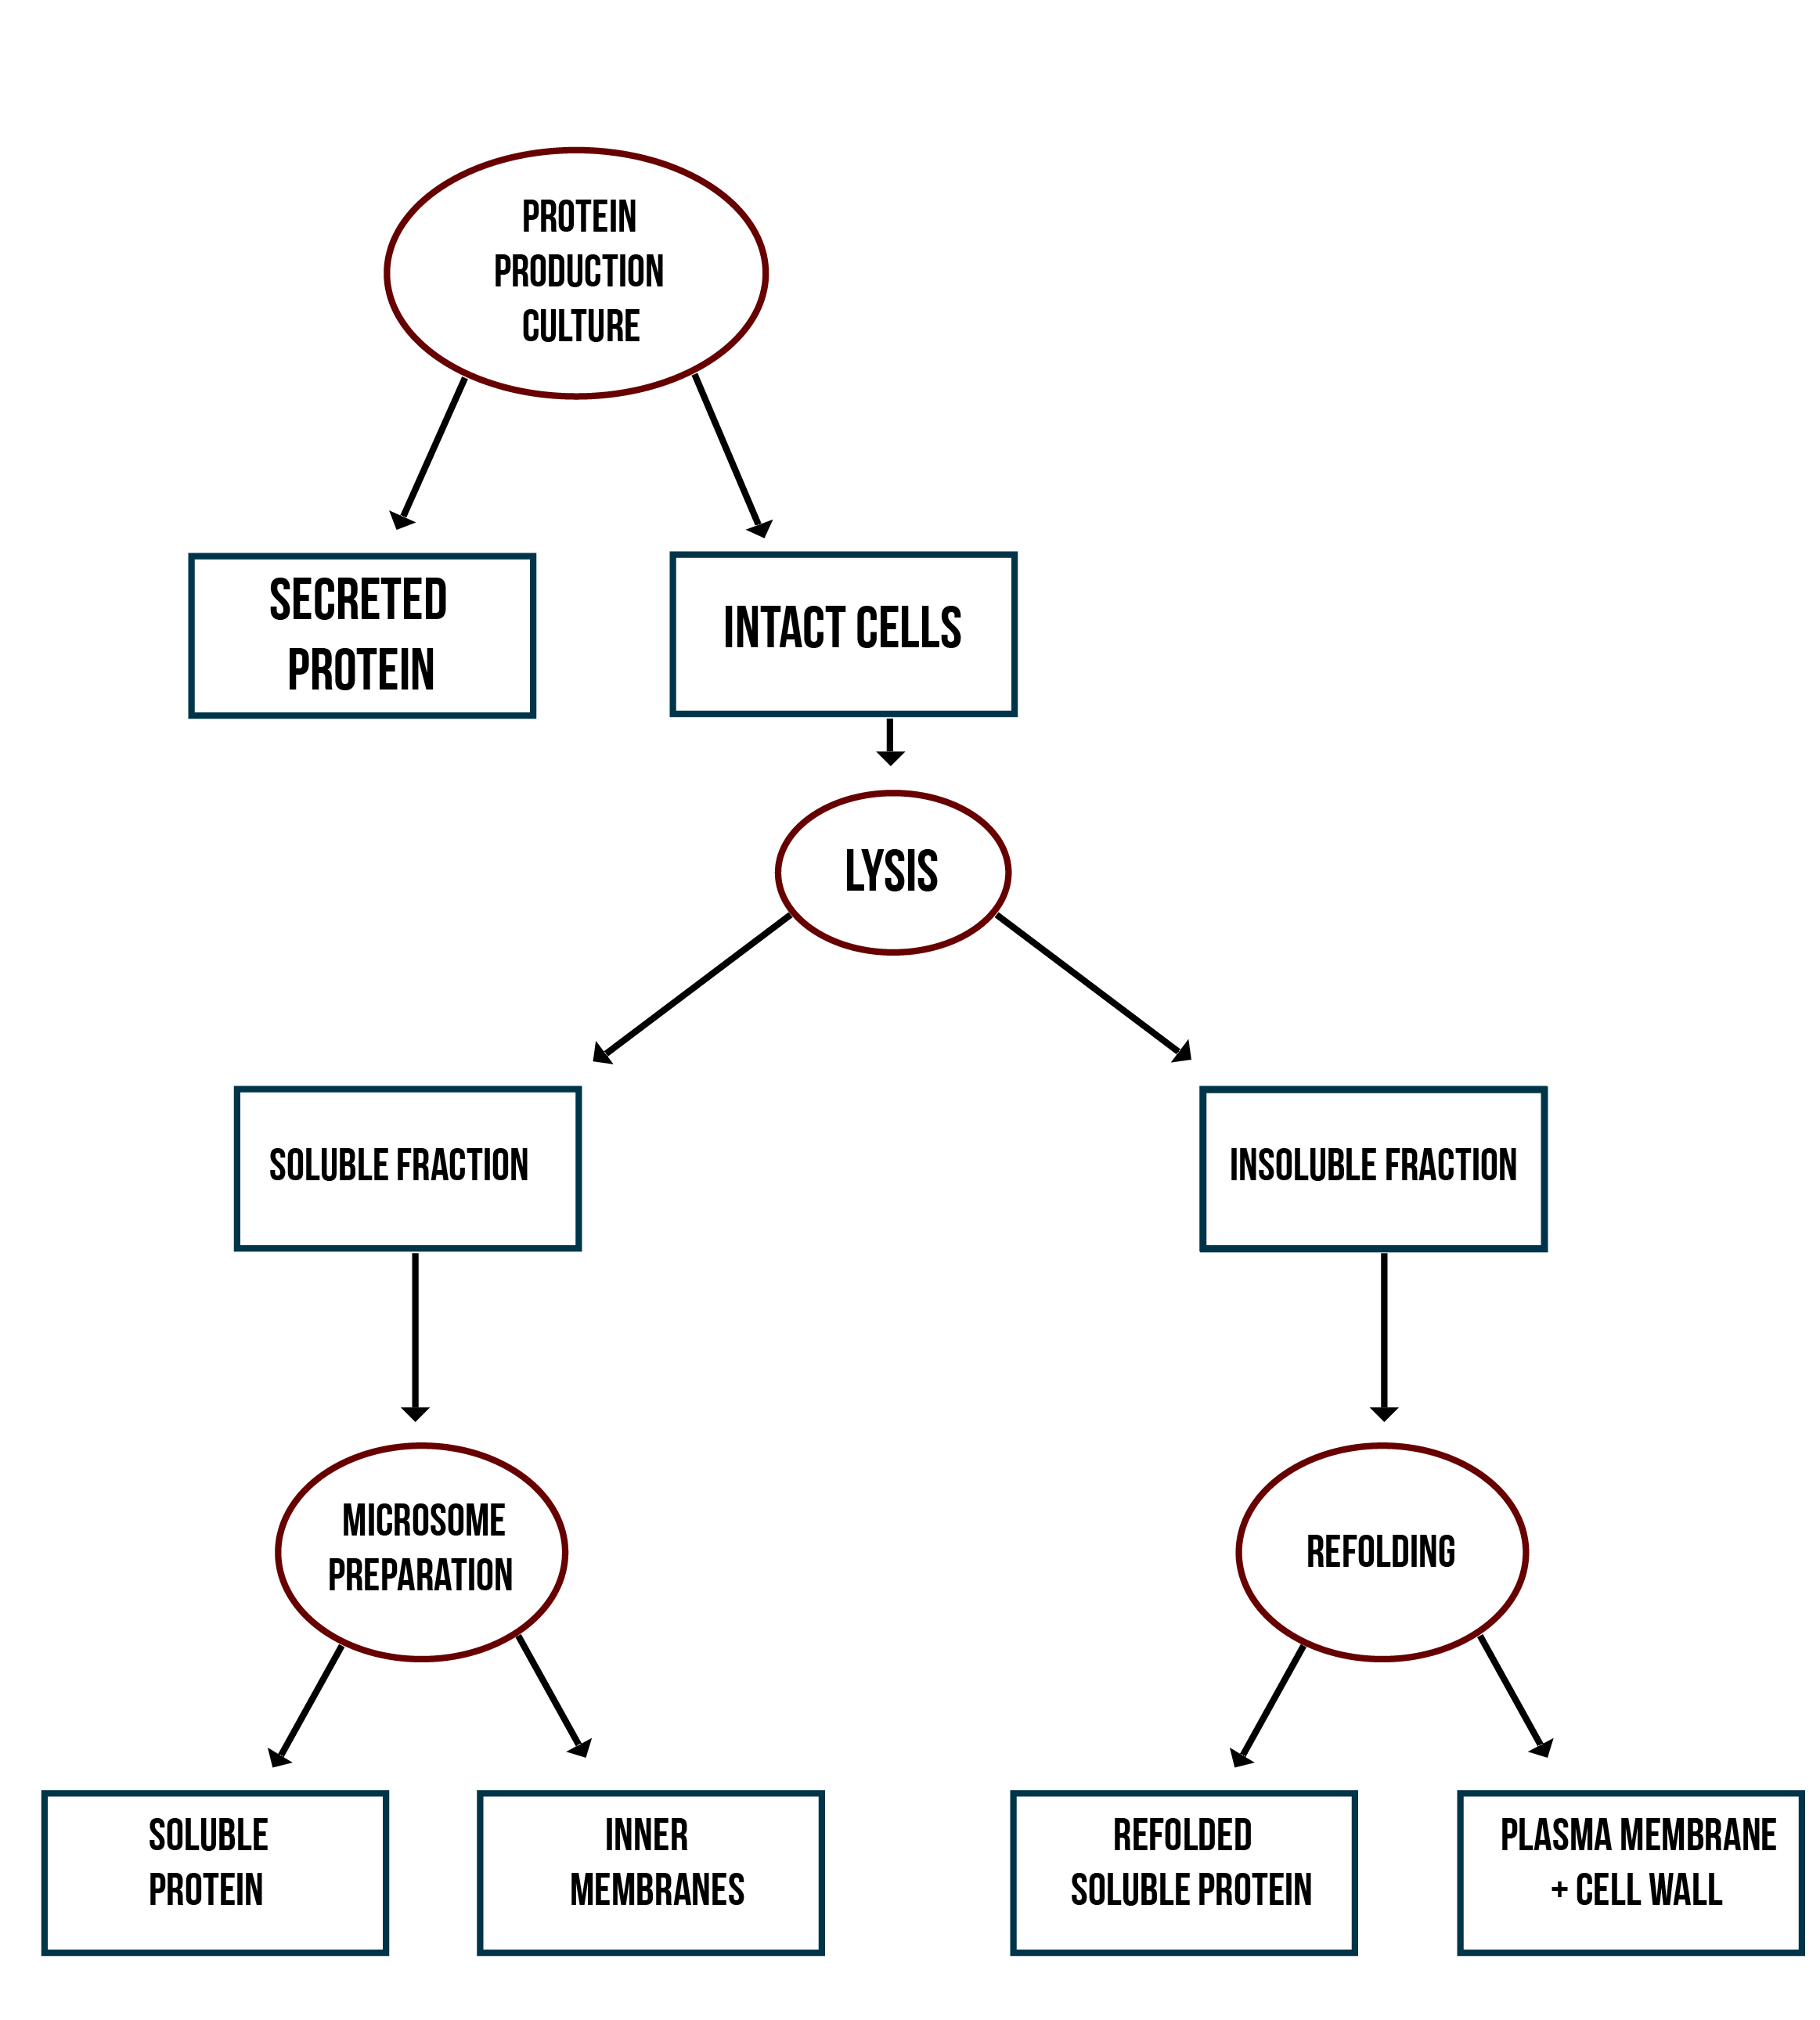
Our hypothesis for MlrAY3a construct is that it should be secreted. If the enzyme is secreted, it should be localized outside of the cell, in the growth medium. To test for this, after the expression has ended and the cell culture is centrifuged down, the supernatant, i.e. the growth medium, is collected and a sample is taken. The media can be first concentrated in order to get high enough concentrations of the protein for successful detection with e.g. antibodies in western blotting.
Our hypothesis for MlrAY is that it should be soluble in the cytosol. To verify this the following procedure should be performed. After collecting the cells from the growth culture, they are lysed and centrifuged. All soluble proteins, as well as inner membranes, should be in the supernatant fraction (or the soluble fraction in the graph). To verify that the protein is actually soluble and not in the inner membranes, the inner membranes should be purified (microsome preparation in the graph). It is done by using specific lysis buffer and ultracentrifugation of the supernatant fraction after lysis. The inner membranes should end up in the pellet fraction, whereas the soluble proteins reside in the supernatant. More detailed instructions are found in protocols. In addition, this way one can determine if the enzyme (or other protein) localizes to the inner membranes.
If the proteins are produced too rapidly, it might be that they don’t fold properly and form insoluble inclusion bodies. These inclusion bodies end up in the pellet fraction after cell lysis and centrifugation. To separate these from the rest of the insoluble fraction, which is the cell debris comprising of the cell wall and plasma membrane, refolding of the proteins must be performed. The pellet fraction (insoluble fraction in the graph) is resuspended first in solubilization buffer containing a high concentration of urea. This denatures the proteins, making them soluble. After this, the insoluble fraction is centrifuged, and the denatured protein is left in the supernatant fraction. Next, the samples are dialyzed in order to change the denaturing buffer into refolding buffer containing glycerol and EDTA. After this procedure, the proteins should be refolded to their proper structure.
Our hypothesis for MlrAYa is that it would localise to the plasma membrane. If that is the case, it can also be verified by the refolding experiment; if the enzyme (or other protein) is present in the pellet after refolding, it is most likely embedded in the plasma membrane.
From each stage of the localization workflow, samples must be taken to be analyzed with western blotting to verify the location of the enzyme.
“ Our sensor is based on detecting differences in fluorescence ”
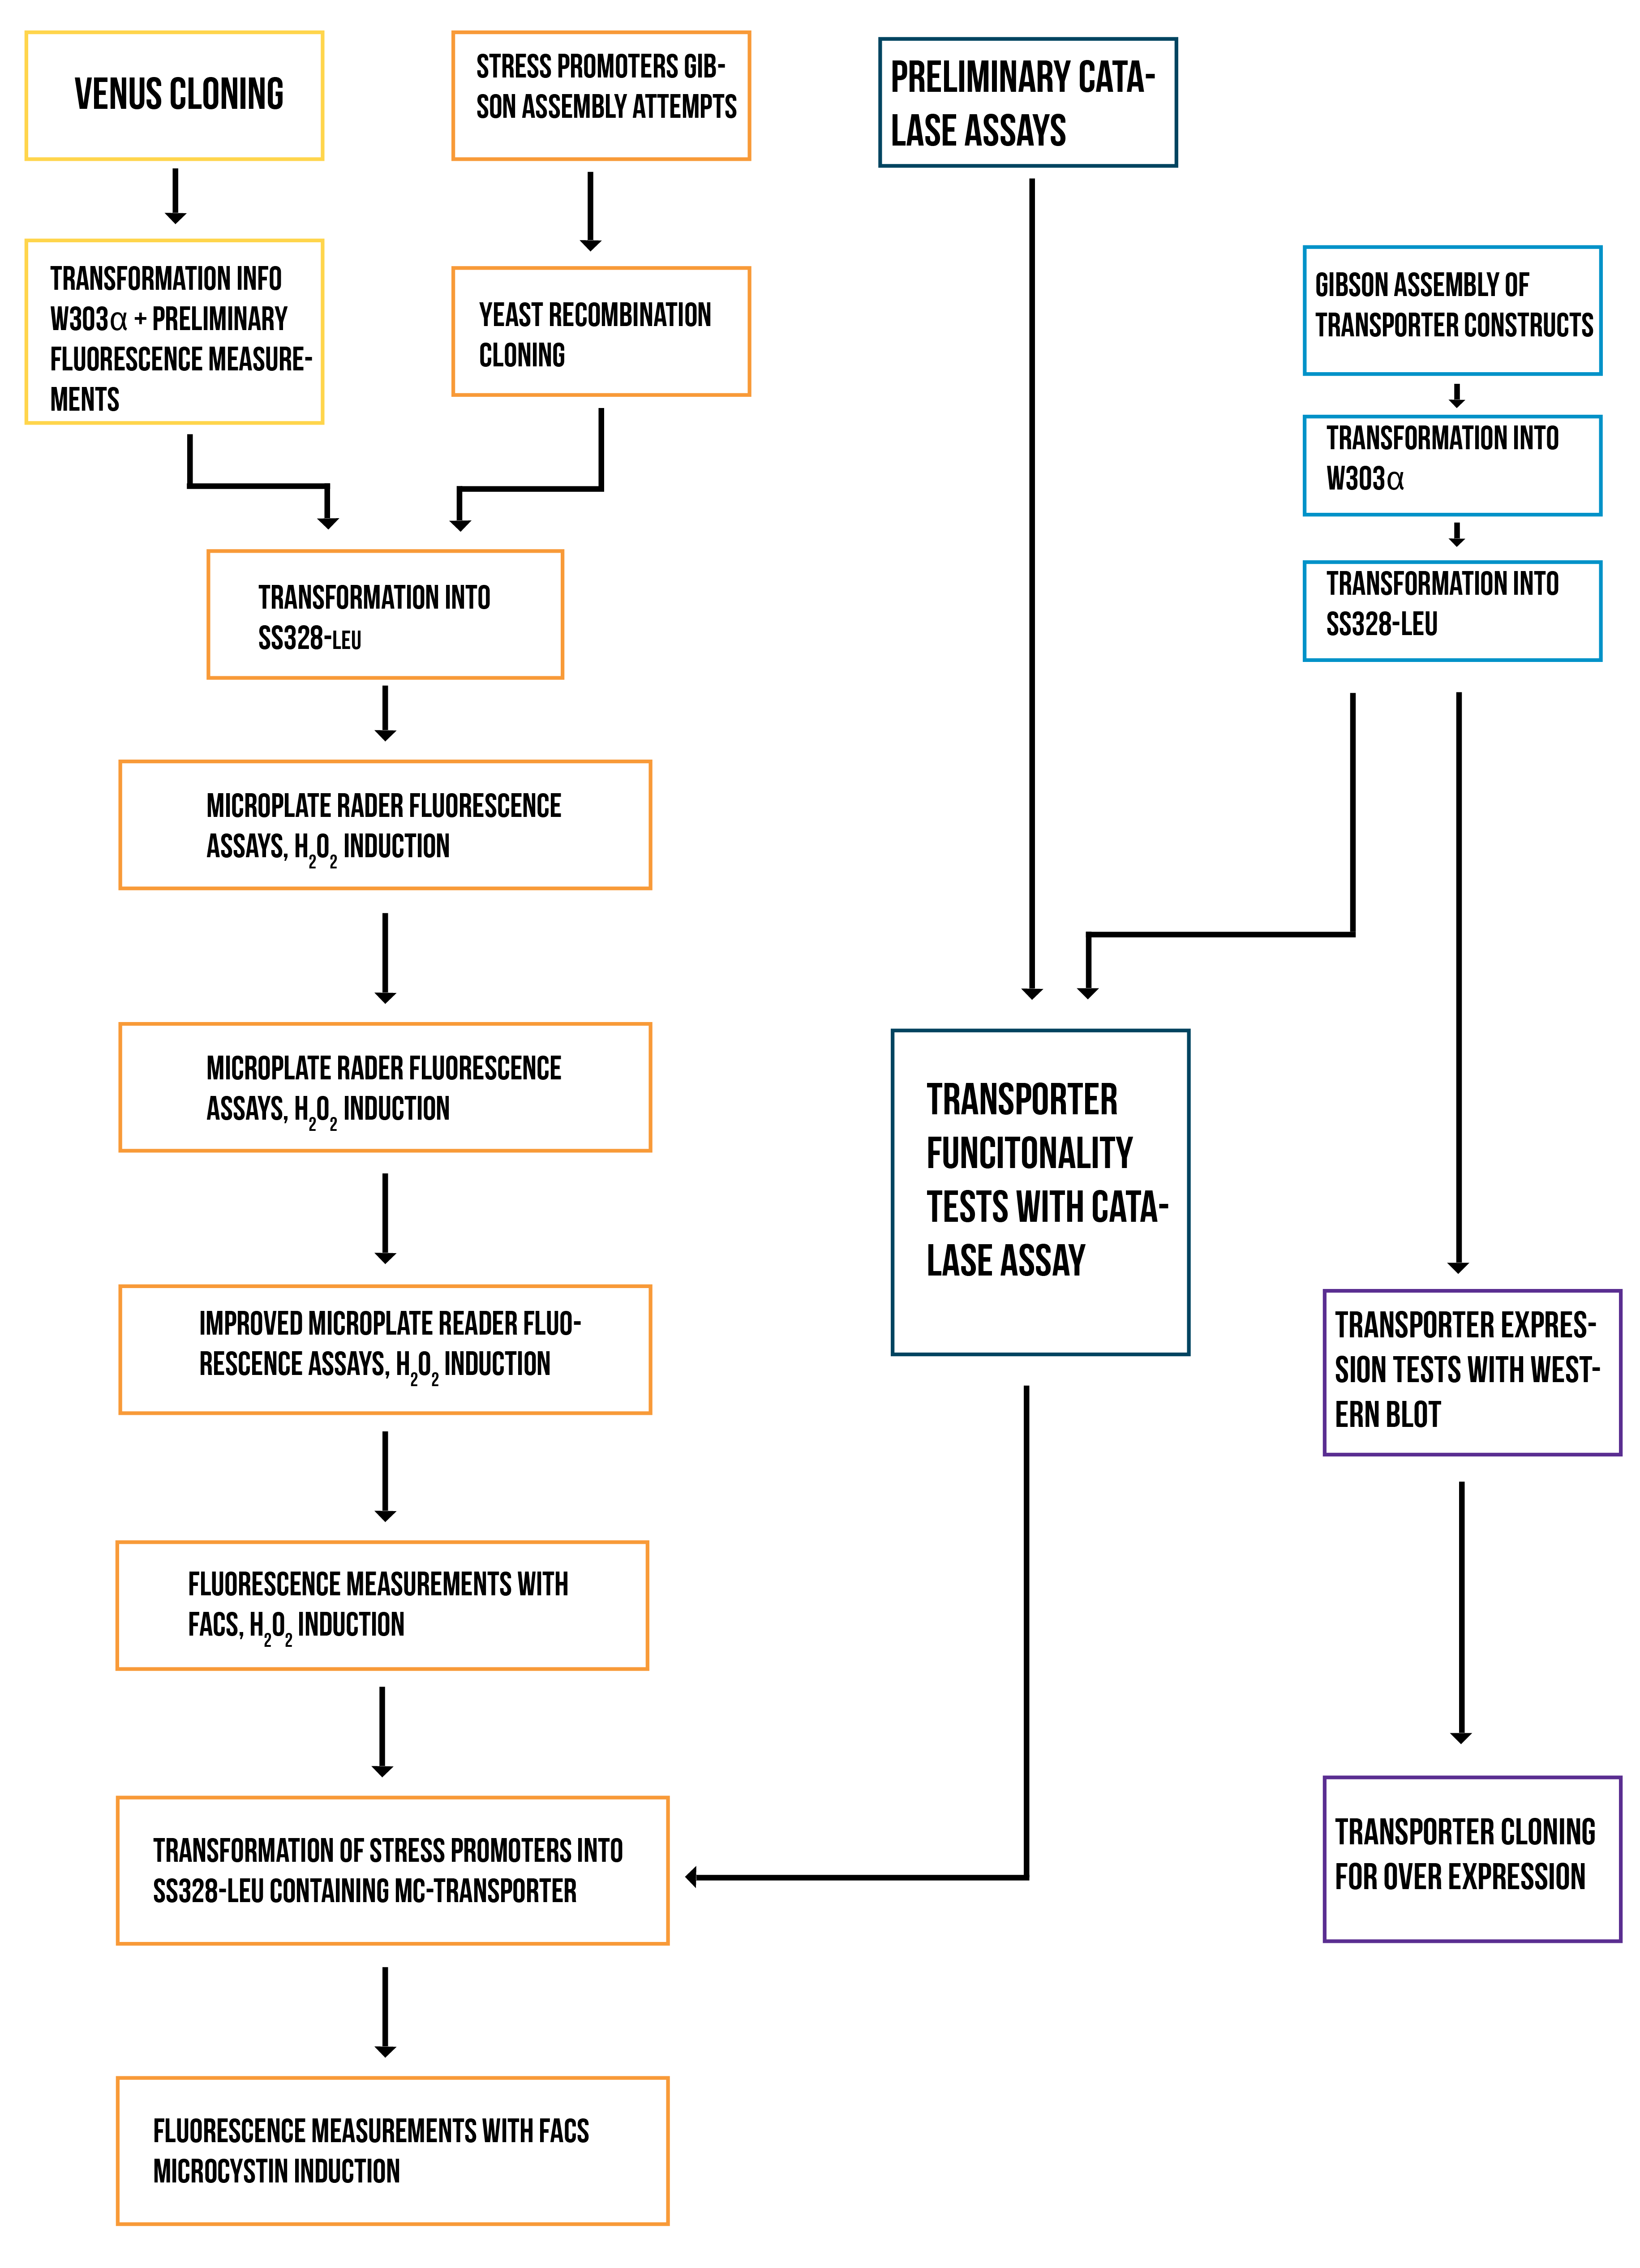
Results - Detection
Stress Promoters
Venus restriction enzyme cloning
Our plan was to express Venus YFP under known promoters for comparison with our designed stress promoter. To this end, we chose the constitutive GPD1 promoter and the galactose-inducible GAL1 promoter. We used restriction enzyme cloning to insert Venus into pRS415-GPD and pRS415-GAL plasmid backbones. Cloning results were verified with colony PCR, diagnostic restriction digest and sequencing. As a result, colonies containing correct inserts were obtained.
Transformation of Venus into W303α and preliminary fluorescence measurements
Plasmids from verified colonies were purified and transformed into S. cerevisiae strain W303α to test the color intensity of produced fluorescent protein in yeast host. We had hoped that fluorescence could be seen by bare eye, but no color could be seen. The intensity was lower than expected, possibly due to the YFP being expressed at low levels for one reason or another, and thus required the use of a fluorometer to see changes in fluorescence.
To this end, we used a microplate reader, and found suitable settings to measure the fluorescence. We grew our yeast on a microtiter plate to continuously measure the development of fluorescence. Induction with galactose was done right in the beginning and timing was started from that point. The difference in fluorescence to a no-plasmid control was clear, for both the constitutive GPD1 promoter and galactose-induced GAL1 promote, as can be seen from figure 5.

Because the Venus construct with the constitutive GPD1 promoter was much more convenient to use than the inducible GAL1 promoter, we decided to use mostly the GPD1 promoter as a control for our future experiments with the constructs containing Venus and the stress promoters.
Gibson Assembly attempt for stress promoters
Our plan was to construct our stress promoter plasmid using Gibson Assembly, and we needed to do PCR to linearize our plasmid backbone (pRS415-GAL) for this, so that its ends would overlap with the ends of our designed stress promoter gBlocks. We couldn't get the PCR working despite many attempts.
Yeast recombination cloning
After failing to properly linearize our plasmid for Gibson assembly, we decided to try our second cloning option: yeast recombination. We used the efficient homologous recombination capability characteristic to yeast to assemble our designed stress promoter plasmids. This was done by cotransforming plasmid backbone linearized with restriction enzymes and the linear stress promoter insert that we had received from IDT. We isolated the DNA from yeast and transformed it into E. coli to amplify, purify and verify the correctly assembled plasmid. Sequencing ultimately confirmed that we had plasmids with the correct sequences for our TSA1 and CTT1 promoter constructs; for the CCP1 construct, our plasmid contained a single base mutation, but as it was in the designed promoter area upstream of the transcription factor binding sites, we decided to use it all the same.
Transformation into SS328-leu
Because we found out of a mutation in a key oxidative stress gene in W303α (Veal et al., 2003) which affects the genes and transcription factors our detection principle is based on, we decided it would be better to work with a different S. cerevisiae strain. We decided on strain SS328-leu, and successfully transformed both the stress promoter plasmids and the Venus control plasmids into the new strain.
Microplate reader fluorescence assays in SS328-leu, H 2 O 2 induction
To obtain information about the expression profile of our stress promoters, we measured fluorescence and cell density of cultures supplemented with various concentrations of inducing hydrogen peroxide while growing the cultures in a microplate readers. We used yeast expressing YFP under GPD1 promoter as a control to assess hydrogen peroxide effect on growth and fluorescence in a system that isn’t induced by it (Figure 6).

Attempts were made to produce a second negative control by performing measurements with the basic yeast strain without plasmid. However, for some reason the growth of this strain was extremely poor when grown on the same medium where stress promoter constructs were cultured (SD-medium; for plasmid-free strain, leucine was supplemented to the medium, as leucine auxotrophy was used for plasmid selection). As e.g. YPD medium is unsuitable for direct cell culture fluorescence measurements, we didn’t obtain this additional control. A better alternative would have been having an empty, non-YFP producing plasmid in the negative control, but we decided to make do with our existing controls due to time constaints.
Cells containing TSA1 promoter display behavior similar to the GPD1 control, as seen from figure 7.

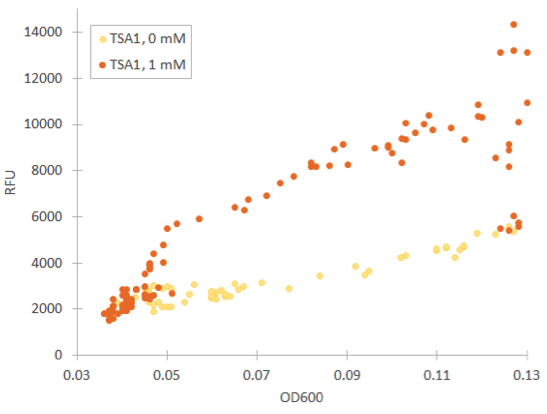
The TSA1 promoter seems to have a high expression base level, but we expected the fluorescence to increase when induced. Based on figure 7, it doesn’t seem to happen; however, we noted that the fluorescence values when inducing with 1 mM H 2 O 2 were the same as the uninduced ones. This was a clear difference to the GPD1 control, where fluorescence was much lower when hydrogen peroxide was added. Because the hydrogen peroxide has such a notable effect on cell growth, we decided that plotting fluorescence as a function of cell density would give much more information of whether the induced culture is producing more fluorescence relative to the cell density (Figure 8). This graph would indeed imply an increase in fluorescence.
The fluorescence levels produced under CCP1 and CTT1 promoters were very low. We also realized that as the levels of fluorescence were so low, the background fluorescence of the growth medium likely interfered significantly with the measurement. We noticed that the fluorescence of SD medium lowered after growing cells in them (e.g. 15 % decrease after overnight growth). We located the background fluorescence of the medium to be largely due to two vitamins in the medium - riboflavin and folic acid. Because of this, we decided to repeat the measurements using low-fluorescent SD medium which excludes these two compounds.
In addition, we decided that lower H 2 O 2 induction concentrations should be used in improved tests; this way, we might find a concentration which doesn’t have as pronounced an effect on cell growth but would nevertheless induce fluorescence. We hoped to gain confirmation on the functionality of our TSA1 promoter this way, and to obtain information also on the other stress promoters.
Improved microplate reader fluorescence assays in SS328-leu, H 2 O 2 induction
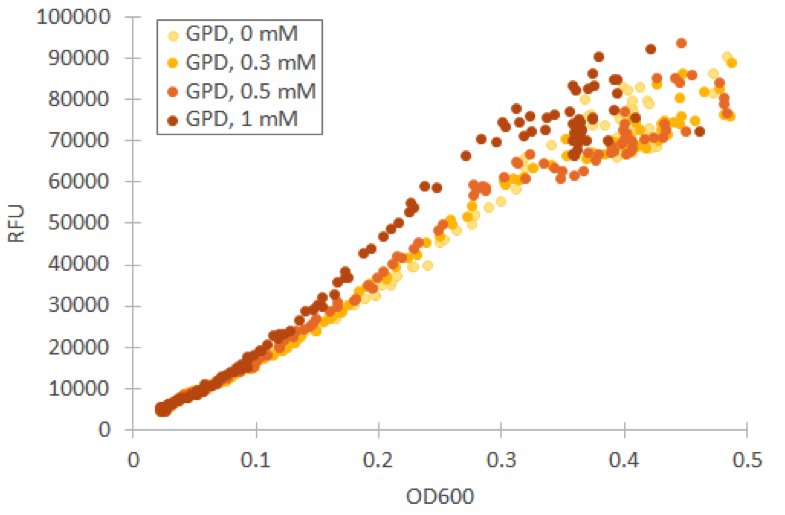
We repeated our microplate reader assay with low fluorescent growth medium and H 2 O 2 concentrations under 1 mM. In our tests with Venus under GPD1 promoter, we observed that even low concentrations have an effect on growth and fluorescence. However, especially at low cell densities, the ratio of fluorescence and OD600 remains almost constant (figure 9).
For our TSA1 construct, we obtained similar results as before (Figure 10); the absolute fluorescence was roughly equal in all induction concentrations under 1 mM. However, when normalized to OD, fluorescence seems to increase, with higher induction concentrations corresponding to higher fluorescence values.

Although the fluorescence levels produced by the CCP1 promoter were still very low compared to the TSA1 and GPD1 promoters, the absolute fluorescence increased significantly when induced with hydrogen peroxide. When normalizing the fluorescence values to cell density, the increases in fluorescence production were likewise progressively greater when going to higher induction concentrations (Figure 11).

Of the designed promoter constructs, the CTT1 promoter didn’t produce significant fluorescence in response to hydrogen peroxide. However, it produces a clear fluorescence signal which seems to correspond with the time when the culture reaches higher cell densities (Figure 12). This could correspond to reports by Gasch et al. (2003) about the CTT1 promoter being strongly induced by stationary phase.

Based on these results, it seemed like the TSA1 and CCP1 promoters were being induced by oxidative stress caused by hydrogen peroxide. However, hydrogen peroxide has a notable effect on cell growth, unlike microcystin, which we plan to use as our final inducer. This causes difficulties for quantifying induction. In addition, measurements done while growing yeast in a plate reader can be quite inaccurate, as yeast has a tendency to clump in the microtiter plate; when this happens, it causes the OD600 and fluorescence values of a measurement to be very scattered. Even when cell clumping isn’t too obvious, the measurements aren’t very precise.
To obtain more accurate results, and to confirm whether the apparent induction of the CCP1 and TSA1 promoters was real, we decided to measure fluorescence with a flow cytometer. This kind of a measurement is based on measuring the fluorescence produced by individual cells, which helps remove the biases of OD600 cell density measurements.
Fluorescence measurement with flow cytometry, H 2 O 2 induction
To obtain more reliable information of fluorescence produced by the stress promoters, we used a flow cytometer to measure the fluorescence of cells after growing the cultures in medium supplemented with hydrogen peroxide. Samples were collected after 2 and 4 hours of induction. Obtained fluorescence values are presented in figure 13.

As seen in figure 13, fluorescence values produced under GPD1 and TSA1 promoters are significantly higher than those produced under CCP1 and CTT1 promoters. CCP1 and CTT1 promoters seem to have a very low base level of expression. Notably, the fluorescence seems to increase with hydrogen peroxide induction also in the control (GPD1 promoter). This could be due to the fact that because hydrogen peroxide slows culture growth, a relatively bigger portion of the cells in the culture are older, meaning that they have have accumulated more fluorescence. Because a defined number of cells are measured to obtain the fluorescence distribution, slower culture growth can show up as this kind of a bias. To account for this, fluorescence values were divided by the respective uninduced values of each promoter (figure 14).

From figure 14, it can be seen that the relative increase in GPD1 fluorescence in higher hydrogen peroxide concentrations is significantly lower than for the other promoters. Using this as a control for the stress promoters, it would seem that all stress promoters produce fluorescence, although for the CCP1 and CTT1 promoters, a control promoter with a lower, comparable expression level would be more accurate. Such a control would also help account for the fact that the relative fluorescences are more easily affected by small biases when the fluorescence levels are lower. As for differences between the time points, the relative increase for the TSA1 and CTT1 promoters remain in the same order of magnitude between the two time points, whereas the increase for the CCP1 promoter is even greater with 4 h induction.
Although additional repeats would be helpful in confirming these results, and to obtain more accurate information about the relationship of induction concentration and fluorescence levels, the stress promoters seem to be working. Based on this result, we decided to try induce fluorescence with microcystin; although the detection is based on the elevated ROS levels caused by microcystin, and thus, hydrogen peroxide induction should work similarly, we wanted to try the functionality of the system with the exact intended inducer.
To be able to perform the microcystin induction, however, it was necessary to implement the VL3 QDR2 transporter in the same strain as the stress promoters. We conducted our work on the transporters in parallel with the stress promoters.
Preliminary catalase assays in VL3 and W303α
Our goal was to perform preliminary tests to see if our foam-based catalase assay could be used in the future to verify the functional integration of the MC-transporter from VL3 into our lab strain, W303α. The principle was to be able to compare the effect of different microcystin concentrations on catalase activity in VL3 and W303α. We later found out that our microcystin extract had been prepared incorrectly and hadn’t contained any microcystin, but we noticed that there was a clear, consistent difference in the catalase activity between the strains (figure 15).
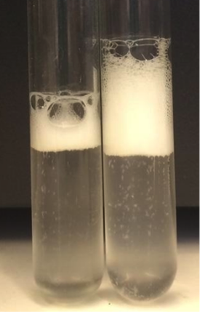
Because we repeated the catalase assay several times before we found out our microcystin extract hadn’t contained microcystin, we obtained a reasonable estimate for the margin of error in our test. For each time we performed the assay, we tested five different toxin concentrations for each strain, but being that there wasn’t any toxin, the foam levels should have been equal. An approximated margin of error calculated from these experiments was approximately 10%. This can be explained by slightly different tube diameters, pipetting inaccuracies, and inaccuracies in measuring the thickness and height of the foam layers; in particular, larger bubbles in the foam make measurements difficult.
Gibson assembly of transporter constructs
Before integrating our transporter constructs to the yeast genome, we had to assemble the constructs and amplify them in a plasmid. We ligated our ordered transporter insert gBlocks to a PCR-linearized pUG6 plasmid backbone using Gibson Assembly. Assembly products were amplified in E. coli, and verified with colony PCR and sequencing. We obtained colonies containing the correct insert from all our constructs except the transporter fused with mCherry, and the transporter with a N-terminal strep-tag - eventual sequencing results of mCherry construct proved that there had been a frameshift mutation in the sequenced colony, while in the construct with N-terminal strep tag, a wrong gBlock was used in the cloning. We decided not to try to obtain correct clones any more in order to save time to focus on our other experiments, and discontinued work on these constructs.
Transformation into W303α and verification of successful genome integration
Our plan was to insert the transporter constructs into S. cerevisiae genome (strain W303α) by replacing the corresponding transporter in W303α. Thus, we would make our lab yeast capable of importing microcystin. The correct integration to genome was verified by part colony PCR: we checked the integration site for correctly integrated new transporter, using primers targeting the old transporter as a negative control. This verification proved that the genome integration had been successful in all our constructs.
Transformation into SS328-leu and verification of successful genome integration
We found out about a mutation in stress response related genes in W303α which might interfere the proper function of our sensor. Because of this, we decided to transform everything into a new yeast strain (SS328-leu). Genome integration was again verified with two-part colony PCR as before.
Western blot for transporter expression verification
One of our transporter constructs had a Strep-tag in C-terminal end to help to detect expression and correct localization of the new transporters. Using strep-tactin conjugates, this verification can be done by Western blot. Figure 16 presents an example of Western blot visualized using Strep-Tactin alkaline phosphatase conjugate.

The transporter with strep-tag should have molecular weight of 44 kDa. As can be seen from figure 16, there is a band between 37 and 50 kDa which could be our transporter. However, as the same band exists also in the negative control, and in both cell fractions, it is likely something else, although we don’t know if the correct band is obscured under the background. It can be noted that there is a lot of background bands, which we tried to reduce by trying several modifications to our blot visualization procedure, but we didn’t obtain background reduction. This could be explained by the background resulting from specific staining of biotinylated proteins, which is can be an issue common with strep-tactin. As we didn’t have available biotin-blocking reagents, we couldn’t test this hypothesis, however.
We realized that the expression levels of our transporter are likely very low, being that it is a membrane protein expressed under its native promoter. For this reason, we reasoned that to detect whether the strep-tag-conjugated transporter is expressed and localized correctly in the new strain, we should overexpress it under a strong promoter. We decided to test this by cloning the construct into a plasmid under the GAL1 promoter.
Cloning transporter for overexpression
To enable overexpression of our strep tagged transporter, we successfully extracted it from the pUG6 plasmid, and simultaneously attached Gibson assembly overhangs to clone it into a restriction-enzyme linearized pRS415-GAL plasmid. We amplified and verified the new construct in E. coli and transformed it into SS328-leu. However, ultimately we didn’t have time to express the new construct to repeat the western blot and analyze the localization.
Transporter functionality testing with catalase assays
After transformation into SS328-leu, we performed functional tests in parallel with the expression tests. We performed our catalase assay for VL3, SS328-leu and three variants of SS328+QDR2-transporter, and found out that the base level of foam in both VL3 and SS328+QDR2-transporter is higher than in SS328-leu. Because we couldn’t see differences in foam layer sizes between different microcystin concentrations, we decided to focus on optimizing the assay conditions. Due to time constraints, we decided to limit our experiments to testing just one of our transporter variants. We opted for the transporter variant with a C-terminal Strep-tag, as we were doing simultaneous tests to try and verify its expression using Western blot.
We repeated the experiment using the chosen transporter strain, with VL3 and SS328-leu as the positive and negative controls. We tried the assay with different incubation times and cell densities. The observed foam base levels of the strains remained consistent in relation to each other in all experiments. Higher cell densities produced higher, more easily measurable foam layers. Figures 17 and 18 present the results of the assay for one of our tested conditions. These test conditions were similar to our reference article (Valério et al., 2014); we used the same toxin concentrations and the same MC incubation time. The obtained catalase activities for VL3 follow a similar trend as reported in the article.
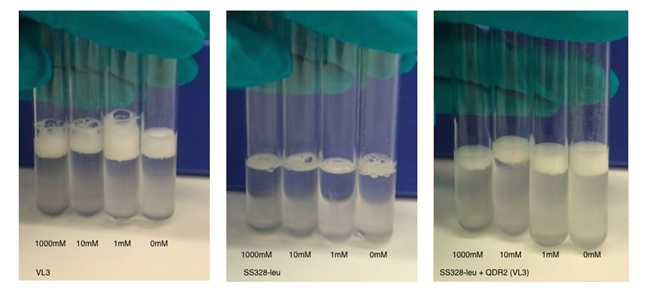

From these result,s we can see that microcystin doesn’t affect foam layer thickness in SS328-leu as we hypothesised. This is explained by the lack of the transporter and thus incapability to import toxin into cell. In VL3, the foam thicknesses behaved as expected between the different toxin concentrations, based on our reference article (Valério et al., 2014). Nevertheless, the variation between many of our samples is approximately same magnitude as the previously calculated error marginal estimate (10%). This indicated that the results are not very reliable, especially when not repeated multiple times; multiple repeats in the same conditions would also give a better estimate of the true error.
SS328-leu + QDR2 doesn’t seem to react to the different toxin concentrations the same way as VL3, as expected, but by comparing its behaviour to the same strain without the replaced transporter we can see that catalase activities are significantly higher in SS328-leu with VL3 QDR2 transporter. This phenotype change seems to indicate functionality of the integrated transporter. As SS328-leu catalase activities don’t seem follow the same trend as VL3, we would need more replicates of the test to see if the phenotype change truly translates to transporter functionality.
Transformation of stress promoters into SS328-leu containing microcystin transporter
Although we hadn’t obtained final verification on the functionality of the integrated transporters, we wanted to attempt microcystin induction of our stress promoters. To be able to induce the production of YFP using microcystin, we transformed our promoter plasmids to S. cerevisiae strain SS328-leu already containing the VL3 MC-transporter (QDR2) in its genome. The transformation was successful.
Fluorescence measurement with flow cytometry, microcystin induction:
Fluorescence was measured after incubating cell cultures for 2 hours with different concentrations of microcystin. For each promoter, cultures without the VL3 MC-transporter were used as negative controls. The obtained fluorescence values are presented in figure 19.
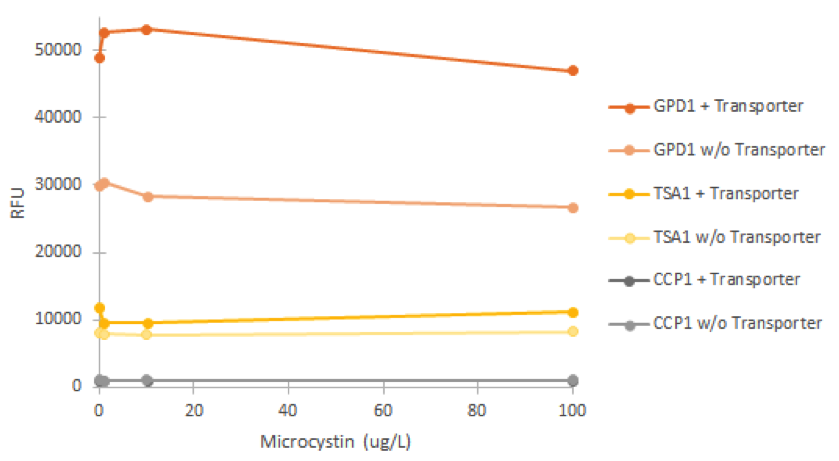
It is clear from figure 19 that none of the promoters was induced by the microcystin. In addition, it’s notable that the GPD1 promoter doesn’t show similar positive bias in higher concentrations as with hydrogen peroxide; this would make sense, as microcystin doesn’t negatively impact S. cerevisiae growth (Valério et al., 2014). A likely explanation for the failure of microcystin induction is that the microcystin transporter isn’t functional in the genome of SS328-leu. As we haven’t obtained confirmation for either the correct expression and localization of the transporter, or functionality, this seems a likely. It is also notable that the different strains of the same promoter showed different levels of fluorescence (e.g. most notably GPD1), but this could be explained e.g. by the noticeably different rate of growth of of the strains; although not affected by microcystin, cultures growing at a different rate might have cells with different amounts of older cells that have accumulated fluorescence, as described earlier, and this might be one factor affecting the difference.
Results - Degradation
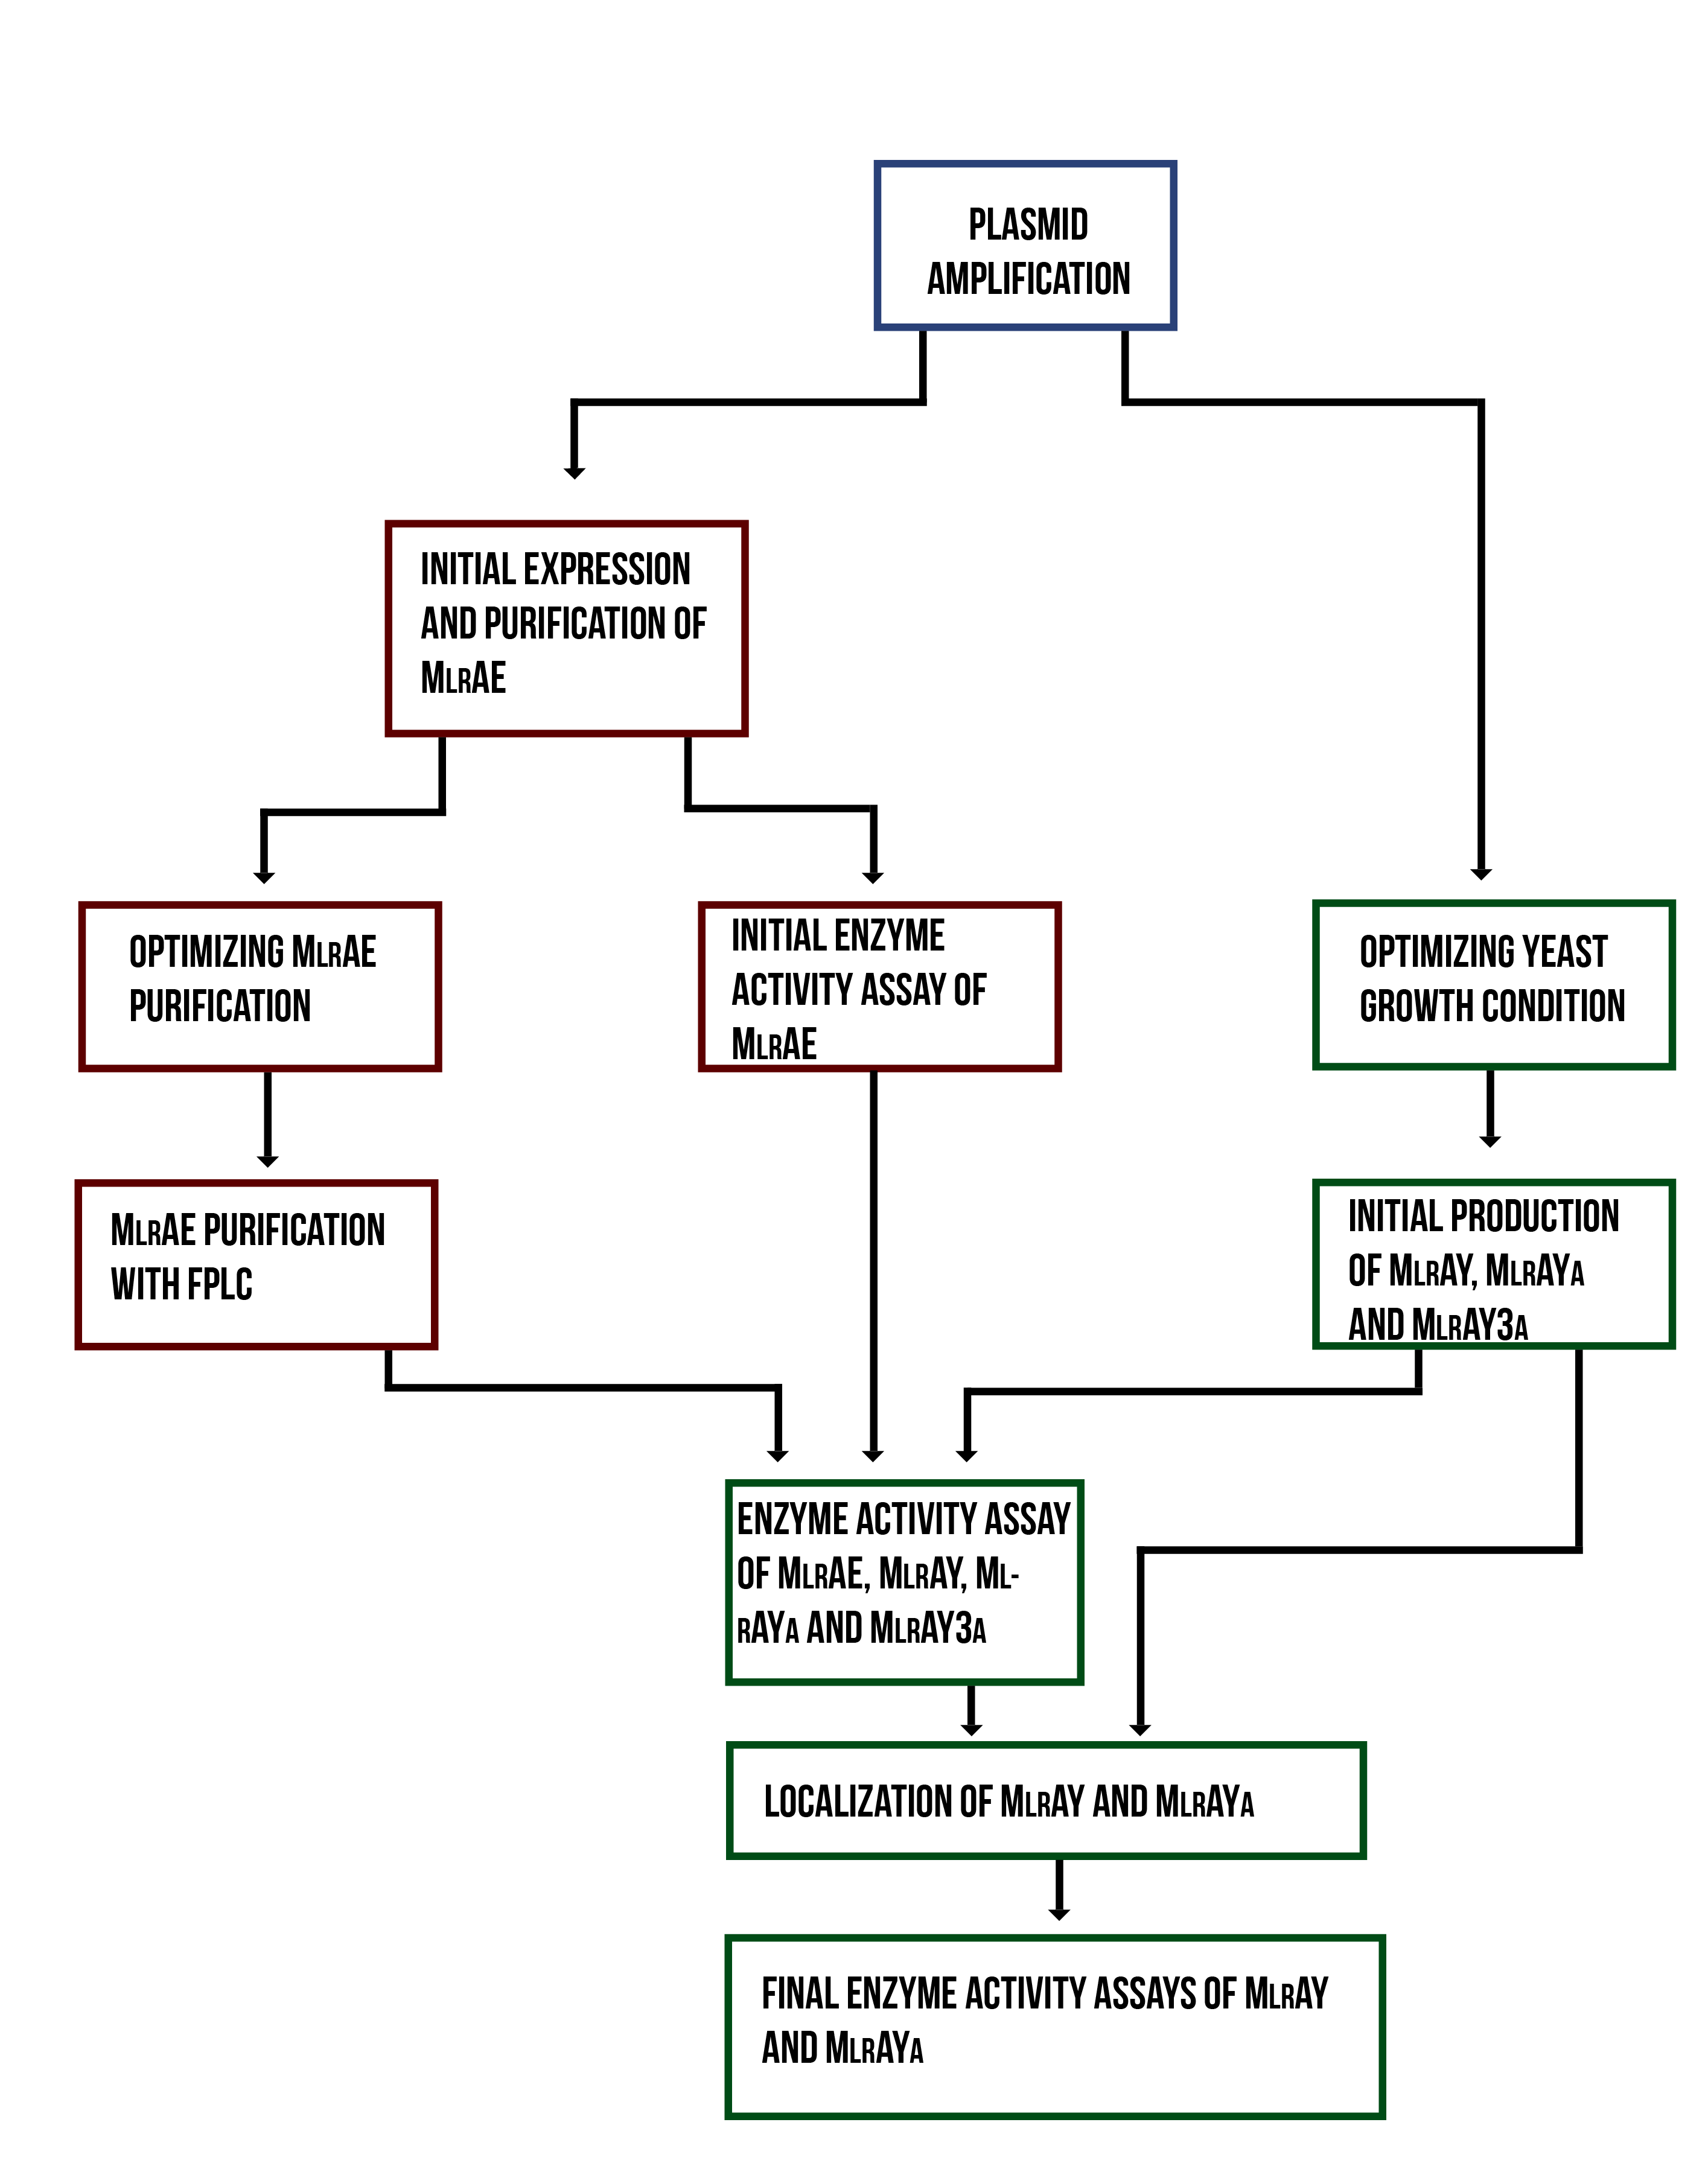
These are the results for the degradation part of our project from the lab.
For convenience, we have coded our four different MlrA constructs as follows:
MlrAE - MlrA produced in
E. coli
MlrAY - MlrA without mating factor alpha produced in
S. cerevisiae
MlrAYa - MlrA with mating factor alpha having only one propeptide sequence produced in
S. cerevisiae
MlrAY3a - MlrA with mating factor alpha having three propeptide sequences produced in
S. cerevisiae
Plasmid amplification
After we had planned our constructs for the degradation, we decided to use the services of GeneArt, since IDT was unable to produce the gBlocks we would have needed. This also meant that we wouldn’t need to spend time cloning the constructs into our plasmids, as GeneArt had a subcloning service we could use. For the cloning, we had to send them the plasmid backbones, so we amplified plasmids pET28a (for E.coli ) and pRS415-GAL (for S. cerevisiae ) with PCR and sent them to GeneArt. We received the cloned E. coli construct before the yeast ones, and decided to start working on it as it was our positive control, while we were waiting for the yeast constructs to arrive. With the positive control we were able to test some of our experiment setups before starting the actual work with the yeast versions.
Initial expression and purification of MlrAE
After transforming the plasmid we received from GeneArt into E. coli, our first goal when expressing MlrAE was to get a right sized protein produced and then purify it with its His-tag using Ni-NTA spin columns.
The expression was successful. The western blot (figure 20) shows that there is a band about 28 kDa in size, which corresponds to MlrA produced in E. coli in previous studies (Dziga et al., 2012). The calculated mass of MlrA is about 37 kDa, but when produced in E. coli, the actual size is only 28 kDa, presumably because of some protease activity specific to E. coli (Dziga et al., 2012). The enzyme is present in the soluble cytosol fractions (S2.1 and S2.2) and also in the cell debris fraction (P2). Localization in the cell debris would mean that the enzyme is either in the plasma membrane or as insoluble inclusion bodies in cytosol. It seems that there is leaky expression since there is a band also in the before induction sample (BI).

After successful production of MlrA in E. coli we wanted to purify it using the His-tag. We used commercial Ni-NTA spin columns designed for His-tagged protein purification (HisPur Ni-NTA Spin Columns from Thermo Fisher Scientific) to purify the supernatant fraction after cell lysis.
However, from the western blot (figure 21), we could see that there was no binding of the enzyme to the column as all of it came out in the flow through fractions and nothing in elution. Failure of Ni-NTA spin column purification had also been reported previously (Dziga et al., 2012).
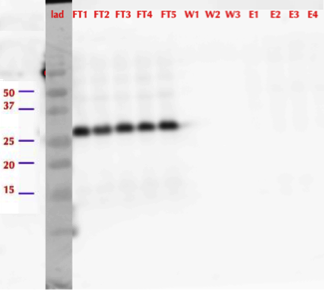
Even though we didn’t manage to purify the enzyme, we wanted to test if the MlrAE had activity.
Initial enzyme activity assay of MlrAE
For the first enzyme activity assay, our goal was to test our experimental setup and see if our positive control, MlrAE, had activity as it should, based on previous research (Dziga et al., 2012). In our assay, we prepared reaction mixtures of the enzyme and microcystin extract, and took samples at several timepoints. Our very first attempt was unsuccessful due to technical problems, but after optimizing the protocol with Matti Wahlsten, we repeated the experiment and got positive results. In this experiment we used the flow through fractions from the first purification attempt.
This time our experimental setup worked and our enzyme samples appeared to have activity (figure 22). There is clearly less microcystin in the enzyme samples than in the negative control, and the amount of microcystin diminishes as time goes by in the enzyme samples. These measurements were done mainly to verify that the setup had worked and that the enzyme had activity, so only a few samples were analysed to save time and resources.
In all of the enzyme activity graphs, the measurement points have been connected just to visualize the degradation of the enzyme, they are not trend lines and further conclusions based on those should not be made.
The sample analysis with LC-MS was done by Matti Wahlsten.
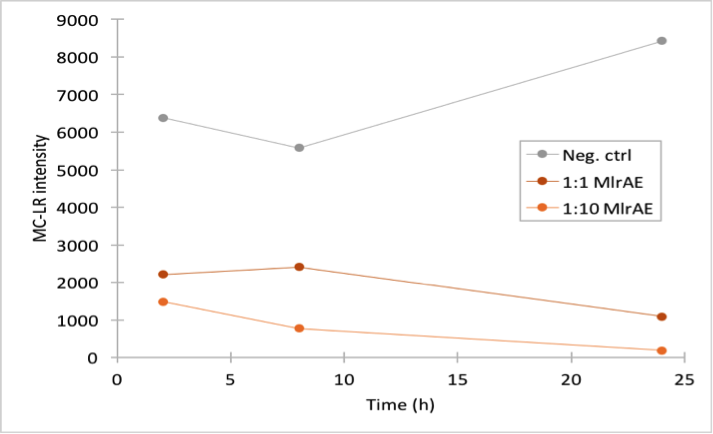
This experiment showed that we have a positive control for the activity measurements of our yeast constructs once we would start experimenting with them. Our next goal was to measure the activity of a more purified enzyme, so that we could at some point quantify the amount of protein we would produce.
Optimizing MlrAE purification
After unsuccessful purification using standard conditions for spin column purification, we decided to try two different conditions: one where the column equilibration buffer did not contain imidazole and the other with denaturing conditions. These both were suggested in the spin columns’ troubleshooting guide for when the protein doesn’t bind to the column. In a previous study scientists had tried to purify the MlrA with His-tag in denaturing conditions but without success (Dziga et al., 2012). However, since our enzyme was detectable with the anti-His antibody in the western blot, there was a chance that with one of these conditions the binding would also work.
After western blots (figures 23 and 24), we saw that the enzyme did not bind to the column in either condition and again came out in the flow through fractions.
As we had planned to purify the enzyme using the His-tag, we did not want to give up on it just yet. The same study mentioned above (Dziga et al., 2012), where they had tried to purify MlrA, showed that ion exchange chromatography had worked to some extent in purifying the enzyme. But before resorting to that technique, we wanted to try purifying with fast protein liquid chromatography (FPLC).
MlrAE purification with FPLC
As we did not have great success with the spin columns, we wanted to test purification with FPLC, which could provide better results. It seemed possible that the binding affinity of the MlrA His-tag to the Ni-NTA column was low, and purifying a larger quantity of the enzyme with FPLC would potentially allow us to see if at least some portion of the protein could be purified. The FPLC was done from the supernatant fraction after cell lysis. 30 ml of supernatant was purified using two stacked HisTrap FF Crude 5 ml columns.
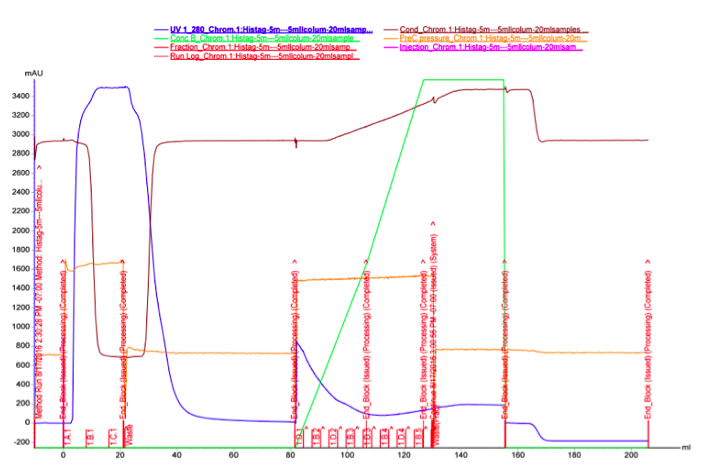

The UV reading in the FPLC chromatogram (Figure 25a, blue line) showed that there is a lot of proteins in the flow through fractions, as there should be (1.A.1-1.C.1). Proteins eluted out of the column after addition of elution buffer reside in fractions 1.D.1-1.B.4. It seems likely that many other proteins than the actual his-tagged enzyme bind to the column, as the UV reading spikes up right as the concentration of the elution buffer (Buffer B, green line); this would be explained by e.g. proteins containing multiple histidines, but no actual his-tag. A small hill (Figure 25b) in the eluted fractions might correspond to our protein. A very slow concentration gradient in the beginning of the elution might help resolve this peak. To confirm assumptions based on the chromatogram, and to see where our enzyme came out, western blots (figures 26 and 27) were done from these fractions. There coomassie blue stained gel is also in figure 8.
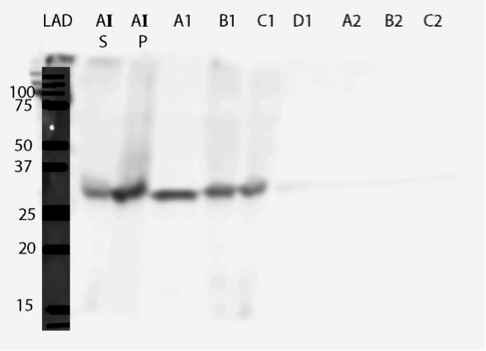
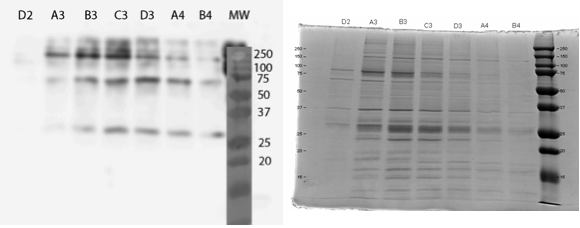
It seems that most of our enzyme came out again in the flow through fractions, but now there is also something in the elution fractions. There is also some other proteins eluted, as expected based on the chromatogram, but there are clearly bands of about 28 kDa in the elution fractions, C3 fraction having the biggest amount. This would correspond to the very small, almost non-existent peak in the figure 25b.The coomassie stained gel in figure 8 shows that there is also other protein in the elution fraction, which means that the protein was not completely purified. Still, with optimization, higher purities could likely be obtained.
This result confirms that with optimization of the purification conditions, the enzyme could likely be purified with this method. We were excited to find out if this purified enzyme had enzymatic activity!
Enzyme activity assay of MlrAE, MlrAY, MlrAYa and MlrAY3a
We did the final enzyme activity assay for MlrAE with the FPLC purified enzyme. It was done in conjunction with some MlrAs produced in yeast, which will be detailed later. We chose to use the 1.C.3 fraction which seemed to contain the biggest amount of MlrA based on figure 27.
The results (figure 28) showed that the purified MlrAE has activity, and it can be plotted nicely in the graph.
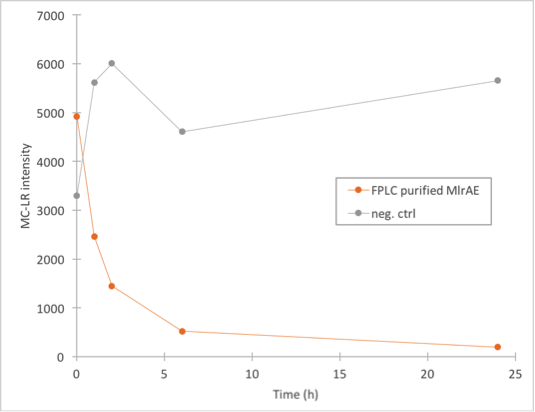
This meant that the positive control worked and provided a parallel for the yeast MlrAs.
Optimizing yeast growth conditions
After our yeast MlrA constructs arrived from GeneArt, we transformed them to S. cerevisiae strain SS328-leu. After this, we had to find out the best way to grow the yeast cells, in order to be able to induce protein production. We tested different growth conditions with different sugars, and different refreshing times. The goal was to have an optimal amount of cells for induction after refreshment.
We concluded that the best way to grow our yeast cells for protein production was to first grow a pre-culture overnight in 2% glucose, then expand it to the final culture volume and grow it on 0.5% glucose for 6 hours, and then induce the protein production by adding galactose to a final amount of 2%.
Initial production of MlrAY, MlrAYa and MlrAY3a
After finding the working expression conditions, the next step was to express all the yeast MlrA constructs to see where different constructs of the enzyme are roughly localised and to test the enzymes’ activities.
All constructs were expressed in similar conditions, but there were differences in the yields of different constructs, with MlrAYa having the highest yield and MlrAY3a having the lowest. We lysed the cells and centrifuged the lysates, after which we ran SDS-PAGE and did western blotting (figure 29).
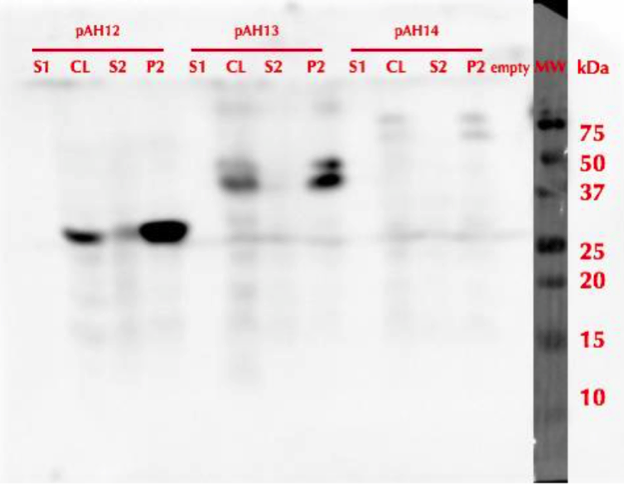
Based on our results the MlrAY (about 28 kDa) seems to localize mostly in the insoluble fraction (P2), but some of it seems to be also soluble (S2). Our hypothesis had been that the plain MlrAY would be soluble in the cytosol, but based on these results it is mostly insoluble, either as inclusion bodies or in the plasma membrane.
The MlrAYa seems to have the molecular mass of about 38 kDa which could correspond to the calculated size of the enzyme. This could hypothetically mean that the mating factor alpha has been cleaved off but it has protected the enzyme from being cleaved to 27 kDa. Our hypothesis was that this construct would localise in the plasma membrane and based on the blot, it seems that this might be correct.
The MlrAY3a is hardly detected, there is only faint bands of between 50 and 75 kDa bands. This could correspond to the enzyme with the mating factor alpha having the three propeptide parts since the calculated mass of that is about 62 kDa. Still, it is weird that they haven’t been cleaved off, which might have been the situation on the MlrAYa construct. Our hypothesis was that the construct would be secreted, so that it would be detected from the S1 fraction. However, this was not the case, which wasn’t very surprising since assuming that MlrA truly is a membrane protein, secretion would be unlikely.
To get more clues about the enzymes localization in the insoluble fraction, enzyme activity assays were performed.
Enzyme activity assay of MlrAE, MlrAY, MlrAYa and MlrAY3a
As our different enzyme yeast constructs all localised in the cell debris fraction, we wanted to find out if the enzymes were active (which would mean that they would probably be in the plasma membranes) or inactive (probably in the inclusion bodies). Although it seemed that there could be some MlrAY in the soluble fraction (figure 30), we did this experiment only with the insoluble fraction. This experiment would also show if our enzyme activity measurement setup works for the yeast constructs. We had the FPLC purified MlrAE as our positive control as discussed earlier, and as the negative control we had the same control as before, MC in PBS with 0.1% BSA.
The samples were once again analysed with LC-MS by Matti Wahlsten.
The results (figure 30) came back looking quite interesting. All of the yeast constructs showed that the amount of MC would stay at a similar level for the whole duration of the experiment. There had been some problems when taking the 0h samples, which could explain the differences in 0h values as they should have been about the same in theory.
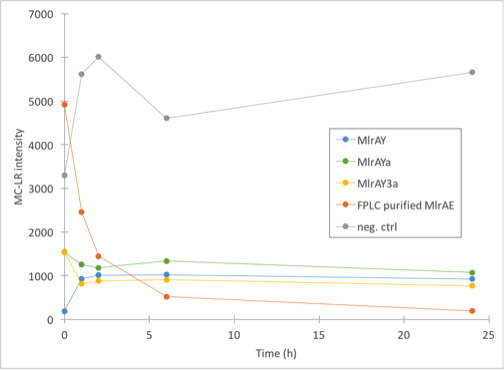
Our conclusions were that either there was very little microcystin in the yeast MlrA reactions to begin with, and that the enzymes are inactive, which would explain why the amount of microcystin doesn’t diminish. The other possibility is that the enzymes are, in fact, very active and that they degrade all the toxin they can before the first timepoint (1h), after which there isn’t any more toxin to degrade.
Eager to find out which one was the case, we wanted to repeat the enzyme activity measurements.
Localization MlrAY and MlrAYa
The inconclusive results from the enzyme activity assay prompted us to do the final MlrA experiments in order to find out if the enzymes have activity and also to pinpoint where exactly the enzymes localize in the yeast cells. We decided to do these experiments only with MlrAY and MlrAYa, as MlrAY3a had resulted in such low yield and unexpected size, suggesting there might be some problems with it.
The results (figure 31) show that the enzymes are again localised in the insoluble fraction P2, and this time there isn’t anything in the soluble fraction from MlrAY. After refolding, only MlrAY is detected (S3 and P3). This might be because we had problems with the dialysis as the dialysis bags might have leaked on both times we tried to do it.

The results point to the conclusion that the enzymes are localized in the plasma membrane, at least for MlrAY. For MlrAYa, it is still too inconclusive to say what would be the final conclusion.
Final enzyme activity assay of MlrAY and MlrAYa
To verify our hypothesis, which was that the enzymes were localised in the plasma membrane and have high activity instead of being inactive in the form of inclusion bodies, we did the final activity measurements. Our assumption was that if the enzymes have activity, they most probably are localized in the plasma membrane in an active form.
To ensure the reliability of our measurements and minimize the effect of chance, the final activity measurements were done with triplicates of each reaction, using three different dilutions of the enzymes, and with more timepoints at the beginning of the experiment. This time we also had a second negative control, which was lysed S. cerevisiae SS328-leu without the MlrA construct plasmids, in addition to the normal negative control. All of this resulted in 144 samples altogether, which we then filtered and gave to Matti Wahlsten for LC-MS analysis. Once again we were very grateful for Matti’s help.
The results (figure 32 and 33) showed that our enzymes are active. There are some anomalies in the 30 min samples; this could be because we had to take so many samples, and by the time we finished sampling 0 min samples, it was almost time to start collecting 15 min samples, and after we were done with those, it was time for 30 min samples. Other than that the results seem to be as expected: the negative control has the highest amount of MC-LR and the amount stayed roughly the same during the whole experiment. For both constructs, the 1:10 dilution had the highest level of degradation, while the 1:1000 had the least activity. It also seems that MlrAY was more effective at degradation than MlrAYa.
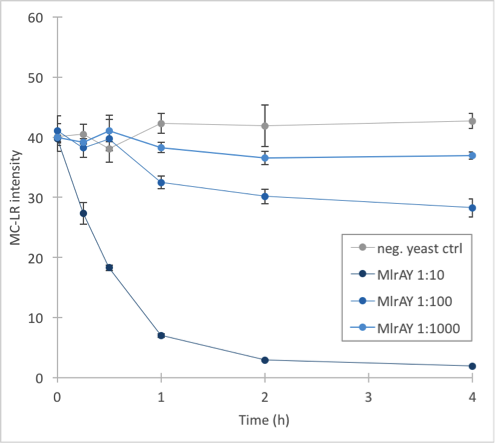
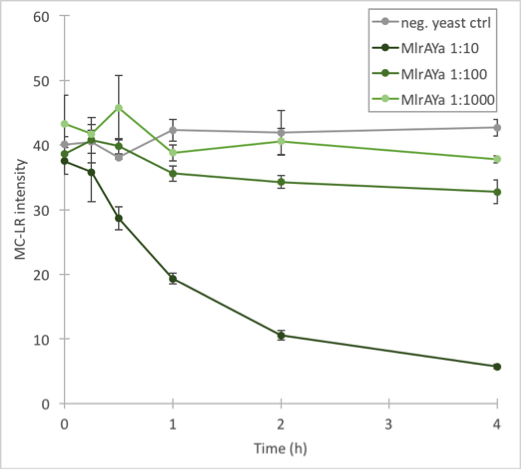
Also, these results suggest that in the previous enzyme activity assays, there was in fact microcystin initially, but it had been degraded so quickly by the enzyme that the timepoints we had chosen could not reflect this. Along with the localization experiment, these results point towards the fact that the enzymes are active membrane proteins.
Protocols and lab book
If you are interested in viewing or using our protocols, more details on how we have conducted our experiments, or want to view our lab notes, email us at team [a] aaltohelsinki . com .
“ Our assumption was that if the enzymes have activity, they are most probably localized in the plasma membrane in an active form ”
Safety
Safety is essential when working in a laboratory. This section describes the safety practices related to our laboratory work. For information on the broader safety and ethical questions related to our project, see our human practices page.
Our work mainly involved safety level 1 practices; all organisms that we used belong to biosafety level 1. We worked with Escherichia coli strains TOP10 and BL21(DE3), and Saccharomyces cerevisiae strains W303α, VL3, and SS328-leu. The genes we used in our constructs include a gene for yellow fluorescent protein, three promoter regions for oxidative stress inducible genes, gene coding for a specific membrane transporter and gene coding for microcystinase enzyme. The fluorescent protein is derived from the jellyfish Aequorea victoria , promoter regions and transporter are from S. cerevisiae , and microcystinase is derived from Sphingomonas sp. ACM-3962. None of these organisms are pathogenic so our genetically modified organisms also belong to safety level 1.
We have received safety training when starting work in the lab. All of our lab team had also previous experience with laboratory work; we had learned principles of safe laboratory practices through laboratory courses and work experience. Our safety training has included topics such as disposal of GMO waste, chemical work, emergency prevention and what to do in case of emergency.
As our project dealt with the detection and degradation of microcystin, we received additional training for its safe handling from experts working with this compound on a regular basis in the cyanobacteria research group of the University of Helsinki. The microcystin we handled is a cell extract from freeze-dried Anabaena strain 90, a biosafety level 1 organism according to DSMZ, and the concentrations of microcystin we worked with are very low. According to the University of Helsinki’s Biosafety Officer, such concentrations can even be poured down the drain without first neutralizing them. Samples with higher concentrations of microcystin were only necessary for the enzyme activity analyses, which were run by the cyanobacteria research group in the facilities of University of Helsinki. Thus, the disposal of samples with higher concentrations of microcystin was also handled there.
“ Our safety training has included topics such as disposal of GMO waste, chemical work, emergency prevention and what to do in case of emergency ”
References
Chorus I, Bartram J, eds., 1999. Toxic Cyanobacteria in Water: A Guide to Their Public Health Consequences, Monitoring, and Management. London: E & FN Spon.
Dziga, D., Wladyka, B., Zielińska, G., Meriluoto, J., Wasylewski, M., 2012. Heterologous expression and characterisation of microcystinase (2012) Toxicon, 59 (5), pp. 578-586.
Edwards C, Graham D, Fowler N, Lawton LA., 2008. Biodegradation of microcystins and nodularin in freshwaters. Chemosphere, 73(8), pp. 1315-1321.
Gasch, A.P., Spellman. P.T., Kao, C.M., Carmel-Harel, O., Eisen, M.B., Storz, G., Botstein, D., Brown, P.O., 2000. Genomic expression programs in the response of yeast cells to environmental changes. Mol Biol Cell., 11, pp. 4241–4257.
Iwase T, Tajima A, Sugimoto S, Okuda KI, Hironaka I, Kamata Y, Takada K, Mizunoe Y., 2013. A simple assay for measuring catalase activity: a visual approach. Sci. Rep. 3, pp. 3081.
Valério, E., Vilares, A., Campos, A., Pereira, P. and Vasconcelos, V., 2014. Effects of microcystin-LR on Saccharomyces cerevisiae growth, oxidative stress and apoptosis. Toxicon, 90, pp.191-198.
Veal, E.A., Ross, S.J., Malakasi, P., Peacock, E. and Morgan, B.A., 2003. Ybp1 is required for the hydrogen peroxide-induced oxidation of the Yap1 transcription factor. Journal of Biological Chemistry, 278(33), pp.30896-30904.
WHO, 2003. Cyanobacterial toxins: Microcystin-LR in drinking-water. Background document for preparation of WHO Guidelines for drinking-water quality. Geneva, World Health Organization (WHO/SDE/WSH/03.04/57).

