Difference between revisions of "Team:Slovenia/Mechanosensing/Gas vesicles"
| Line 1: | Line 1: | ||
| + | {{Slovenia}} | ||
| + | <html> | ||
| + | <head> | ||
| + | <title>Hardware</title> | ||
| + | <link rel="stylesheet" | ||
| + | href="//2016.igem.org/Team:Slovenia/libraries/semantic-min-css?action=raw&ctype=text/css"> | ||
| + | <script type="text/javascript" | ||
| + | src="//2016.igem.org/Team:Slovenia/libraries/semantic-min-js?action=raw&ctype=text/javascript"></script> | ||
| + | <link rel="stylesheet" type="text/css" | ||
| + | href="//2016.igem.org/Team:Slovenia/libraries/custom-css?action=raw&ctype=text/css"> | ||
| + | <script type="text/javascript" | ||
| + | src="//2016.igem.org/Team:Slovenia/libraries/custom-js?action=raw&ctype=text/javascript"></script> | ||
| + | <script type="text/javascript" | ||
| + | src="//2016.igem.org/Team:Slovenia/libraries/zitator-js?action=raw&ctype=text/javascript"></script> | ||
| + | <script type="text/javascript" | ||
| + | src="https://2016.igem.org/Team:Slovenia/libraries/bibtexparse-js?action=raw&ctype=text/javascript"></script> | ||
| + | </head> | ||
| + | <body> | ||
| + | |||
| + | |||
| + | <div id="example"> | ||
| + | <div class="pusher"> | ||
| + | <div class="full height"> | ||
| + | <div class="banana"> | ||
| + | <a href="//2016.igem.org/Team:Slovenia"> | ||
| + | <img class="ui medium sticky image" src="//2016.igem.org/wiki/images/d/d1/T--Slovenia--logo.png"> | ||
| + | </a> | ||
| + | <div class="ui vertical sticky text menu"> | ||
| + | <a class="item" href="//2016.igem.org/Team:Slovenia/Protease_signaling/Logic"> | ||
| + | <i class="chevron circle left icon"></i> | ||
| + | <b>Logic</b> | ||
| + | </a> | ||
| + | <a class="item" href="#ach" style="margin-left: 10%"> | ||
| + | <i class="selected radio icon"></i> | ||
| + | <b>Achievements</b> | ||
| + | </a> | ||
| + | <a class="item" href="#mot" style="margin-left: 10%"> | ||
| + | <i class="selected radio icon"></i> | ||
| + | <b>Motivation</b> | ||
| + | </a> | ||
| + | <a class="item" href="#mod" style="margin-left: 10%"> | ||
| + | <i class="selected radio icon"></i> | ||
| + | <b>MODUSON</b> | ||
| + | </a> | ||
| + | <a class="item" href="#rel" style="margin-left: 10%"> | ||
| + | <i class="selected radio icon"></i> | ||
| + | <b>Realizations</b> | ||
| + | </a> | ||
| + | <a class="item" href="#eva" style="margin-left: 10%"> | ||
| + | <i class="selected radio icon"></i> | ||
| + | <b>Evaluation</b> | ||
| + | <br /> | ||
| + | <b style="margin-left: 12%">of the device</b> | ||
| + | </a> | ||
| + | <a class="item" href="#set" style="margin-left: 10%"> | ||
| + | <i class="selected radio icon"></i> | ||
| + | <b>Set-up</b> | ||
| + | <br /> | ||
| + | <b style="margin-left: 12%">for experiments</b> | ||
| + | </a> | ||
| + | <a class="item" href="//2016.igem.org/Team:Slovenia/Model"> | ||
| + | <i class="chevron circle right icon"></i> | ||
| + | <b>Modeling of ultrasound</b> | ||
| + | </a> | ||
| + | |||
| + | </div> | ||
| + | |||
| + | </div> | ||
| + | <div class="article" id="context"> | ||
| + | <!-- menu goes here --> | ||
| + | <!-- content goes here --> | ||
| + | <div class="main ui citing justified container"> | ||
| + | <div> | ||
| + | <h1 class="ui left dividing header"><span id="ach" class="section"> </span>Ultrasound | ||
| + | controlling device</h1> | ||
| + | <div class="ui segment" style="background-color: #ebc7c7; "> | ||
| + | <ul> | ||
| + | <li><b>Implementation of 90 W ultrasonic amplifier for pulsed cells stimulation.</b> | ||
| + | <li><b>Optimization of developed system in a given frequency range around 310 kHz.</b> | ||
| + | <li><b>User friendly controlling interface of device.</b> | ||
| + | <li><b>Capability of providing 7 kPa of pressure 4 mm from ultrasonic transducer.</b> | ||
| + | </ul> | ||
| + | </div> | ||
| + | </div> | ||
| + | <div class="ui segment"> | ||
| + | <h4><span id = "mot" class = "section"> </span></h4> | ||
| + | <p>The ultrasound (US) wave interacts with tissue and reflects back depending on the | ||
| + | properties of the tissues such as velocity of sound in the tissue and its density, which | ||
| + | can be modeled using <a href="https://2016.igem.org/Team:Slovenia/Model">wave | ||
| + | equation.</a> Higher frequencies have better resolution (shorter wavelengths) but | ||
| + | cannot penetrate as deep into the tissues. In diagnostic ultrasound frequencies above 1 | ||
| + | MHz are used. For better tissue penetration frequencies of interest for our purposes are | ||
| + | between 0.3 to 1 MHz yielding sufficient resolution and penetration at the same time | ||
| + | <x-ref>Speed2001</x-ref> | ||
| + | . Latest studies show that it is possible to use pulsed ultrasound for neurostimulation, | ||
| + | ultrasound therapy such as treatment of pain and the repair of various tissues, however | ||
| + | without clear knowledge which receptors or cell types we are targeting, and what is the | ||
| + | mechanism of the ultrasound stimulation effects | ||
| + | <x-ref>Vasquez2014</x-ref> | ||
| + | . | ||
| + | </p> | ||
| + | </div> | ||
| + | |||
| + | |||
| + | <h1><span class="section"> </span>Results</h1> | ||
| + | <div class="ui segment"> | ||
| + | |||
| + | <div> | ||
| + | <h3><span id="mod" class="section"> </span>MODUSON - Generating ultrasonic power | ||
| + | pulses for cell stimulation</h3> | ||
| + | <p>For the simple setup of the ultrasonic stimulation of cells we initially used ultrasonic | ||
| + | baths (<ref>1</ref>) that are used to clean the laboratory equipment, small devices to clean jewelry or | ||
| + | ultrasonic cell disruptors, which however offer little control over the intensity, | ||
| + | frequency or pulse shapes and numbers of repetitions and are not appropriate to monitor | ||
| + | activation of mechanosensors under the fluorescence microscope. However, one member of | ||
| + | the team is a student of electrical engineering and this was the right challenge for | ||
| + | him. | ||
| + | </p> | ||
| + | <div style="float:right; width:100%"> | ||
| + | <figure data-ref="1"> | ||
| + | <img src=" https://static.igem.org/mediawiki/2016/3/32/T--Slovenia--5.1.15.png"> | ||
| + | <figcaption><b>Different experiment configurations.</b><br/> | ||
| + | <p style="text-align:justify">Testing homogeneity of pressure in each well with a plate immersed in the | ||
| + | ultrasonic bath. | ||
| + | </p> | ||
| + | </figcaption> | ||
| + | </figure> | ||
| + | </div> | ||
| + | |||
| + | <p>For the generation of specific shapes of ultrasound pulses researchers usually use a | ||
| + | setup consisting of two signal generators (one for switching on and off the train of US | ||
| + | pulses and the other one to produce the sinusoidal signal of suitable frequency). This | ||
| + | signal is further fed to the amplifier and then to the ultrasonic transducer. | ||
| + | Furthermore, an ultrasonic sensor is required to evaluate and control the magnitude of | ||
| + | the ultrasound. Usually a hydrophone is used in combination with an amplifier and an | ||
| + | oscilloscope. This setup is complex to establish and difficult to use. Therefore, the | ||
| + | goal of a part of the iGEM 2016 group (student of electrical engineering) was to develop | ||
| + | a device (named Moduson), which would be capable of providing appropriate signals | ||
| + | required to perform specific ultrasonic experiments in a single apparatus and as such | ||
| + | easy to use. The research and development of the device was performed in the Laboratory | ||
| + | for Bioelectromagnetics at the Faculty of Electrical Engineering, University of Ljubljana under | ||
| + | the supervision of prof. dr. Dejan Križaj and a company Noeto.</p> | ||
| + | |||
| + | </div> | ||
| + | <div> | ||
| + | <h3><span id="rel" class="section"> </span>The basic requirements for the device and | ||
| + | realizations</h3> | ||
| + | |||
| + | <h5>Adaptability</h5> | ||
| + | |||
| + | <p>The device should be designed to be as flexible as possible in order to be capable of | ||
| + | delivering a wide range and different shapes of stimulation signals to stimulate cells | ||
| + | under the microscope, cells in a petri dish, cells in a microplate immersed into a bath | ||
| + | and to stimulate animals. In order to fulfill this requirement we selected a dedicated | ||
| + | embedded measurement card Red Pitaya acting as an embedded computer. This embedded | ||
| + | device is based on Linux system and can be completely customized to the user’s needs. | ||
| + | Furthermore, it can be Wi-Fi controlled so the final application is based on modern | ||
| + | programming tools such as JavaScript, C++, HTML, etc. The final application is basically | ||
| + | a web page, accessible with any computer capable of the Wi-Fi connection. This | ||
| + | application gives complete control of all stimulation parameters and operation of the | ||
| + | device. Another advantage of the platform used is its capability of simple integration with | ||
| + | Matlab through so-called SCPI commands, usually used in the instrumentation for easy | ||
| + | control and data acquisition making the device perfect research and development tool. | ||
| + | Simple example of SCPI commands in Matlab for pulsed bursts is shown below:</p> | ||
| + | <div style="float:left; width:100%"> | ||
| + | <figure> | ||
| + | <img src=" https://static.igem.org/mediawiki/2016/b/b6/T--Slovenia--5.1.5.png"> | ||
| + | </figure> | ||
| + | </div> | ||
| + | |||
| + | |||
| + | <p style="clear:both">On the | ||
| + | <ref>2</ref> | ||
| + | a typical sequence of a stimulation signal constructed of a set number of sine waves of | ||
| + | defined frequency that is repeated for required number of times with selected repetition | ||
| + | period is shown. | ||
| + | </p> | ||
| + | <div style="float:left; width:100%"> | ||
| + | <figure data-ref="2"> | ||
| + | <img src="https://static.igem.org/mediawiki/2016/6/6e/T--Slovenia--5.1.6.png "> | ||
| + | <figcaption><b>Signal parameters.</b><br/> | ||
| + | <p style="text-align:justify">Parameters that can be set for a typical stimulation signal. | ||
| + | </p> | ||
| + | </figcaption> | ||
| + | </figure> | ||
| + | </div> | ||
| + | |||
| + | <h5>Simple graphical user interface</h5> | ||
| + | <p>Users of the device do not need to be computer experts and do not need to have knowledge | ||
| + | on the signal generators, amplifiers and oscilloscopes. Therefore, the motivation was to | ||
| + | design and develop a simple user-friendly graphical interface with all the relevant | ||
| + | parameters that need to be set in order to run the experiments from the Web page. To | ||
| + | accomplish this, dedicated software was written that enables users to design and run the | ||
| + | experiment and evaluate the results. <ref>3</ref> presents a developed user interface. On the right side (US burst settings -> STIMULATION | ||
| + | PULSE) we can set parameters, such as the amplitude of the signal, frequency and number | ||
| + | of sine waves. Below these settings, repetition parameters of the signal (PULSE | ||
| + | REPETITION) such as the number of pulse repetitions and its frequency can be set. When | ||
| + | all parameters are set, the signal can be previewed by clicking the SHOW BURST button. | ||
| + | The pulse sequence is initiated with the START button. The acquired signal from | ||
| + | hydrophone is seen on the main plot. At the top of the interface, there are options to | ||
| + | export the image of a graph and csv data of the acquired signal. Chosen values of | ||
| + | parameters can also be saved for the next use of the device. | ||
| + | </p> | ||
| + | <div style="margin-left:auto; margin-right:auto; width:50%"> | ||
| + | <figure data-ref="3"> | ||
| + | <img onclick="resize(this);" | ||
| + | src=" https://static.igem.org/mediawiki/2016/b/bf/T--Slovenia--5.1.7.png"> | ||
| + | <figcaption><b>Application interface.</b><br/> | ||
| + | <p style="text-align:justify"> Web based interface used for setting of the signal parameters. | ||
| + | </p> | ||
| + | </figcaption> | ||
| + | </figure> | ||
| + | </div> | ||
| + | |||
| + | <h5 style="clear:both">Signal amplifier</h5> | ||
| + | |||
| + | <div style="width: 33%; float:left;"> | ||
| + | <figure data-ref="4"> | ||
| + | <img class="ui medium image" onclick="resize(this);" | ||
| + | src=" https://static.igem.org/mediawiki/2016/7/7e/T--Slovenia--5.1.8.png"> | ||
| + | <figcaption><b>Simulation scheme.</b><br/> | ||
| + | <p style="text-align:justify">Scheme used in LT Spice simulations. | ||
| + | </p> | ||
| + | </figcaption> | ||
| + | </figure> | ||
| + | </div> | ||
| + | <div style="width: 33%; float:left;"> | ||
| + | <figure data-ref="5"> | ||
| + | <img class="ui medium image" onclick="resize(this);" | ||
| + | src="https://static.igem.org/mediawiki/2016/3/3b/T--Slovenia--5.1.9.png "> | ||
| + | <figcaption><b>Model of transducer.</b><br/> | ||
| + | <p style="text-align:justify">Equivalent model of ultrasonic transducer based on a BVD model. | ||
| + | </p> | ||
| + | </figcaption> | ||
| + | </figure> | ||
| + | </div> | ||
| + | <div style="width: 33%; float:left;"> | ||
| + | <figure data-ref="6"> | ||
| + | <img class="ui medium image" onclick="resize(this);" | ||
| + | src=" https://static.igem.org/mediawiki/2016/0/0a/T--Slovenia--5.1.10.png"> | ||
| + | <figcaption><b>Moduson.</b><br/> | ||
| + | <p style="text-align:justify">Constructed device with a simple interface; an ON/OFF button, a BNC output for | ||
| + | the transducer and a button to trigger stimulation pulses. The pulses can also | ||
| + | be triggered directly through the Web interface. | ||
| + | </p> | ||
| + | </figcaption> | ||
| + | </figure> | ||
| + | </div> | ||
| + | <p style="clear:both;"></p> | ||
| + | <p>We built the circuitry with real elements on a prototype board where several additional | ||
| + | alterations were required, as the real elements do not have ideal characteristics as the | ||
| + | ones included in the simulation. Another challenge was the design of a suitable | ||
| + | transformer to increase the voltage amplitude of the signal. The transformer is also | ||
| + | required to operate as an impedance transformer. Lowering impedance of the ultrasonic | ||
| + | transducer enables higher current levels and consequently higher power values.</p> | ||
| + | <p>Once a suitable signal is generated, it needs to be amplified from a signal level | ||
| + | (amplitude of 2 V) to several hundred volts or even above 1000 V, which poses a serious | ||
| + | engineering challenge. For this purpose, we first designed a circuitry on a conceptual | ||
| + | level and simulated it with LT Spice (<ref>4</ref>). In the simulations an electric model of a transducer was considered as a combination | ||
| + | of capacitors, inductors and resistors wired in parallel (<ref>5</ref>). This model enables simulation of ultrasonic transducers with several resonant | ||
| + | frequencies. Simulations show that our device can reach the power at transducer around | ||
| + | 92W, which is close to the measured 86W in the real system. | ||
| + | </p> | ||
| + | </div> | ||
| + | <div> | ||
| + | <h3><span id="eva" class="section">nbsp;</span>Evaluation of the developed device | ||
| + | </h3> | ||
| + | |||
| + | <p>Functionality of the Moduson was first tested without any connected load. <ref>7</ref> presents a typical output measured with an oscilloscope for a signal of frequency 310 | ||
| + | kHz. | ||
| + | </p> | ||
| + | |||
| + | <div style="float:left; width:100%"> | ||
| + | <figure data-ref="7"> | ||
| + | <img src="https://static.igem.org/mediawiki/2016/5/58/T--Slovenia--5.1.2.png "> | ||
| + | <figcaption><b>Typical output signal without load.</b><br/> | ||
| + | <p style="text-align:justify">Amplitude of acquired signal depends on the winding of transformer. | ||
| + | </p> | ||
| + | </figcaption> | ||
| + | </figure> | ||
| + | </div> | ||
| + | |||
| + | <p>Developed device was tested with several transducers with resonance frequencies ranging | ||
| + | from 300 kHz up to 1 MHz. Most experiments were performed with an unfocused transducer | ||
| + | Olympus V318-SU (<ref>8</ref>) with a waterproof case, allowing it to be used in <i>in vitro</i> experiments. | ||
| + | </p> | ||
| + | |||
| + | <div style="float:left; width:50%"> | ||
| + | <figure data-ref="8"> | ||
| + | <img src="https://static.igem.org/mediawiki/2016/f/fe/T--Slovenia--5.1.11.png "> | ||
| + | <figcaption><b>Ultrasound transducer V318-SU.</b><br/> | ||
| + | <p style="text-align:justify">Handy waterproof case allowed us to use the transducer in most experiments. | ||
| + | </p> | ||
| + | </figcaption> | ||
| + | </figure> | ||
| + | </div> | ||
| + | <div style="float:left; width:50%"> | ||
| + | <figure data-ref="9"> | ||
| + | <img src="https://static.igem.org/mediawiki/2016/2/2e/T--Slovenia--5.1.4.png "> | ||
| + | <figcaption><b>Electric power of ultrasonic transducer before and after | ||
| + | compensation.</b><br/> | ||
| + | <p style="text-align:justify">Electrical power with compensation was significantly increased with serial | ||
| + | compensation.</p> | ||
| + | </figcaption> | ||
| + | </figure> | ||
| + | </div> | ||
| + | |||
| + | |||
| + | <p> | ||
| + | <ref>9</ref> | ||
| + | presents measured electric power using the transducer V318-SU. After partial | ||
| + | compensation of reactive part, the measured real power reached 86 W. This result | ||
| + | exceeded the set requirements. | ||
| + | </p> | ||
| + | |||
| + | <p>With compensation, voltage was considerably increased at contacts of transducer and | ||
| + | reached around 900Vpp as shown in <ref>10</ref>. | ||
| + | </p> | ||
| + | <div style="float:left; width:100%"> | ||
| + | <figure data-ref="10"> | ||
| + | <img src="https://static.igem.org/mediawiki/2016/3/3d/T--Slovenia--5.1.1.png "> | ||
| + | <figcaption><b>Voltage at input of a transducer V318-SU.</b><br/> | ||
| + | <p style="text-align:justify">Transducer requires relative high voltage to operate properly. | ||
| + | </p> | ||
| + | </figcaption> | ||
| + | </figure> | ||
| + | </div> | ||
| + | |||
| + | <p>We measured the emitted ultrasonic pressure indirectly with a hydrophone RP 31l shown in <ref>11</ref>. This hydrophone has a sensitivity of 50mV/100kPa at a frequency of 310kHz. It can be | ||
| + | connected directly to the oscilloscope input to detect the pressure of the ultrasonic | ||
| + | waves. Pressure measured 4 mm from the transducer reached 7 kPa which gives the | ||
| + | intensity of 33 W/cm<sup>2<sup>.</p> | ||
| + | |||
| + | <div style="float:left; width:50%"> | ||
| + | <figure data-ref="11"> | ||
| + | <img src="https://static.igem.org/mediawiki/2016/e/e5/T--Slovenia--5.1.12.png "> | ||
| + | <figcaption><b>Hydrophone RP 31l.</b><br/> | ||
| + | <p style="text-align:justify">Calibrated hydrophone used to measure pressure. | ||
| + | </p> | ||
| + | </figcaption> | ||
| + | </figure> | ||
| + | </div> | ||
| + | |||
| + | <p style="clear:both">Example of an output signal measured by a hydrophone is presented in | ||
| + | the <ref>12</ref>. | ||
| + | <p> | ||
| + | |||
| + | <div style="float:left; width:100%"> | ||
| + | <figure data-ref="12"> | ||
| + | <img src=" https://static.igem.org/mediawiki/2016/b/b8/T--Slovenia--5.1.3.png"> | ||
| + | <figcaption><b>Voltage signal detected using the hydrophone.</b><br/> | ||
| + | <p style="text-align:justify">With calibration data, we can determine pressure which corresponds to acquired | ||
| + | voltage amplitude. | ||
| + | </p> | ||
| + | </figcaption> | ||
| + | </figure> | ||
| + | </div> | ||
| + | <p style="clear:both;"> | ||
| + | </p> | ||
| + | </div> | ||
| + | <div> | ||
| + | <h3><span id="set" class="section">nbsp;</span>Set-up for experiments with ultrasonic | ||
| + | pulses</h3> | ||
| + | |||
| + | <p>After we successfully tested the Moduson device, we aimed to design measurement set-up | ||
| + | for stimulation of cells cultivated in plastic 6-well plates, which allows insertion of | ||
| + | the ultrasound transducer. In order to ensure repeatable conditions in every experiment | ||
| + | the position of a transducer was fixed with a suitable holder. Several models of holders | ||
| + | were designed for different experimental configurations and a 3D-printer was used to | ||
| + | fabricate a dedicated holder (<ref>13</ref>). This allowed positioning of the transducer at the fixed height above the bottom of a | ||
| + | well (<ref>14</ref>), which was crucial due to the series of maximal and minimal intensity of generated | ||
| + | pressure. | ||
| + | <p> | ||
| + | <div style="float:left; width:50%"> | ||
| + | <figure data-ref="13"> | ||
| + | <img src="https://static.igem.org/mediawiki/2016/8/88/T--Slovenia--5.1.13.png "> | ||
| + | <figcaption><b>3D printer.</b><br/> | ||
| + | <p style="text-align:justify">Printing a holder for the ultrasonic transducer that we used for a 6-well plate. | ||
| + | </p> | ||
| + | </figcaption> | ||
| + | </figure> | ||
| + | </div> | ||
| + | |||
| + | <div style="float:left; width:50%"> | ||
| + | <figure data-ref="14"> | ||
| + | <img src=" https://static.igem.org/mediawiki/2016/e/ea/T--Slovenia--5.1.14.png"> | ||
| + | <figcaption><b>Ultrasound based experiments on the microscope.</b><br/> | ||
| + | <p style="text-align:justify">Ultrasonic transducer with a 3D printed holder in a 6-well plate. | ||
| + | </p> | ||
| + | </figcaption> | ||
| + | </figure> | ||
| + | </div> | ||
| + | |||
| + | <p style="clear:both;"> | ||
| + | </p> | ||
| + | </div> | ||
| + | </div> | ||
| + | |||
| + | </div> | ||
| + | </div> | ||
| + | </div> | ||
| + | </div> | ||
| + | </div> | ||
| + | <div> | ||
| + | <a href="//igem.org/Main_Page"> | ||
| + | <img border="0" alt="iGEM" src="//2016.igem.org/wiki/images/8/84/T--Slovenia--logo_250x250.png" width="5%" style = "position: fixed; bottom:0%; right:1%;"> | ||
| + | </a> | ||
| + | </div> | ||
| + | </body> | ||
| + | </html> | ||
{{Slovenia}} | {{Slovenia}} | ||
<html> | <html> | ||
Revision as of 17:07, 18 October 2016
Ultrasound controlling device
- Implementation of 90 W ultrasonic amplifier for pulsed cells stimulation.
- Optimization of developed system in a given frequency range around 310 kHz.
- User friendly controlling interface of device.
- Capability of providing 7 kPa of pressure 4 mm from ultrasonic transducer.
The ultrasound (US) wave interacts with tissue and reflects back depending on the
properties of the tissues such as velocity of sound in the tissue and its density, which
can be modeled using wave
equation. Higher frequencies have better resolution (shorter wavelengths) but
cannot penetrate as deep into the tissues. In diagnostic ultrasound frequencies above 1
MHz are used. For better tissue penetration frequencies of interest for our purposes are
between 0.3 to 1 MHz yielding sufficient resolution and penetration at the same time
Results
MODUSON - Generating ultrasonic power pulses for cell stimulation
For the simple setup of the ultrasonic stimulation of cells we initially used ultrasonic baths (1) that are used to clean the laboratory equipment, small devices to clean jewelry or ultrasonic cell disruptors, which however offer little control over the intensity, frequency or pulse shapes and numbers of repetitions and are not appropriate to monitor activation of mechanosensors under the fluorescence microscope. However, one member of the team is a student of electrical engineering and this was the right challenge for him.

Testing homogeneity of pressure in each well with a plate immersed in the ultrasonic bath.
For the generation of specific shapes of ultrasound pulses researchers usually use a setup consisting of two signal generators (one for switching on and off the train of US pulses and the other one to produce the sinusoidal signal of suitable frequency). This signal is further fed to the amplifier and then to the ultrasonic transducer. Furthermore, an ultrasonic sensor is required to evaluate and control the magnitude of the ultrasound. Usually a hydrophone is used in combination with an amplifier and an oscilloscope. This setup is complex to establish and difficult to use. Therefore, the goal of a part of the iGEM 2016 group (student of electrical engineering) was to develop a device (named Moduson), which would be capable of providing appropriate signals required to perform specific ultrasonic experiments in a single apparatus and as such easy to use. The research and development of the device was performed in the Laboratory for Bioelectromagnetics at the Faculty of Electrical Engineering, University of Ljubljana under the supervision of prof. dr. Dejan Križaj and a company Noeto.
The basic requirements for the device and realizations
Adaptability
The device should be designed to be as flexible as possible in order to be capable of delivering a wide range and different shapes of stimulation signals to stimulate cells under the microscope, cells in a petri dish, cells in a microplate immersed into a bath and to stimulate animals. In order to fulfill this requirement we selected a dedicated embedded measurement card Red Pitaya acting as an embedded computer. This embedded device is based on Linux system and can be completely customized to the user’s needs. Furthermore, it can be Wi-Fi controlled so the final application is based on modern programming tools such as JavaScript, C++, HTML, etc. The final application is basically a web page, accessible with any computer capable of the Wi-Fi connection. This application gives complete control of all stimulation parameters and operation of the device. Another advantage of the platform used is its capability of simple integration with Matlab through so-called SCPI commands, usually used in the instrumentation for easy control and data acquisition making the device perfect research and development tool. Simple example of SCPI commands in Matlab for pulsed bursts is shown below:

On the 2 a typical sequence of a stimulation signal constructed of a set number of sine waves of defined frequency that is repeated for required number of times with selected repetition period is shown.

Parameters that can be set for a typical stimulation signal.
Simple graphical user interface
Users of the device do not need to be computer experts and do not need to have knowledge on the signal generators, amplifiers and oscilloscopes. Therefore, the motivation was to design and develop a simple user-friendly graphical interface with all the relevant parameters that need to be set in order to run the experiments from the Web page. To accomplish this, dedicated software was written that enables users to design and run the experiment and evaluate the results. 3 presents a developed user interface. On the right side (US burst settings -> STIMULATION PULSE) we can set parameters, such as the amplitude of the signal, frequency and number of sine waves. Below these settings, repetition parameters of the signal (PULSE REPETITION) such as the number of pulse repetitions and its frequency can be set. When all parameters are set, the signal can be previewed by clicking the SHOW BURST button. The pulse sequence is initiated with the START button. The acquired signal from hydrophone is seen on the main plot. At the top of the interface, there are options to export the image of a graph and csv data of the acquired signal. Chosen values of parameters can also be saved for the next use of the device.

Web based interface used for setting of the signal parameters.
Signal amplifier

Scheme used in LT Spice simulations.

Equivalent model of ultrasonic transducer based on a BVD model.

Constructed device with a simple interface; an ON/OFF button, a BNC output for the transducer and a button to trigger stimulation pulses. The pulses can also be triggered directly through the Web interface.
We built the circuitry with real elements on a prototype board where several additional alterations were required, as the real elements do not have ideal characteristics as the ones included in the simulation. Another challenge was the design of a suitable transformer to increase the voltage amplitude of the signal. The transformer is also required to operate as an impedance transformer. Lowering impedance of the ultrasonic transducer enables higher current levels and consequently higher power values.
Once a suitable signal is generated, it needs to be amplified from a signal level (amplitude of 2 V) to several hundred volts or even above 1000 V, which poses a serious engineering challenge. For this purpose, we first designed a circuitry on a conceptual level and simulated it with LT Spice (4). In the simulations an electric model of a transducer was considered as a combination of capacitors, inductors and resistors wired in parallel (5). This model enables simulation of ultrasonic transducers with several resonant frequencies. Simulations show that our device can reach the power at transducer around 92W, which is close to the measured 86W in the real system.
nbsp;Evaluation of the developed device
Functionality of the Moduson was first tested without any connected load. 7 presents a typical output measured with an oscilloscope for a signal of frequency 310 kHz.

Amplitude of acquired signal depends on the winding of transformer.
Developed device was tested with several transducers with resonance frequencies ranging from 300 kHz up to 1 MHz. Most experiments were performed with an unfocused transducer Olympus V318-SU (8) with a waterproof case, allowing it to be used in in vitro experiments.

Handy waterproof case allowed us to use the transducer in most experiments.

Electrical power with compensation was significantly increased with serial compensation.
9 presents measured electric power using the transducer V318-SU. After partial compensation of reactive part, the measured real power reached 86 W. This result exceeded the set requirements.
With compensation, voltage was considerably increased at contacts of transducer and reached around 900Vpp as shown in 10.

Transducer requires relative high voltage to operate properly.
We measured the emitted ultrasonic pressure indirectly with a hydrophone RP 31l shown in 11. This hydrophone has a sensitivity of 50mV/100kPa at a frequency of 310kHz. It can be connected directly to the oscilloscope input to detect the pressure of the ultrasonic waves. Pressure measured 4 mm from the transducer reached 7 kPa which gives the intensity of 33 W/cm2.

Calibrated hydrophone used to measure pressure.
Example of an output signal measured by a hydrophone is presented in the 12.

With calibration data, we can determine pressure which corresponds to acquired voltage amplitude.
nbsp;Set-up for experiments with ultrasonic pulses
After we successfully tested the Moduson device, we aimed to design measurement set-up for stimulation of cells cultivated in plastic 6-well plates, which allows insertion of the ultrasound transducer. In order to ensure repeatable conditions in every experiment the position of a transducer was fixed with a suitable holder. Several models of holders were designed for different experimental configurations and a 3D-printer was used to fabricate a dedicated holder (13). This allowed positioning of the transducer at the fixed height above the bottom of a well (14), which was crucial due to the series of maximal and minimal intensity of generated pressure.

Printing a holder for the ultrasonic transducer that we used for a 6-well plate.

Ultrasonic transducer with a 3D printed holder in a 6-well plate.
Enhanced mechanosensitivity by gas vesicles expressed in mammalian cells
For activation of mechanoreceptors TRPC1 or MscS, a high-power ultrasound wave (900 Vpp) is required. Our aim was to improve responsiveness of cells to respond to the lower power of ultrasound as this would increase the selectivity, avoiding stimulation of endogenous channels and prevent cell damage. We decided to test gas-filled lipid microbubbles, since it has been reported that microbubbles can amplify the ultrasonic signal
Microbubbles are small gas-filled lipid vesicles which are used as contrast agents in medicine. Their size is in the range of micrometers. They work by resonating in an ultrasound beam, rapidly contracting and expanding in response to the pressure changes of the sound wave
Results
Lipid microbubbles

(A) Schematic of a cell with an increased sensitivity to ultrasound stimulation in the presence of microbubbles. When exposed to mechanical stimuli the microbubbles contract and expand, resulting in activation of mechanosensitive channels on the cell membrane. (B) Mixed size distribution of lipid microbubbles was obtained. Stabilized lipid microbubbles were prepared by sonication and detected by microscopy.
Properties of microbubbles for example rigidity, are affected by the composition of the lipid membrane and the gas core. We prepared our lipid microbubbles from a mixture of DSPC:DSPE. Before sonication we added gas perfluorohexane (as described in the Protocols section), which facilitates compression and expansion of the microbubbles upon ultrasound stimulation (3.3.1.A). A heterogeneous mixture of microbubbles in the range from 5 to 100 µm in size were generated by this procedure (3.3.1.B). Microbubbles are most effective in the size range corresponding to the resonance frequency of the ultrasound. However, care has to be taken in the applied energy to prevent cavitation, that can sonoporate cell membranes.
Application of microbubbles to cells expressing mechanosensitive channel MscS significantly improved calcium influx after mechanical stimulation using low-power ultrasound wave (450 Vpp) (3.3.2.). The same experimental setup was used a previusly described in ultrasound stimulation of mechanosensitive channels.
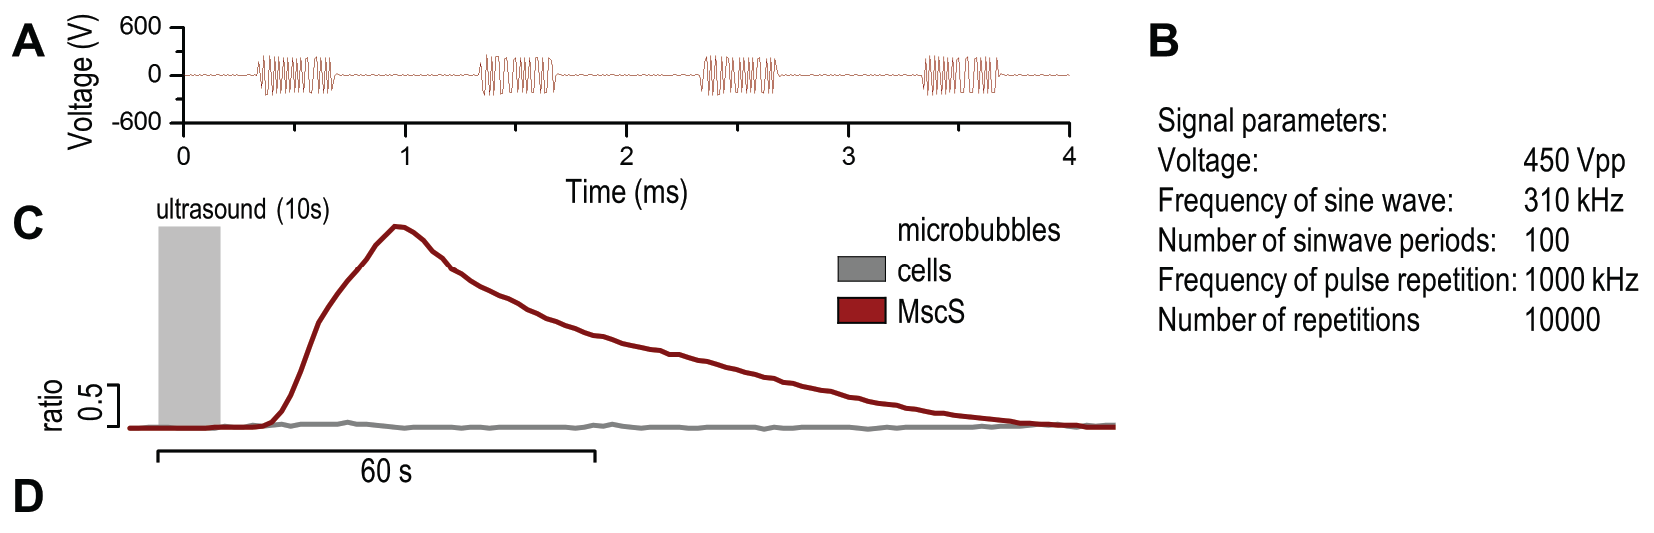
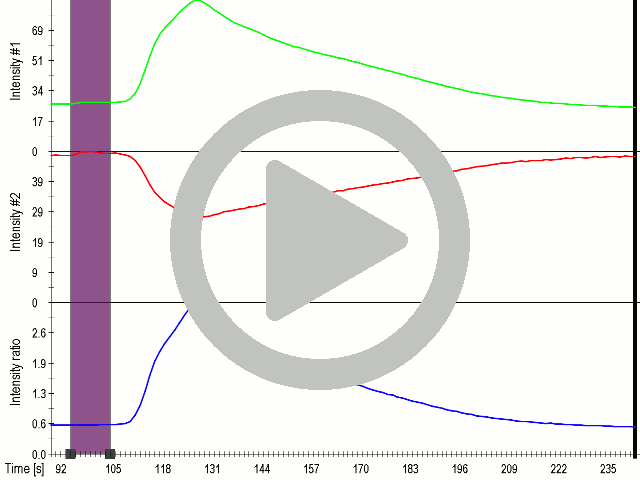


(A) Presentation of the ultrasound stimulation sequence and (B) signal parameters used for the stimulation. (C, D) Lipid microbubbles strongly enhanced response of cells expressing MscS channels. HEK293 cells expressing MscS channels were stimulated with ultrasound for 10 s and calcium influx was recorded in real time (D) using a confocal microscope. For comparison cells without ectopic MscS were used. Fluo-4 (D, green line) and Fura Red dyes (D, red line) were used for ratiometric calcium imaging. (D) Ratio (blue line) was calculated from fluorescence intensities of Fura Red and Fluo-4 using CaPTURE.
However, there are some drawbacks related to the use of lipid microbubbles, as their delivery requires injection into the selected tissue. Additionally lifetime of lipid microbubbles is limited in the tissue to tens of minutes and they need to be prepared freshly at least once a week.
Gas vesicles
To overcome the described drawback we thought of alternative options. One idea that initially looked too crazy to work was to use genetically encoded gas vesicles
that are produced in bacteria. Bacterial gas vesicles have been used as contrasting agents for ultrasonography in animals

When exposed to mechanical stimuli the gas vesicles contract and expand, resulting in activation of mechanosensitive channels on the cell membrane.
Gas vesicles are stable gas-filled structures, which provide buoyancy in a wide variety of planktonic prokaryotes
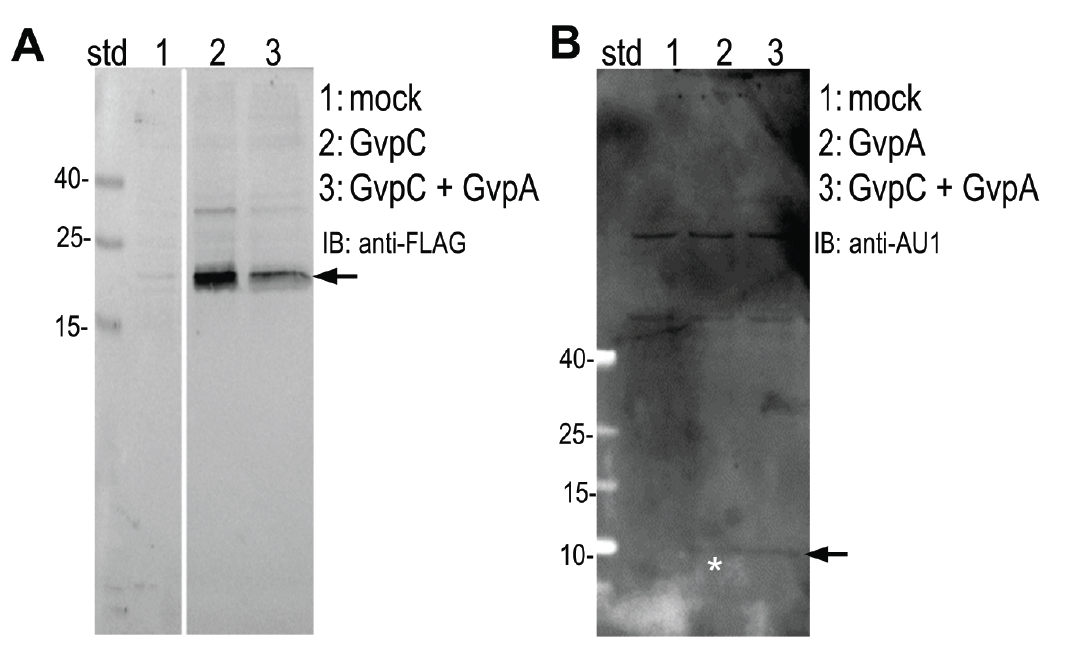
Expression of (A) GvpC and (B) GvpA protein was determined by Western blot using (A) anti-FLAG and (B) anti-AU1, respectively. Expected sizes (marked with arrow) are 22,5 kDa and 8,5 kDa for GvpC and GvpA, respectively.
HEK293 cells were transfected with plasmids expressing both gas vesicle forming proteins, GvpA and GvpC. We could obtain GvpC from the Registry and added to its characterization, while the plasmid for GvpA could not be recovered and its coding sequence was synthesized using mammalian codon usage. Expression of both proteins was confirmed by the western blot (3.3.3.) and colocalization was observed by confocal microscopy (3.3.4.).
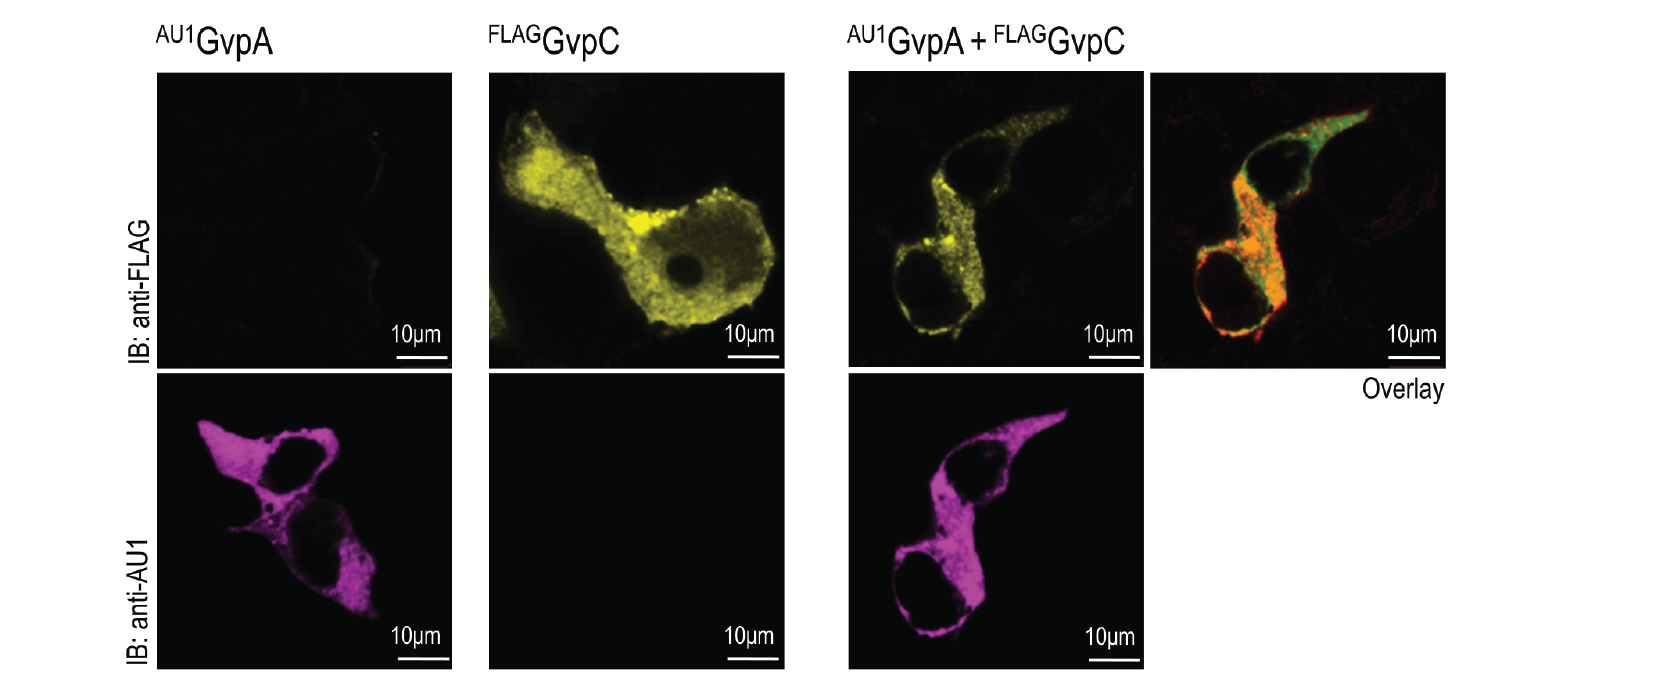
HEK293T cells were transfected with plasmids encoding gas vesicle proteins, GvpA and GvpC. 24 h after transfection cells were fixed, permeabilized and immunostained with anti-FLAG (upper row) and anti-AU1 (lower row). Both GvpA and GvpC are located in cytosol as expected. Colocalization is presented in the overlay picture.
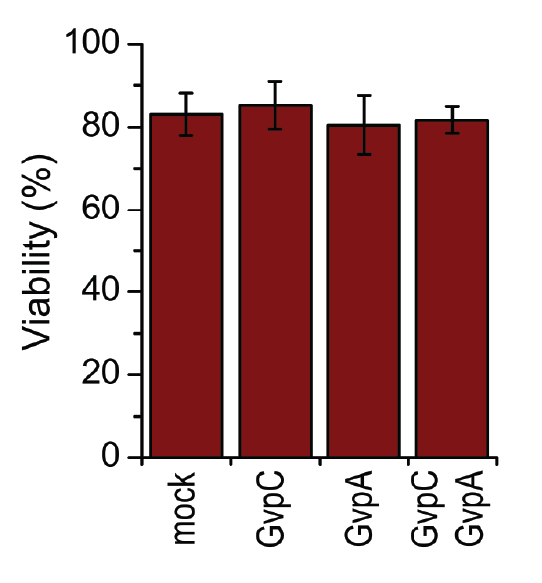
HEK293 cells were transfected with GvpA and/or GvpC. 24 h after the transfection viability of cells was measured using trypan blue.
A toxicity test was performed in order to ensure that gas vesicles were not toxic to mammalian cells. 3.3.5. shows that the viability of cells was not altered when expressing gas vesicle forming proteins.
HEK293 cells expressing gas vesicle-forming proteins exhibited increased sensitivity to ultrasound stimulation, even in the absence of exogenous mechanosensitive channels (3.3.6.), which was most likely due to activation of the endogenous mechanosensitive channels in mammalian cells.

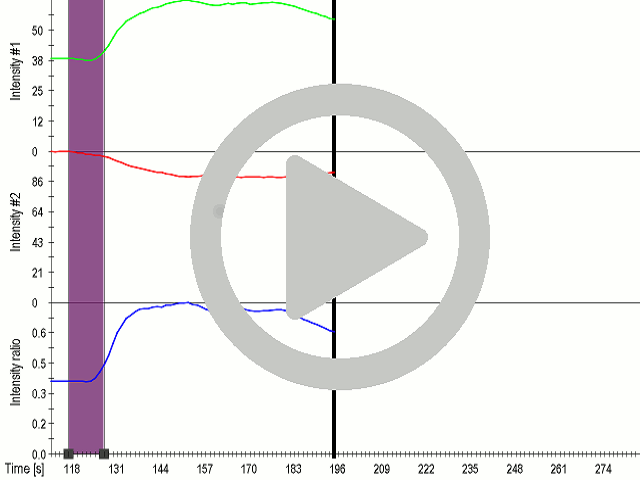


(A) Presentation of the ultrasound stimulation sequences for 900 Vpp (red) and 450 Vpp (grey) ultrasound waves and (B) signal parameters used for stimulation. (C, D) Genetically encoded gas vesicle-forming proteins greatly increased cell response at high-power (900 Vpp) in comparison to low-power ultrasound (450 Vpp). HEK293 cells expressing Gvps were stimulated with ultrasound for 10 s and calcium influx was recorded in real time (D). Fluo-4 (D, green line) and Fura Red dyes (D, red line) were used for ratiometric calcium imaging. (D) Ratio (blue line) was calculated from fluorescence intensities of Fura Red and Fluo-4 using CaPTURE.
In order to maximize the sensitivity of cells to ultrasound, we transfected cells with a combination of mechanosensitive channel MscS and gas vesicle-forming proteins. By decreasing the power of ultrasound stimulation we demonstrated that cells expressing a combination of both ectopic channels and gas vesicles were activated as a result of the ultrasound stimulation (3.3.7.).

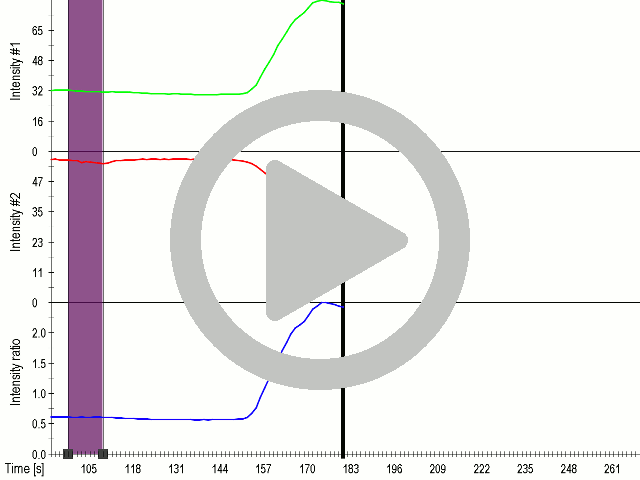


(A) Presentation of the ultrasound stimulation sequence and (B) signal parameters used for stimulation. (C, D) Co-expression of mechanosensitive channels and gas vesicle-forming proteins increased sensitivity to ultrasound stimulation in comparison to the cells without exogenous mechanosensitive channels. HEK293 cells expressing gas vesicle-forming proteins GvpA and GvpC with or without MscS were stimulated with ultrasound for 10 s and calcium influx was recorded in real time (D) using a confocal microscope. Changes in fluorescence intensity of calcium indicators Fluo-4 (green line) and Fura Red (red line) are shown. (D) Ratio (blue line) was calculated from fluorescence intensities of Fura Red and Fluo-4 using CaPTURE.
To prove that calcium influx was the mediator of activation of mechanosensitive channels, we used an inhibitor of ion channels gadolinium (Gd3+), which has a similar ionic radius, but a higher charge density to Ca2+. By blocking the pore of the channel it acts as an general inhibitor of calcium ion channels

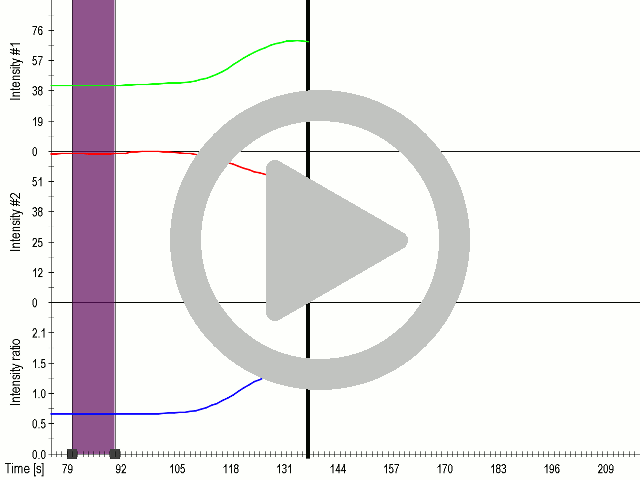


(A) Presentation of the ultrasound stimulation sequence and (B) signal parameters used for stimulation. (C, D) Gadolinium inhibits activation of mechanosensitive ion channels after ultrasound stimulation. HEK293 cells expressing gas vesicle-forming proteins GvpA and GvpC with or without MscS were treated with gadolinium (red line) or not (grey line) and stimulated with ultrasound for 10 s and calcium influx was recorded in real time (D). Changes in fluorescence intensity of calcium indicators Fluo-4 (green line) and Fura Red (red line) are shown. (D) Ratio (blue line) was calculated from fluorescence intensities of Fura Red and Fluo-4 using CaPTURE.
This is the first time demonstration that that gas vesicle-forming proteins can be expressed in human cells and that they improve the sensitivity of mechanosensitive channels for ultrasound. Moreover when the gas vesicle-forming proteins were co-expressed with ectopic ion channels the calcium influx could be achieved with low-power ultrasound stimulation.
Ultrasound is a type of mechanical stimulus, therefore we reasoned that cells might exhibit response also to other types of stimulus such as the touch. The next task was to couple the response of mechanosensitive channels to the mediator of signaling or to the genetically encoded reporter. Mediator of this activation are Ca2+ ions, which are sensed by different cellular proteins and which have been in the literature detected by several designed sensors. The mechanosensing device was then coupled to the calcium split luciferase reporter based on M13 and calmodulin or can be coupled to the protease split system and response of cells was determined against mechanical stimulus in a Touchpaint implementation.