m |
|||
| Line 117: | Line 117: | ||
<p class="justify" style="font-size:19px;"> | <p class="justify" style="font-size:19px;"> | ||
<b> | <b> | ||
| − | + | We created devices that produce YFP in response to oxidative stress | |
</b> | </b> | ||
</p> | </p> | ||
| Line 159: | Line 159: | ||
<p class="justify" style="font-size:19px;"> | <p class="justify" style="font-size:19px;"> | ||
<b> | <b> | ||
| − | We managed to produce a phenotype change in yeast by replacing QDR2 transporter | + | We managed to produce a phenotype change in yeast by replacing the QDR2 transporter |
</b> | </b> | ||
</p> | </p> | ||
| Line 197: | Line 197: | ||
<br/> | <br/> | ||
<p class="justify" style="font-size:19px;"> | <p class="justify" style="font-size:19px;"> | ||
| − | The specific functions of VL3’s QDR2 transporter besides the capability to transport microcystin aren’t known, but it is possible that it does not have a similar | + | The specific functions of VL3’s QDR2 transporter besides the capability to transport microcystin aren’t known, but it is possible that it does not have a similar hydrogen peroxide antiporter function as the corresponding transporter in our lab strain (SGD ID: S000001383). In this case it could be that replacing the transporter allows more hydrogen peroxide to accumulate inside the cell, which results in a higher catalase response. This might be the case if the VL3 transporter doesn’t perform similar functions in hydrogen peroxide transport. This response doesn’t require the new transporter to be functional, only that the original transporter in SS328-leu is not present anymore. The increased catalase activity in the presence of hydrogen peroxide in samples without microcystin also supports this theory. Integrating the transporter into a different locus in the genome or expressing it in a plasmid while leaving the original transporter intact would confirm this theory. In general, this might be a better option, as the removal of the original transporter creates an extra variable that makes the functional verification of the new transporter more difficult. |
</p> | </p> | ||
<br/> | <br/> | ||
Revision as of 16:21, 7 November 2016
Achievements
Detection
We created devices that produce YFP in response to oxidative stress
Based on our studies of inducing stress promoters with hydrogen peroxide, it seemed that the CCP1 and TSA1 promoters were the most promising ones. In both of these promoters, increasing H2O2 concentrations seem to lead to stronger activation of promoters and thus to more intensive fluorescence signals, as seen from results obtained from microplate reader results where fluorescence is normalized to cell density (Figure 1). The functionality of the promoters was confirmed with fluorescence measurements performed with flow cytometry (Figure 2).


We managed to produce a phenotype change in yeast by replacing the QDR2 transporter
Using our foam-based visual catalase assay, we managed to prove a phenotype change after replacing the original QDR2 transporter in the S. cerevisae strain SS328-leu genome with the corresponding transporter from strain VL3. This can be seen in increased catalase activity levels compared to the non-modified strain after incubation in different concentrations of microcystin (figure 3). Despite the increase of catalase activity base level, the assay didn’t give definitive proof of the functionality of the integrated transporter, as the observed response to microcystin concentrations in SS328-leu with QDR2 transporter was different than in VL3. However, this response might also be partially obscured by the large margin of error in our experiment.

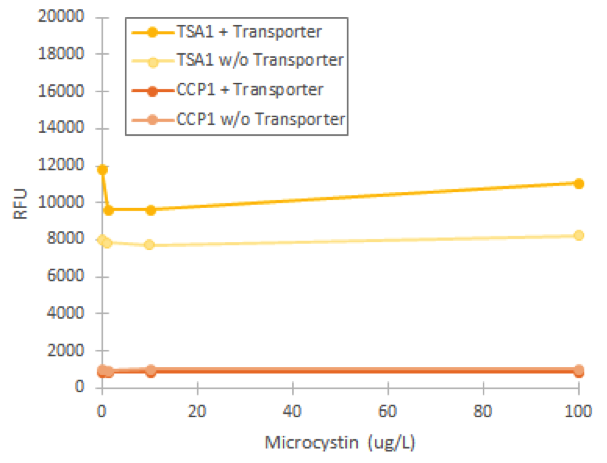
Based on the phenotype change, we assumed that the replaced transporter was functional. However, when we attempted to induce fluorescence of our stress promoters in the strain with the replaced transporter, we didn’t obtain any fluorescent signal compared to uninduced values (figure 4). In this experiment, varying microcystin concentrations did not significantly affect any of our promoters, which we concluded to be due to the inability of the transporter to import the toxin into the cell.
Discussion
We managed to prove that the transporter replacement had changed the phenotype of host cells through studying its catalase. This would support correct integration of the new transporters. Despite the phenotype change, the transporter did not seem to be functional based on flow cytometry experiments of microcystin induction. Therefore, it must be that the transporter affects catalase activity in some other way than through increasing microcystin transport.
The specific functions of VL3’s QDR2 transporter besides the capability to transport microcystin aren’t known, but it is possible that it does not have a similar hydrogen peroxide antiporter function as the corresponding transporter in our lab strain (SGD ID: S000001383). In this case it could be that replacing the transporter allows more hydrogen peroxide to accumulate inside the cell, which results in a higher catalase response. This might be the case if the VL3 transporter doesn’t perform similar functions in hydrogen peroxide transport. This response doesn’t require the new transporter to be functional, only that the original transporter in SS328-leu is not present anymore. The increased catalase activity in the presence of hydrogen peroxide in samples without microcystin also supports this theory. Integrating the transporter into a different locus in the genome or expressing it in a plasmid while leaving the original transporter intact would confirm this theory. In general, this might be a better option, as the removal of the original transporter creates an extra variable that makes the functional verification of the new transporter more difficult.
As we only had time to properly test the strep-tagged transporter variant, it is possible that the other variants would produce better results; the strep tag might interfere with transporter functionality or correct localization. A verification of the correct localization of transporter should be performed to confirm this, as we had planned to do by overexpressing the transporter under the GAL1 promoter.
In addition, it is also possible that the true, functional VL3 transporter has a leucine instead of an isoleucine as the single uncertain amino acid in its sequence. Although this is a small difference, it could nevertheless potentially prevent the transporter from functioning entirely as intended. If experiments could be continued, the other transporter constructs should be tested. In addition, more experiment replicates would be needed to prove or disprove transporter functionality; as our visual catalase assay is rather imprecise, replicates for it would be needed to confirm results.
Transporter functionality is essential for our sensor concept as without it, the toxin can not be imported into the cell and thus it cannot cause any response in promoters. For this reason, solving the transporter problems would be of prime importance. One possible idea to be considered is the transformation of the stress promoters into VL3 strain as it already has the transporter for microcystin. However, it is difficult to assess and predict the feasibility and potential problems arising with this, as VL3 is not typically used in lab work.
Two of our stress promoter constructs (TSA1 and CCP1) seemed to be functional when their behaviour was tested with hydrogen peroxide. The base level of TSA1 fluorescence was rather high, and relative changes were rather small. Still, it clearly seemed to be upregulated by oxidative stress. For the CCP1 promoter, construct base level was near to zero, absolute values of induced fluorescence were much smaller, but relative values were significantly greater.
Even though there is a good proof of concept that both promoters are induced by oxidative stress using hydrogen peroxide, we don’t have data on their behavior when the oxidative stress is induced by microcystin. Hydrogen peroxide is a reactive oxygen species, and microcystin raises cellular reactive oxygen species levels, so we estimated that they affect the oxidative stress related genes in the same way. Nevertheless, this assumption would ultimately need to be proven by experimental results. We hoped to be able to test this during our project, but unfortunately we couldn’t get the QDR2 transporter from VL3 integrated into lab strain’s genome so that it would have remained functional. Without the transporter, microcystin induction of our promoters isn’t possible.
If the promoter constructs could be proven to work similarly with microcystin induction as with hydrogen peroxide induction, they would require additional optimization to facilitate the interpretation of the fluorescence. The main focus would be on producing a more easily quantifiable visual signal. The CCP1 promoter would seem to be the best option for optimization, as although its expression level is low, the fluorescent signal could be amplified using e.g. a genetic amplification circuit. However, this would require much optimization to achieve stable and comparable signals. Genomic integration of the synthetic constructs would greatly enhance stability; this would remove potential issues such as plasmid loss or differences in plasmid copy count. An important additional note is that although our tested CCP1 promoter clearly worked, its sequence did contain a single base mutation. Whether this difference has a positive or negative effect on the fluorescence would have to be confirmed by obtaining the correct promoter sequence.
A potential improvement to make our sensor more convenient would be the use of a different visual reporter. A suitable visual reporter for our purpose would be bright enough to be seen by bare eye, sensitive, quickly formed and stable. It would also be good if no additional cofactors were needed to reporter molecule production.
The duration it takes for the fluorescent signal to develop could be another issue. To assess this, more time points for our flow cytometry would be beneficial. However, as median fluorescence values from flow cytometry didn’t increase when increasing the induction time to 4 h from 2 h, it can be assumed that the response itself is quick, and increases of fluorescence over a longer time period are mainly due to increases in cell density. In addition, doing the measurements with multiple replicates would give as accurate information as possible about the expression profiles of the promoters in different induction concentrations. In particular, for low expression levels, values normalized to uninduced values are greatly affected by small errors. To this end, although microplate reader experiments proved to be useful in giving some general information about the expression trends of the constructs, cell clumping was a considerable problem, as several replicates of a measurement could be rendered inaccurate by the scattered reads.
Even if it eventually turned out that our promoters were not functional with microcystin induction, it wouldn’t mean that they couldn’t have other applications. As the basic idea of our promoter devices is to respond to oxidative stress they could be used for other applications centered around this idea. Our hypothesis was that in fresh waters, microcystin is one of the strongest factors causing oxidative stress, and thus, our promoters would give a signal relative to its concentration. However, there are many other agents that cause oxidative stress, and thus our device could be used for studying their combinatory effect and monitoring stress levels in form of a fluorescence signal. A general oxidative stress sensor like this could be used for example for easy monitoring of stress in yeast cell cultures when optimizing its growth conditions.
Modelling
We created simplified molecular models of YAP1P:SKN7 and MSN2/4 regulation during oxidative stress response
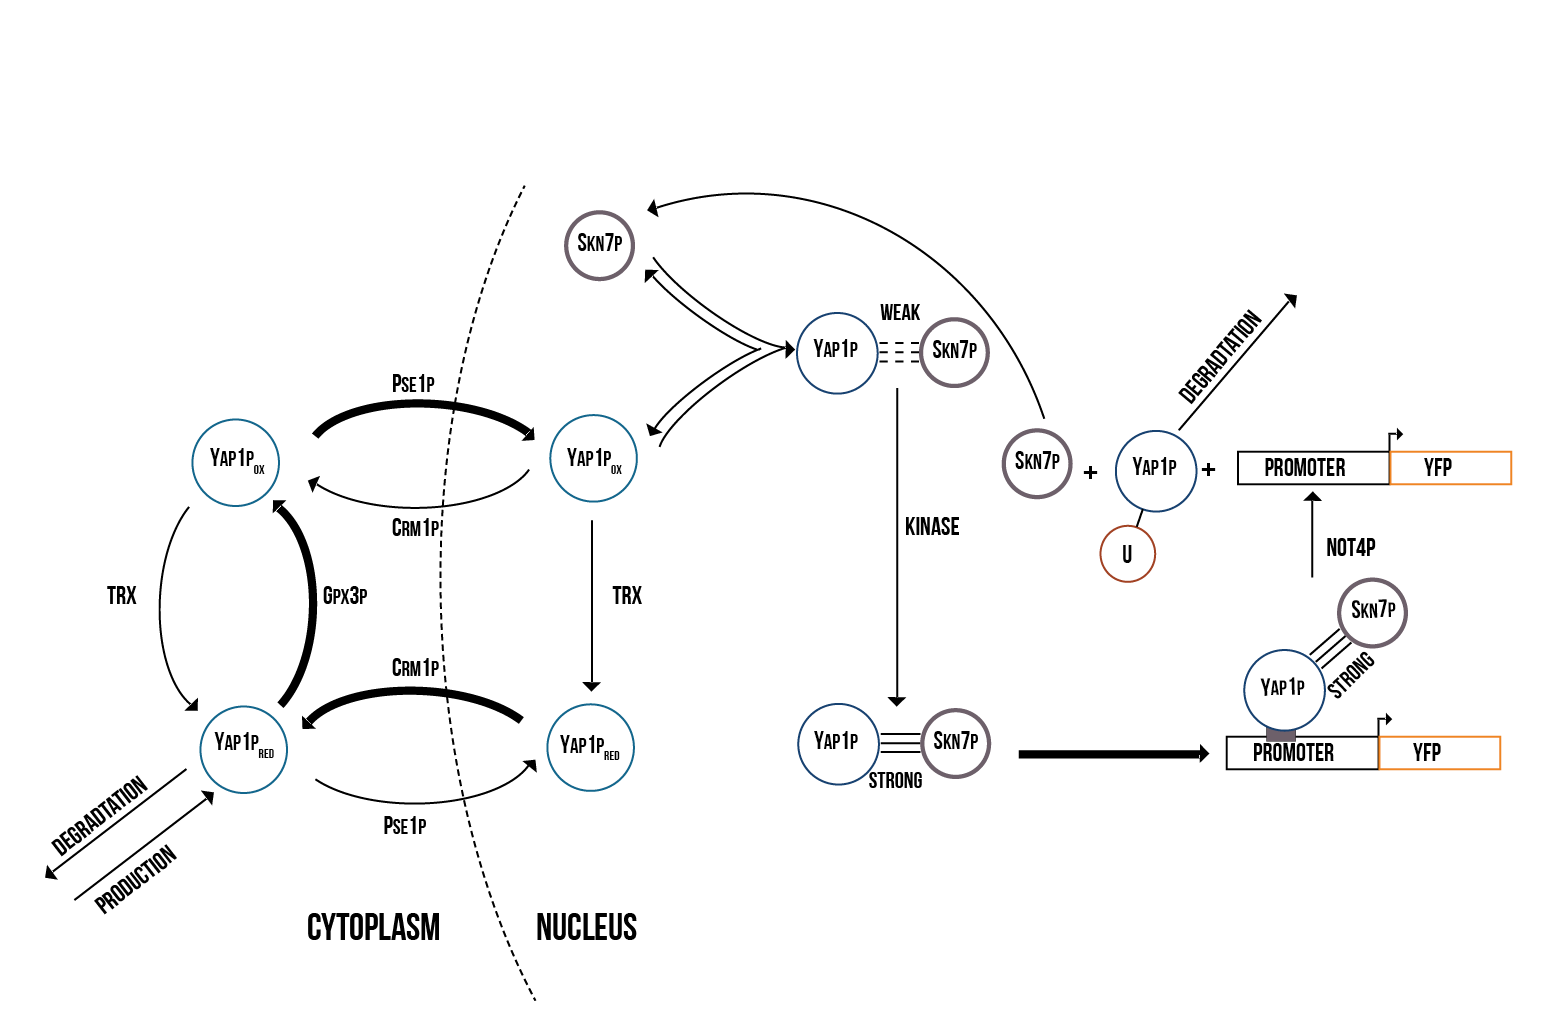
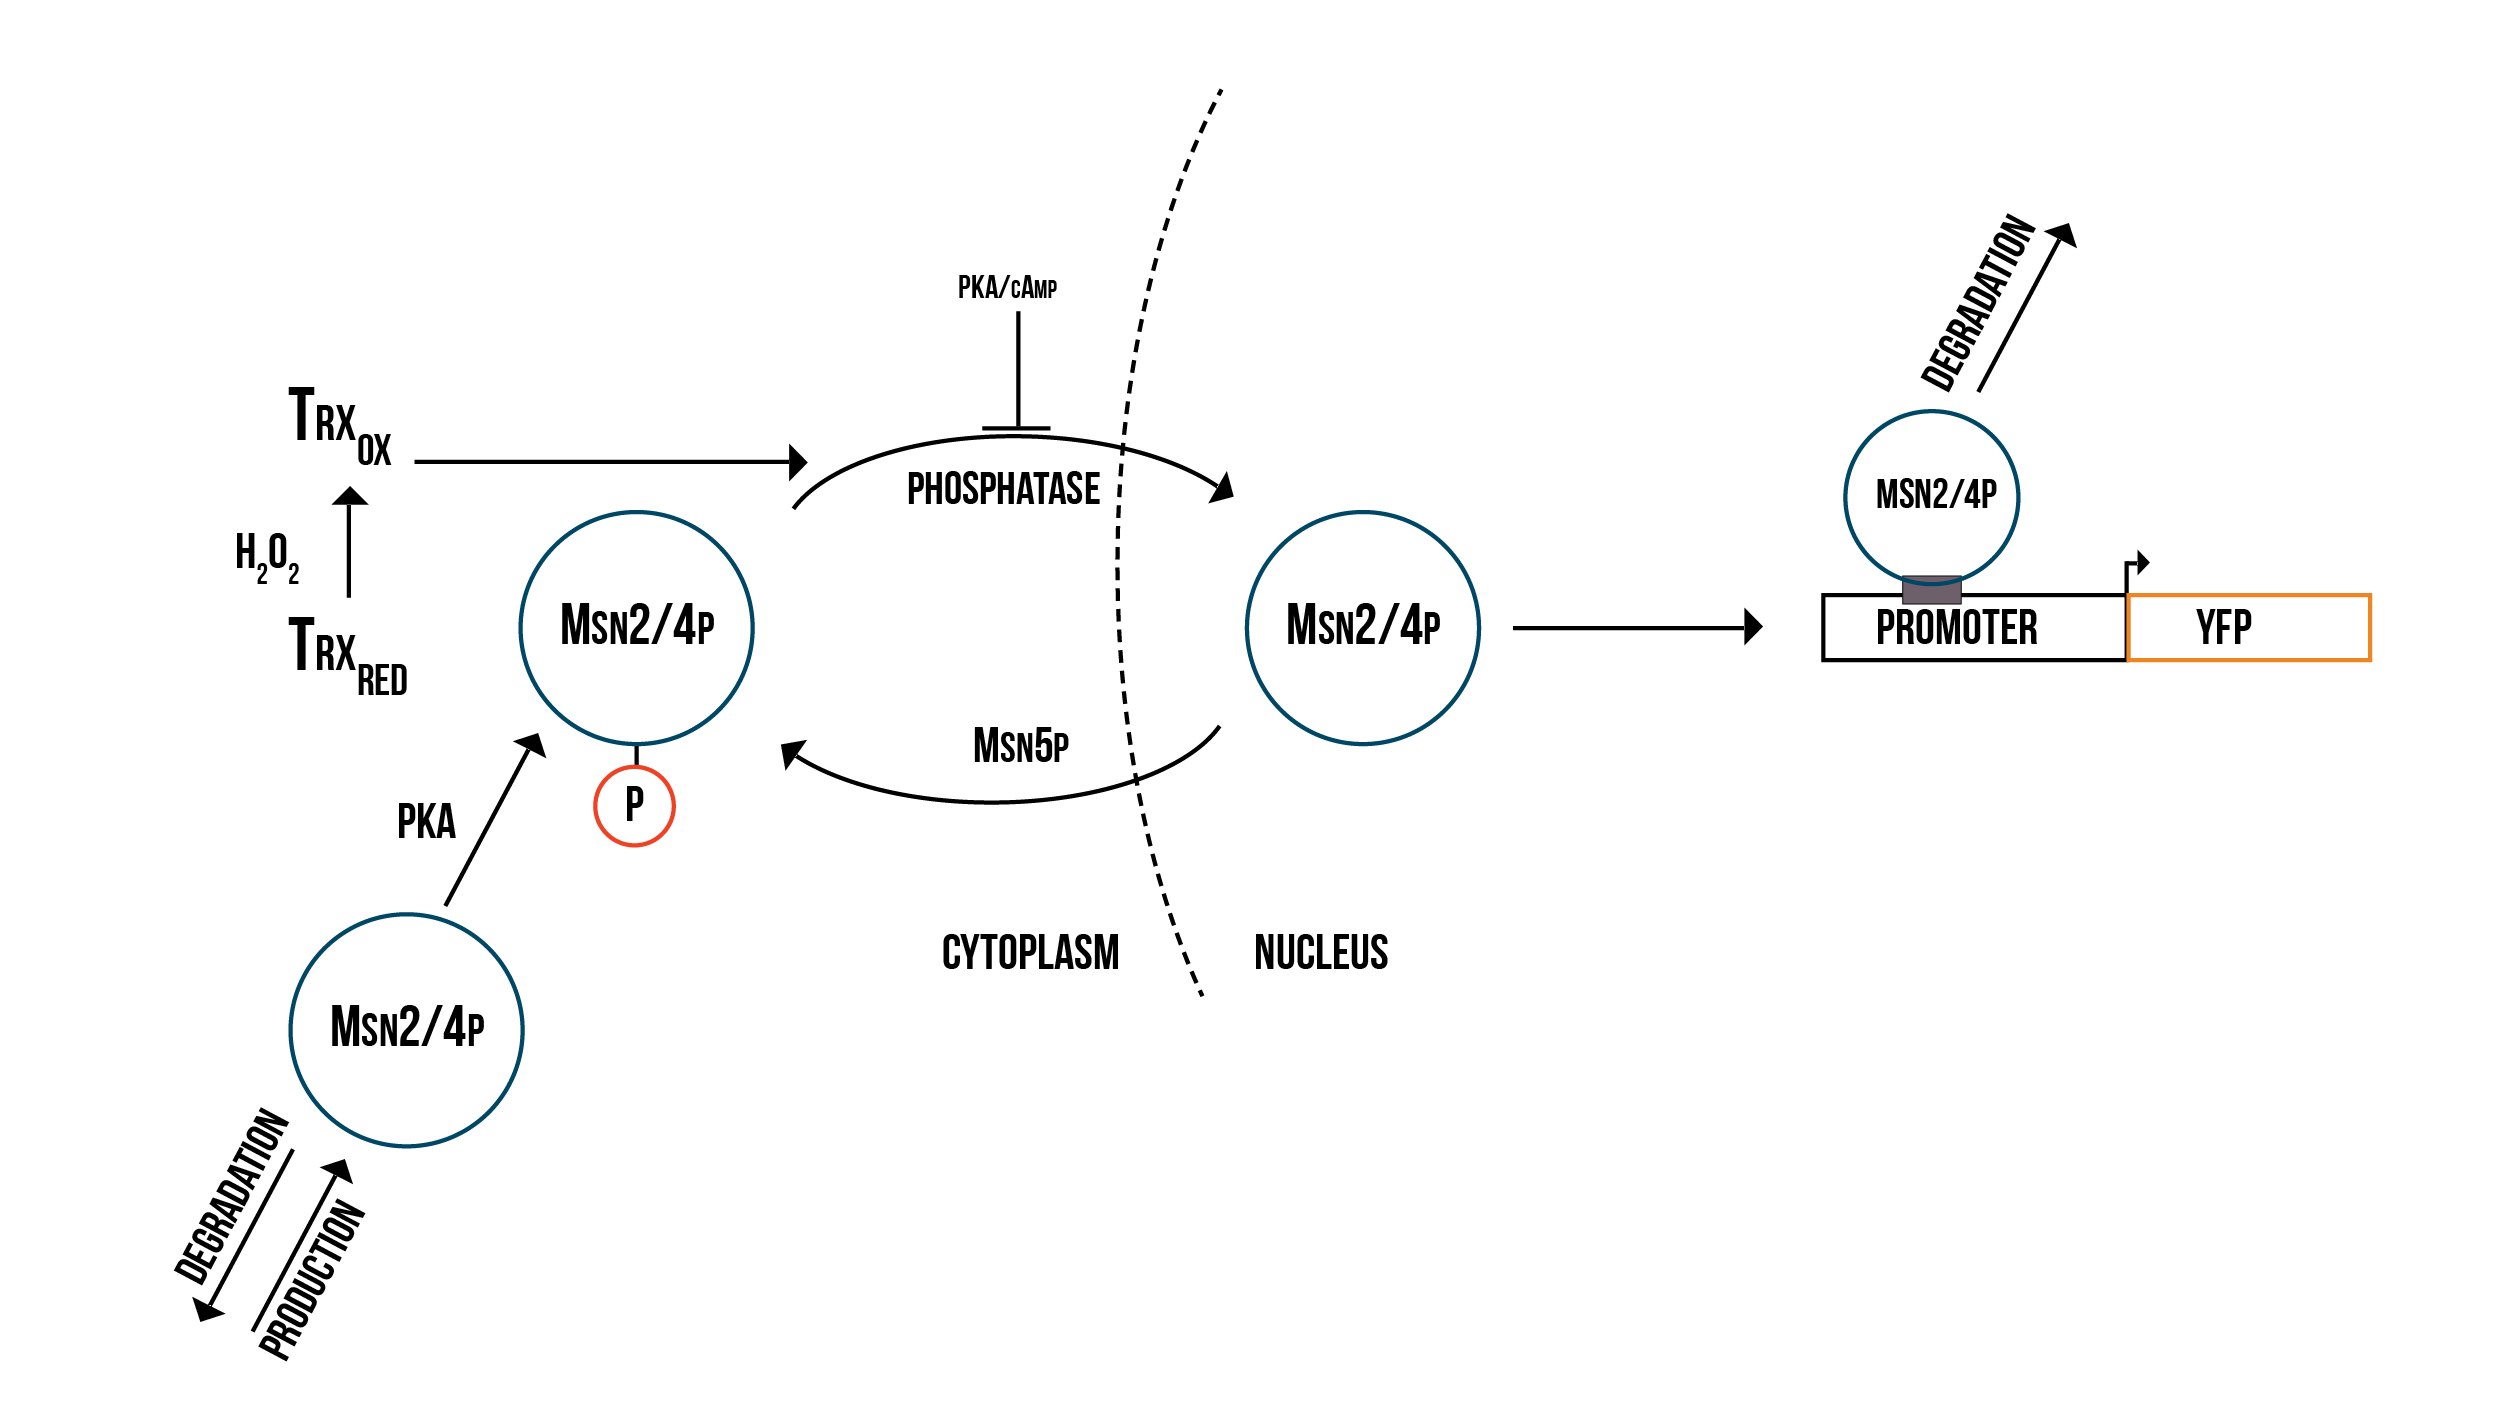
We created two molecular models of the regulatory mechanisms of YAP1P:SKN7 and MSN2/4 transcription factors which focus on the main species involved in their regulation when the Gpx3 protein (ORS sensor) quantity increases. These models are depicted below in the figures 5 and 6.
We simulated the Yellow Fluorescence Protein (YFP) production during stress with a mass action model in COPASI software
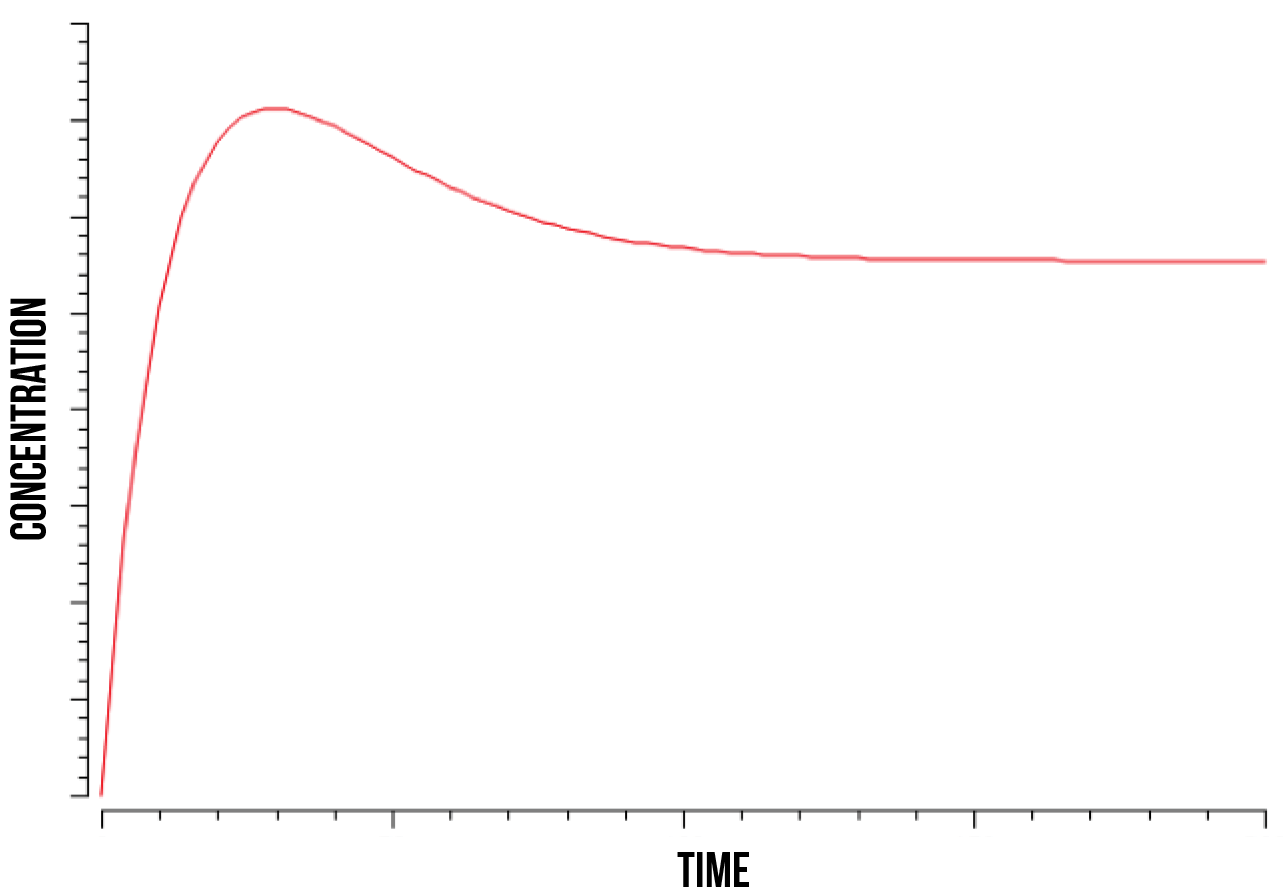
We ran a series of simulations on a range of different values involved in the model of YAP1P:SKN7 mechanism, including kinase activity, plasmid quantity, Yap1p degradation rate, transcription factor concentrations and promoter binding rate. Below (figure 7) we show a plot of the overall behaviour of the protein production given our model and parameters.
We support the model in which Not4 is responsible for Yap1p degradation
During the run of our simulations, we observed a tight relationship between the degradation rate of Yap1p and the Not4 activity rate. We support the validity of the model suggested in (Glushan et al. 2012) since this model reflects a prediction of protein which fits our estimations and expectations. We show a plot (figure 9) below, which shows the behaviour at which the Yap1p:Skn7 complex stabilizes in dependence of Not4.
We support the findings that transcription factors Yap1p and Skn7 participate actively in the initial stress response mechanism of the cell
According to our results on protein production, our cells show a specially high initial response, shown as an exponential function. This response maintains until the quantity of plasmids gets saturated and the protein production becomes then constant. Below we show a plot (figure 8) of the overall behaviour of the saturation of the plasmids on the cell.
As mentioned before, these results are in accordance with previous literature on the “fast/short-term” response of transcription factors YAP1P and SKN7 in OSR.
Discussion
The above presented model and simulations form a basis to a better understanding of the stress response mechanism in the cell via the Gpx3 increase and gene activation through transcription factors Yap1p and Skn7.
From the above simulation results we can make several observations:
The quantity of active genes depends on the quantity of the S(NO:SKN7) complex as well as the total number of promoter binding sites contained in each cell, in particular the minimum. Once the quantity of active genes reaches its maximum, protein production occurs at a constant rate and the amount of YFP increases linearly. We also observed that protein production will stop after Yap1p in the nucleus is degraded and the Yap1p production rate can’t insufficiently replace the lost transcription factors in the nucleus.
Our model confirms that Yap1p and Skn7p seem to play a crucial role in the immediate response of the cell against oxidative stress. In addition, Not4 plays an important role in the long-term stabilization of the quantity of oxidised Yap1p in the nucleus and therefore also in the cell’s long-term response to oxidative stress. Altering the Not4 degradation rate and the kinase binding rate has large effects on the overall protein production rate. The simulations run in this model, support the Yap1p degradation mechanism based on Not4 activity suggested in the literature.
In order to have a more accurate model of the response against oxidative stress in the cell and the fluorescence production, we need to include the transcription MSN2/4p in our numerical simulations and then to fit our parameters to experimental FACS data using COPASI’s parameter estimation function. This would enable us to make more accurate numerical predictions of the behaviour of the detection mechanism under various conditions. We could then model the promoter structure in a more detailed way and use the simulation results to guide the design of optimal promoters for our detection mechanism.

Degradation
We pinpointed the localization of two MlrA constructs in yeast
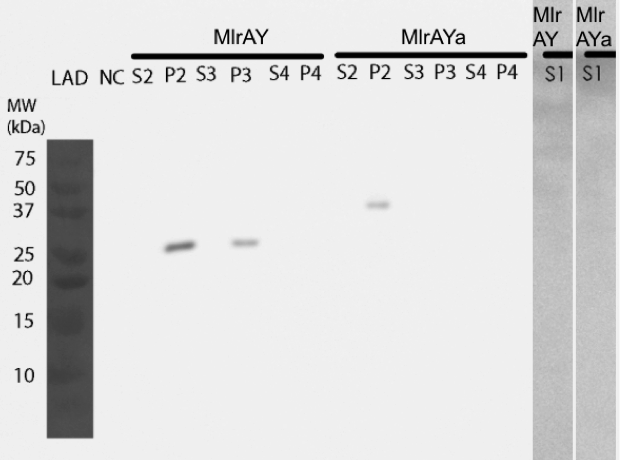
Our results show that our constructs, MlrA (MlrAY) and MlrA with mating factor α (MlrAYa), both localized in the fraction comprising of inclusion bodies, plasma membrane and cell wall (Figure 10, P2 fractions). MlrA was also detected in the fraction containing only cell wall and plasma membrane (P3 fraction), indicating that the protein is localized in the plasma membrane. The absence of MlrAYa from the S3 and P3 samples is most likely due to technical errors in the experiment, and, based on this, we can’t conclude if the protein is in the plasma membrane or in the inclusion bodies.
We proved that our enzymes are active
Based on our final enzyme activity assay, both MlrAY and MlrAYa have activity. The earlier assay with non-diluted enzyme had shown that either there is high activity or that there is no activity at all, but with this final activity assay we managed to prove that the enzymes degrade MC-LR. The results show that the three different dilutions degrade the MC-LR at different rates, with 1:10 dilution having the highest activity and 1:1000 having the lowest (Figure 11). Based on the graphs it seems that the plain MlrA has a bit higher activity than MlrA with the mating factor α.
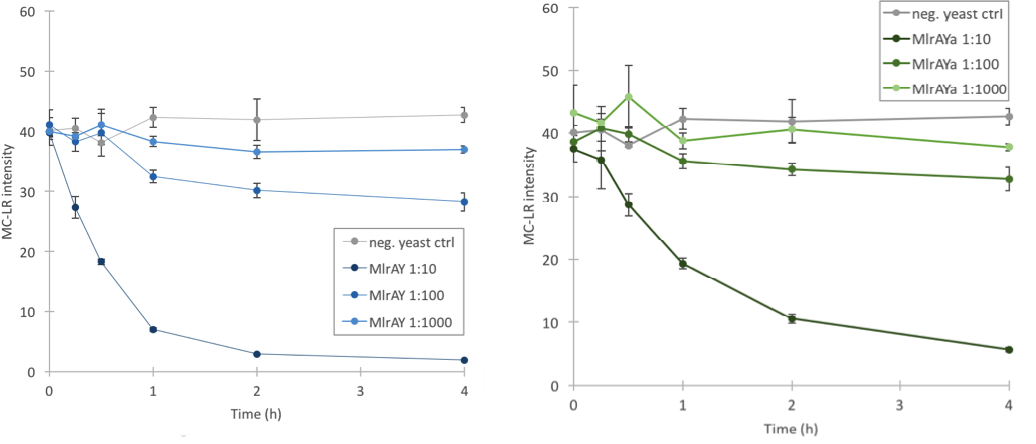
Based on the localization we were able to say that MlrA resides in the plasma membrane, but we were unable to conclude the localization of MlrA with the mating factor α. Anyhow, after the enzyme activity assay, we are able to conclude that since both constructs were localized in the P2 fraction (and MlrA additionally in the P3 fraction) and since both had activity, it is most likely that they both reside in the plasma membrane in an active form.
Discussion
In the degradation part of the project, we met our goals partially: we were able to produce the active enzyme in yeast with two of our constructs, but the enzymes didn’t localize as expected and we weren’t able to purify them sufficiently. Nevertheless, we are content with the results we obtained as they show that our project has great potential to be developed further in the future.
When expressing the yeast constructs, we made some interesting observations of the enzymes’ sizes. When the MlrA construct without the mating factor α was expressed in yeast, it was detected on the Western blot as a 28 kDa band. This is the same size as in
E. coli
, which had been established already by Dziga et al. (2012) who discussed that this might be due to some
E. coli
specific protease activity, since the calculated mass of the enzyme is 37 kDa and their heterologous production of MlrA in Staphylococcus aureus did not result in a protein of 28 kDa. The results from Dziga et al. also showed that the enzyme was cleaved from the N-terminus, as they had the His tag on the C-terminus and were able to detect it with anti-His antibody in western blot. This was also the case with our results, as we, too had the His tag on the C-teminus; the cleavage happens in the N-terminus. Our results therefore indicate that there might be similar proteolytic activity in
S. cerevisiae
as there is in
E. coli
in regards of this enzyme.
Expression of MlrA with the mating factor α signal sequence and propeptide resulted in a protein of about 38 kDa, which corresponds to the calculated size of MlrA. It might be that the secretion tag in front of the enzyme protects it from the proteolytic cleavage, even though the secretion tag itself is apparently cleaved off during processing as it should be; otherwise the protein would have been about 47 kDa.
Interestingly, the MlrA with the secretion tag containing three propeptide parts appeared to have a molecular weight between 50 and 75 kDa. This could correspond to the calculated weight of the enzyme with the whole secretion tag, which is 62 kDa, which would mean that there had been problems with the cleavage of the tag. In addition, it seemed that there had been problems with producing the protein, as there was only a very faint band corresponding to this construct on the western blot.
Our plan was to purify the enzymes with the histidine tag located on the C-terminus. Failure to purify MlrA using affinity chromatography Ni-NTA spin columns had been reported before by Dziga et al. (2012). However, as we made a preliminary attempt to purify a larger quantity of the enzyme with FPLC, we succeeded in purifying a small amount of MlrA: the full results can be read from our lab page. Our results thus indicate that affinity chromatography purification of MlrA is possible, although optimization of the purification conditions would be necessary to obtain better purity and higher yields of purified protein. Although we didn’t have time to try these improvements ourselves, we had ideas of what may give better purification yields. This includes a very slow initial elution buffer gradient to wash out unspecific binding. In addition, optimizing the pH of the sample could improve binding; a higher pH might allow for better binding to the nickel in the column, as the number of histidines with a complementary charge would increase. Diluting the sample in phosphate buffer and desalting the sample could improve its binding to the column. Additionally, binding could be facilitated by extending the 6X His tag to a 10X His tag. In the study mentioned above, purification of the enzyme to some extent with ion exchange chromatography had been successful. Although we didn’t have time to try this option, we were able to demonstrate that it is not the only method for purification, as also affinity chromatography could be successful.
However, as we didn’t manage to purify the enzyme enough, we weren’t able to quantify the amount of MlrA needed for the purification of a certain amount of microcystin. Furthermore, measuring the rate of degradation will also help in characterising the enzyme. In order to have the final product, an enzyme capsule capable of detoxifying a bucket of water, these pieces of information are crucial.
Our localization analysis together with the final enzyme activity assay gave us quite conclusive results about the two constructs we had used in these experiments. MC-degrading activity was observed in the enzyme samples taken from the fraction containing the inclusion bodies, plasma membrane and cell wall as well as from the post-refolding fraction containing the plasma membrane and cell wall. This suggests that active forms of the enzyme are localized in the plasma membrane. There is a possibility that the refolding step does not refold all of the inclusion bodies, which could mean that even though our enzyme localizes into the plasma membrane and or the cell wall after refolding, it could actually still be partially in the inclusion bodies. Yet, it is highly unlikely that a protein in the inclusion bodies would work properly, i.e. have activity. Therefore, the activity results give quite conclusive information about the enzymes’ likely localization.
It seems that the MlrA without the mating factor α has a slightly higher activity than the MlrA with the mating factor α. The activity of both constructs had been analysed from the insoluble fraction after cell lysis since they localized mostly there. However, in the first expression of the yeast constructs, there was also some MlrA without secretion tag localized in the soluble fraction. Since this was not the case in the second expression, we decided not to analyse the soluble fractions from the second expression due to resource constraints. In addition, our hypothesis was that if the enzyme is localized in the membranes, it probably needs the membrane conditions in order to function properly. Nevertheless, it would be interesting to see what kind of activity the soluble fraction would have given, since our positive control was from the soluble fraction of
E. coli
.
If we had more time, we would have wanted to test our hypothesis about the enzyme needing membrane conditions to function properly. To test this, we would have analysed the activity of the soluble fraction as well as purified the plasma membranes from the fraction containing them and the cell wall. If the hypothesis had been correct, we would have tried to quantify the amount of MlrA in one plasma membrane in order to be able to calculate the amount needed for the detoxification of a certain volume of water. However, if it seemed that the soluble fraction had higher activity, optimization of the purification process would have been needed.
Our plan was to have a final product composed of the microcystinase and lysozyme. If we had obtained results of the quantification of produced MlrA, we would have tested the degradation of microcystins from an actual microcystin contaminated lake water sample by supplementing the sample with known MlrA and cyanobacteria-lysing lysozyme.
Conclusions
After experimentally testing our stress promoters, the CCP1 promoter in particular showed promise for development as an oxidative stress sensor. It produced a large relative increase in YFP when induced, and had a low base level of expression.
Our simulations support the hypothesis that transcription factors Yap1p and Skn7 play a crucial role in the immediate response of the cell against oxidative stress. This means that promoters relying on these transcription factors, such as our CCP1 promoter, would be rapidly activated by oxidative stress. Therefore, our promoters proved to be good candidates for future development of sensor applications.
Based on our results, MlrA has great potential for production and purification in an active form in both
E. coli
and
S. cerevisiae
. Additional experiments should be done to find the optimal chassis and conditions to acquire maximal yields of highly active enzyme.
“ Our model confirms that Yap1p and Skn7p seem to play a crucial role in the immediate response of the cell against oxidative stress ”
Parts
Here you can find the BioBricks that we have submitted to the parts registry.
Our favorite parts:
BBa_K1907001
Microcystinase (MlrA) for
S. cerevisiae
MlrA is an enzyme derived from Sphingomonas sp. ACM-3962 that degrades the cyanobacterial toxin microcystin. This part is optimized for expression in
Saccharomyces cerevisiae
.
BBa_K1907002
Microcystinase (MlrA) for
E. coli
MlrA is an enzyme derived from Sphingomonas sp. ACM-3962 that degrades the cyanobacterial toxin microcystin. This part is optimized for expression in
Escherichia coli
.
BBa_K1907000
Venus Yellow Fluorescent Protein (YFP)
This part encodes the yellow fluorescent protein Venus, codon-optimized for
Saccharomyces cerevisiae
. This part is suitable for use as e.g. a fluorescent reporter.
BBa_K1907008
CCP1 promoter + Venus YFP
This composite part combines the CCP1 promoter, which is activated by oxidative stress, and the yellow fluorescent protein, Venus. It can be used as a sensor to detect various sources of oxidative stress.
Other parts:
BBa_K1907003
CTT1 promoter for
S. cerevisiae
BBa_K1907004
TSA1 promoter for
S. cerevisiae
BBa_K1907005
CCP1 promoter for
S. cerevisiae
BBa_K1907006
Microcystinase (Mlra) + mating factor alpha tag, for
S. cerevisiae
BBa_K1907007
TSA1 promoter + Venus YFP
BBa_K1907009
CTT1 promoter + Venus YFP
“ We were able to produce the active enzyme in yeast with two of our constructs ”
Medal Criteria
Bronze Medal
- ✔ Register for iGEM, have a great summer, and attend the Giant Jamboree.
- ✔ Meet all deliverables on the Requirements page.
- ✔ Create a page on your team wiki with clear attribution of each aspect of your project. See our Attributions page.
- ✔ Document at least one new standard BioBrick Part or Device central to your project and submit this part to the iGEM Registry. Our part can be found here: BBa_K1907000.
Silver Medal
- ✔ Experimentally validate that at least one new BioBrick Part or Device of your own design and construction works as expected. Submit this new part to the iGEM Parts Registry. This working part must be different from the part documented in bronze medal criterion #4. More information about our part here: BBa_K1907001.
- ✔ Convince the judges you have helped any registered iGEM team in a significant way. Read more about our collaborations on the Community page.
- ✔ iGEM projects involve important questions beyond the lab bench, for example relating to (but not limited to) ethics, sustainability, social justice, safety, security, and intellectual property rights. Demonstrate how your team has identified, investigated, and addressed one or more of these issues in the context of your project. More information can be found on our Human Practices page.
Gold Medal
At least two criteria must be met:
- ✔ Expand on your silver medal activity by demonstrating how you have integrated the investigated issues into the design and/or execution of your project. Read more about this on our Human Practices page.
- ✔ Improve the function OR characterization of an existing BioBrick Part or Device and enter this information in the Registry. Our improved part can be found here: BBa_K1907002.
- ✔ Demonstrate a functional proof of concept of your project. Your proof of concept must consist of a BioBrick device; a single BioBrick part cannot constitute a proof of concept. Our functional proof of concept is demostrated here: Proof of concept.
- ✘ Show your project working under real-world conditions. To achieve this criterion, you should demonstrate your whole system, or a functional proof of concept working under simulated conditions in the lab.
“ Our promoters proved to be good candidates for future development of sensor applications ”
References
Dziga D, Wladyka B, Zielińska G, Meriluoto J, Wasylewski M., 2012. Heterologous expression and characterisation of microcystinase. Toxicon, 59(5), pp. 578-586.

