Difference between revisions of "Team:Exeter/Model"
J.Burtonlowe (Talk | contribs) |
AndrewWild (Talk | contribs) |
||
| Line 15: | Line 15: | ||
}); | }); | ||
</script> | </script> | ||
| − | |||
</head> | </head> | ||
| Line 56: | Line 55: | ||
display:block !important; | display:block !important; | ||
} | } | ||
| − | + | #soc{ | |
display:none; | display:none; | ||
} | } | ||
| Line 74: | Line 73: | ||
font-size:20px; | font-size:20px; | ||
} | } | ||
| − | |||
| − | |||
| − | |||
} | } | ||
#links:hover{ | #links:hover{ | ||
| Line 114: | Line 110: | ||
background-color:#eeeeee; | background-color:#eeeeee; | ||
} | } | ||
| − | |||
#soc{ | #soc{ | ||
margin-top:-12px; | margin-top:-12px; | ||
| − | + | margin-left:-15px; | |
} | } | ||
| − | + | .soc_1{ | |
| − | + | ||
| − | + | ||
margin-right:3px; | margin-right:3px; | ||
| − | |||
| − | |||
} | } | ||
| − | + | .soc_2{ | |
| − | + | ||
margin-right:3px; | margin-right:3px; | ||
| − | |||
| − | |||
} | } | ||
| − | + | .soc_3{ | |
| − | + | ||
margin-right:3px; | margin-right:3px; | ||
| − | |||
| − | |||
| − | |||
} | } | ||
| Line 295: | Line 279: | ||
#Section_Link:hover{ | #Section_Link:hover{ | ||
| + | } | ||
| + | #sectionGap, #sectionGap:focus, #contentTitle{ | ||
| + | min-width:100%; | ||
| + | min-height:10vh; | ||
| + | background:#e8e8e8; | ||
| + | display:block; | ||
| + | font-size:400%; | ||
| + | text-align:center; | ||
| + | color:#47BCC2; | ||
| + | text-decoration:none; | ||
| + | border-style:none none solid none; | ||
| + | border-width:3px; | ||
| + | border-color:#8cd5d9; | ||
| + | } | ||
| + | #sectionGap:hover, #sectionGap:active{ | ||
| + | color:#339499; | ||
} | } | ||
#sectionGap, #sectionGap:focus, #contentTitle{ | #sectionGap, #sectionGap:focus, #contentTitle{ | ||
| Line 415: | Line 415: | ||
height:1px; | height:1px; | ||
top:-15px; | top:-15px; | ||
| + | } | ||
| + | /*Mobile and small screen css*/ | ||
| + | @media (max-width: 767px){ | ||
| + | .link_fix{ | ||
| + | display:none; | ||
| + | } | ||
| + | .div_vl.backgroundimage{ | ||
| + | background-image: url('#'); | ||
| + | background:#ddd; | ||
| + | } | ||
| + | #title{ | ||
| + | font-size:150%; | ||
| + | } | ||
| + | /*Makes side pictures on banner invisible on small screens*/ | ||
| + | /*as it clutters screen*/ | ||
| + | .subdiv_banner.left, .subdiv_banner.right{ | ||
| + | display:none; | ||
| + | } | ||
| + | } | ||
| + | #dropdownMenu1{ | ||
| + | margin-top:-0.15vw; | ||
| + | background:#e8e8e8; | ||
| + | border-style:none; | ||
} | } | ||
.equation{ | .equation{ | ||
| Line 451: | Line 474: | ||
border-color:#4e4e4e; | border-color:#4e4e4e; | ||
border-width:0.5px; | border-width:0.5px; | ||
| − | |||
| − | |||
| − | |||
| − | |||
| − | |||
| − | |||
| − | |||
| − | |||
| − | |||
| − | |||
| − | |||
| − | |||
| − | |||
| − | |||
| − | |||
| − | |||
| − | |||
| − | |||
| − | |||
| − | |||
| − | |||
| − | |||
| − | |||
| − | |||
| − | |||
| − | |||
| − | |||
| − | |||
| − | |||
| − | |||
| − | |||
} | } | ||
@media (min-width: 767px){ | @media (min-width: 767px){ | ||
| Line 516: | Line 508: | ||
padding:10px 0; | padding:10px 0; | ||
margin-left:0.85vw; | margin-left:0.85vw; | ||
| + | } | ||
| + | .graph_box{ | ||
| + | max-width:90%; | ||
} | } | ||
} | } | ||
| Line 583: | Line 578: | ||
<li ><a id="links"href="https://2016.igem.org/Team:Exeter/Model">Models</a></li> | <li ><a id="links"href="https://2016.igem.org/Team:Exeter/Model">Models</a></li> | ||
<li ><a id="links"href="https://2016.igem.org/Team:Exeter/Collaborations">Collaborations</a></li> | <li ><a id="links"href="https://2016.igem.org/Team:Exeter/Collaborations">Collaborations</a></li> | ||
| − | |||
| − | |||
| − | |||
| − | |||
| − | |||
| − | |||
| − | |||
| − | |||
| − | |||
| − | |||
| − | |||
| − | |||
| − | |||
| − | |||
| − | |||
| − | |||
| − | |||
| − | |||
| − | |||
| − | |||
</ul> | </ul> | ||
| + | <ul class="nav navbar-nav navbar-right"> | ||
| + | <li style="height:50px;width:48px;"class="soc_1"> | ||
| + | <a href="https://www.youtube.com/channel/UC31qfG4hnm8gRHDCkrBtAiQ"> | ||
| + | <img id = "soc" src="https://static.igem.org/mediawiki/2016/2/23/You.png"/></a> | ||
| + | </li> | ||
| + | <li style="height:50px;width:48px;"class="soc_2"> | ||
| + | <a href="https://www.facebook.com/ExeteriGEM2016/?ref=aymt_homepage_panel"> | ||
| + | <img id = "soc" src="https://static.igem.org/mediawiki/2016/5/51/Fb.png"/></a> | ||
| + | </li> | ||
| + | <li style="height:50px;width:48px;"class="soc_3"> | ||
| + | <a href="https://twitter.com/exeter_igem"> | ||
| + | <img id = "soc" src="https://static.igem.org/mediawiki/2016/7/76/Twit.jpg"/></a> | ||
| + | </li> | ||
| + | </ul> | ||
</div> | </div> | ||
</div> | </div> | ||
| Line 650: | Line 639: | ||
<div class="container"> | <div class="container"> | ||
<div class="div_vl backgroundimage"> | <div class="div_vl backgroundimage"> | ||
| − | <h1 id="title"> | + | <h1 id="title">Collaborations</h1> |
<!--Contains links to sections on page--> | <!--Contains links to sections on page--> | ||
<div class="div_banner"> | <div class="div_banner"> | ||
| Line 665: | Line 654: | ||
<!--Give span class "oneline" or "twoline" depending on how llong the section text is--> | <!--Give span class "oneline" or "twoline" depending on how llong the section text is--> | ||
| − | <a href="#section_1" class="banner_link col-xs-6 col-sm-3"><span class="oneline"> | + | <a href="#section_1" class="banner_link col-xs-6 col-sm-3"><span class="oneline">Measurement</span></a> |
| − | <a href="#section_2" class="banner_link col-xs-6 col-sm-3"><span class="oneline"> | + | <a href="#section_2" class="banner_link col-xs-6 col-sm-3"><span class="oneline">Software</span></a> |
| − | <a href="#section_3" class="banner_link col-xs-6 col-sm-3"><span class="oneline"> | + | <a href="#section_3" class="banner_link col-xs-6 col-sm-3"><span class="oneline">Parts</span></a> |
| − | <a href="#section_4" class="banner_link col-xs-6 col-sm-3"><span class=" | + | <a href="#section_4" class="banner_link col-xs-6 col-sm-3"><span class="twoline">Skype and<br /> Meet-ups</span></a> |
</div> | </div> | ||
<!--Left picture (the teal line on left)--> | <!--Left picture (the teal line on left)--> | ||
| Line 682: | Line 671: | ||
<div id="section_1" class="link_fix"></div> | <div id="section_1" class="link_fix"></div> | ||
<div id="contentTitle"> | <div id="contentTitle"> | ||
| − | + | Measurement: Newcastle </div> | |
| − | + | ||
| + | |||
| + | |||
| + | <p id="pp">This year we have been working alongside iGEM teams from across the globe. | ||
| + | We have been working closely with teams from Newcastle, Glasgow and Purdue to help each other improve our projects | ||
| + | from both in and outside the lab.</p> | ||
| − | < | + | <img src="https://static.igem.org/mediawiki/2016/8/88/T--Exeter--Home_collab_cond.jpg" style="float:right; width:40vw; height:60vh;"> |
| − | + | ||
| − | + | ||
| − | + | ||
| − | + | ||
| − | + | ||
| − | + | ||
| − | + | ||
| − | + | ||
| − | + | ||
| − | + | <p id="pp">Part of the Newcastle iGEM team’s project this year | |
| − | + | involved an experiment centred around the creation of biological electronic | |
| − | + | components. Newcastle asked our team if we could help them out by finding the | |
| + | thermal conductivity of different growth media. With the help of our biophysicist | ||
| + | supervisor Ryan Edgington, we came up with a plan to measure the conductivity.</p> | ||
| + | |||
| − | + | <p id="pp">Using the apparatus we had available, we discovered that the thermal conductivity of LB and M9 broth to be roughly | |
| − | + | the same as water. The conductivity of water at room temperature is about 598.4 $\frac{mW}{Km}\text{ }$(mili | |
| − | + | watt per metre kelvin).We found the conductivity of LB and M9 to be (605 $\pm$ 20) $\frac{mW}{Km}\text{ }$ and (570 $\pm$ 30) $\frac{mW}{Km}\text{ }$ respectively | |
| − | + | You can read more about our method <a href="https://2016.igem.org/Team:Exeter/Team/collab">here</a>.</p> | |
| − | + | ||
| − | + | ||
| − | + | ||
| − | + | ||
| − | + | ||
| − | + | ||
| − | + | ||
| − | + | ||
| − | + | ||
| − | + | ||
| − | + | ||
| − | + | ||
| − | + | ||
| − | + | ||
| − | + | ||
| − | + | ||
| − | + | ||
| − | + | ||
| − | + | ||
| − | + | ||
| − | + | ||
| − | + | ||
| − | + | ||
| − | + | ||
| − | + | ||
| − | + | ||
| − | + | ||
| − | + | ||
| − | + | ||
| − | < | + | |
| − | + | ||
| − | + | ||
| − | + | ||
| − | + | ||
| − | + | ||
| − | + | ||
| − | + | ||
| − | + | ||
| − | + | ||
| − | + | ||
| − | + | ||
| − | + | ||
| − | + | ||
| − | + | ||
| − | + | ||
| − | + | ||
| − | + | ||
</p> | </p> | ||
| − | |||
| − | |||
| − | |||
| − | |||
| − | |||
| − | |||
| − | |||
| − | |||
| − | |||
| − | |||
| − | |||
| − | |||
| − | |||
<div> | <div> | ||
| − | <a id="Section_link" href="# | + | <a id="Section_link" href="#section_2" style="display:block;margin:20px auto 0 auto;width:14px;"><span style="color:#47BCC2;font-size: 25px;" class="glyphicon glyphicon-menu-down" aria-hidden="true"></span></a> |
</div> | </div> | ||
</div> | </div> | ||
<div class="col-xs-12 div_content"> | <div class="col-xs-12 div_content"> | ||
| − | <div id=" | + | <div id="section_2" class="link_fix"></div> |
<div id="contentTitle"> | <div id="contentTitle"> | ||
| − | + | Software </div> | |
| − | + | <div> | |
| − | < | + | <h3>Purdue</h3> |
| + | |||
| + | <p id="pp">Our team helped Purdue with this by logging data for the 260 | ||
| + | iGEM teams of 2015 and critiquing ease of use and effectiveness of the database. For each team | ||
| + | we documented a summary of what their project was about, their track, number of team members, chassis, | ||
| + | research benchmarks, finished parts, the presence or absence of kill switches, medals and any awards | ||
| + | and nominations. We tagged the teams summaries with keywords to make finding a project much easier.</p> | ||
| + | |||
| + | <p id="pp">We gave Purdue feedback on the design, layout and how | ||
| + | easy this database was to use to help them improve on what they had done so far.</p> | ||
| + | <br /> | ||
| + | <h3>Edinburgh Collaboration</h3> | ||
| + | <h6>Optimising methods of data mutation detection in BabbleBlocks</h6> | ||
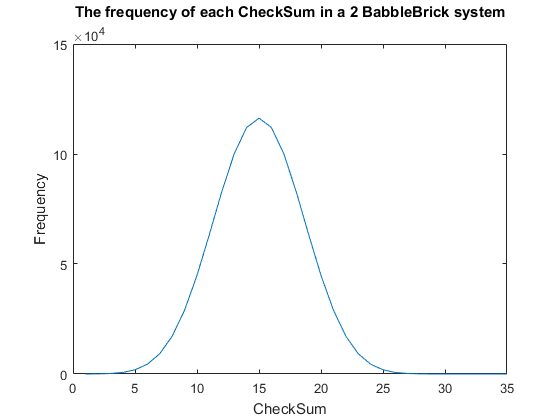
<p id="pp"> | <p id="pp"> | ||
| − | + | Storing information on DNA offers many advantages over current methods, however mutations | |
| − | + | need to be carefully monitored to ensure incorrect data is not read as a false positive. | |
| − | + | Currently for information stored on a BabbleBrick a ‘CheckSum’ is calculated by taking the | |
| + | sum of the values on each base of DNA. If the checksum of a BabbleBlock has changed between | ||
| + | the time of writing and reading, the data is considered to be corrupt. | ||
</p> | </p> | ||
<p id="pp"> | <p id="pp"> | ||
| − | + | <span class="equation">$C = \sum^{bp}_{n=1} bp_n$</span><br /> | |
| − | + | ||
| − | + | ||
| − | + | ||
| − | + | ||
| − | + | ||
| − | + | ||
| − | + | ||
| − | + | ||
| − | + | ||
| − | + | ||
| − | + | ||
| − | + | ||
| − | + | ||
| − | + | ||
| − | + | ||
| − | + | ||
| − | + | ||
| − | + | ||
| − | + | ||
| − | + | ||
| − | + | ||
| − | + | ||
| − | + | ||
| − | + | ||
| − | + | ||
| − | + | ||
| − | + | ||
| − | + | ||
| − | + | ||
| − | + | ||
| − | + | ||
| − | + | ||
| − | + | ||
| − | + | ||
| − | + | ||
| − | + | ||
| − | + | ||
| − | + | ||
| − | <span class="equation">$ | + | |
<span class="equation_key"> | <span class="equation_key"> | ||
| − | $ | + | $C$: Frequency of checksum<br /> |
| − | $ | + | $n$: The integer address of base pair<br /> |
| + | $bp$: Amount of base pairs (5 times the number of BabbleBricks)<br /> | ||
| + | $bp_n$: The value of the $n^{th}$ base pair | ||
</span> | </span> | ||
</p> | </p> | ||
| − | < | + | <div class="col-xs-12" style="width:100%;position:relative;margin:auto;padding:0;"> |
| − | + | <div class="graph_box col-xs-12"> | |
| − | + | <img src="https://static.igem.org/mediawiki/2016/4/48/T--Exeter--Collaboration_Edinb_1.png"> | |
| − | + | <span>Fig. 1. The frequency of all checksums in a babbleBlock system containing two BabbleBricks.</span> | |
| − | + | </div> | |
| − | < | + | <div class="graph_box col-xs-12"> |
| − | + | <img src="https://static.igem.org/mediawiki/2016/0/0b/T--Exeter--Collaboration_Edinb_2.png"> | |
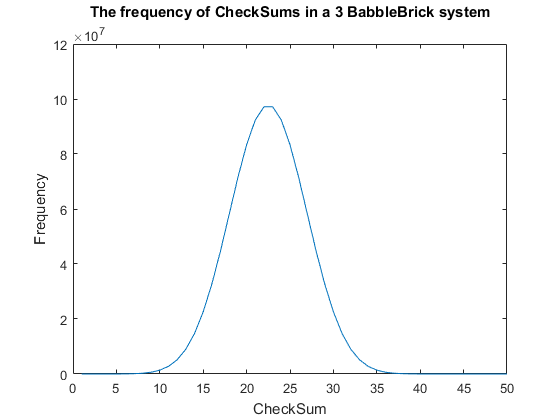
| − | </ | + | <span>Fig. 2. The frequency of all checksums in a babbleBlock system containing three BabbleBricks.</span> |
| + | </div> | ||
| + | </div> | ||
<p id="pp"> | <p id="pp"> | ||
| − | + | Currently a checksum utilizes only a small percentage of the values that can be stored. | |
| − | + | A BabbleBrick contains 5 base 4 digits meaning that 4$^{\text{5}B}$ unique bits of | |
| − | + | information share one of 15$B$ checksums where $B$ is the amount of BabbleBricks in one | |
| − | + | BabbleBlock. This data has been plotted for BabbleBlocks containing 2 and 3 BabbleBricks | |
| − | + | in Fig.1 and Fig.2 respectively. Assuming that between the time of writing and reading | |
| + | any number of mutations can occur, the maximum probability of a mutation event resulting | ||
| + | in the same checksum can be calculated by comparing the frequency of one checksum to the | ||
| + | total frequency of unique bits of information. | ||
</p> | </p> | ||
<p id="pp"> | <p id="pp"> | ||
| − | <span class="equation">$ | + | <span class="equation">$P_C = \big(\frac{C_{max}}{F}) \approx \big(\frac{1.2 \times 10^5}{4^{10}}) = 11$% in a 2 BabbleBrick system</span><br /> |
| − | <span class="equation">$ | + | <span class="equation">$\:\:\:\:\:\:\:\:\:\:\:\:\:\:\:\:\:\:\:\:\:\:\:\:\:\:\:\:\:\:\approx \big(\frac{10^8}{4^{15}}) = 9$% in a 3 BabbleBrick system</span> |
<span class="equation_key"> | <span class="equation_key"> | ||
| − | $ | + | $P_C$: Maximum probability of the same checksum occuring after any number of mutations<br /> |
| − | $ | + | $C_{max}$: Frequency of most common checksum<br /> |
| − | $ | + | $F$: Frequency of possible unique bits of information |
</span> | </span> | ||
</p> | </p> | ||
<p id="pp"> | <p id="pp"> | ||
| − | + | Therefore, it can be predicted that for an average sentence containing 9 words the maximum | |
| − | + | probability of the same checksum occurring will be of the magnitude of 1%. The probability | |
| − | + | should decrease marginally when adding BabbleBricks due to the slightly increased range of | |
| + | checksums that become available. This value can be optimized by altering the method of the | ||
| + | checksum to utilize a greater range of values and to spread out the frequency more evenly as | ||
| + | to reduce the maximum probability of the same checksum occurring. | ||
</p> | </p> | ||
<p id="pp"> | <p id="pp"> | ||
| − | + | Currently one BabbleBlock has 4 BabbleBricks dedicated to storing the checksum, giving a maximum | |
| − | + | 10$^4$ possible values. The first step in determining a ‘CheckMethod’ is to ensure that all checksums | |
| − | + | for a suitable amount of BabbleBricks can be stored without going over 10$^4$. It is also important | |
| + | to not use operators that will result in negative numbers or decimals, therefore limiting the | ||
| + | possible checksum values to integers up to but not including 10$^4$, this rules out operators such | ||
| + | as subtract and divide. For this example, a suitable number of words in a sentence and therefore | ||
| + | BabbleBricks in a BabbleBlock shall be 20. All simulations will be carried out on 3 BabbleBrick | ||
| + | systems due to computing limitations. | ||
</p> | </p> | ||
<p id="pp"> | <p id="pp"> | ||
| − | + | Checksums are non-directional, for example a BabbleBrick of bases [2,2,2,2,2] would have the | |
| − | + | same checksum as [2,1,3,2,2]. To alter this a checkmethod will incorporate the position | |
| − | + | of the base in to the calculation. At each point the digit is multiplied by its position | |
| − | + | in the BabbleBlock, where the first BabbleBrick has digit positions 1 to 5 and the last | |
| − | + | BabbleBrick (20$^{th}$) has positions 96 to 100. A scaler $\alpha$ has been included to | |
| − | + | increase the range of results. To ensure multiplications don’t result in a null result | |
| − | + | the value of each base had a value of 1 added to it. The first checkemethod of one | |
| − | + | BabbleBlock can be defined as: | |
| − | + | ||
| − | + | ||
| − | + | ||
| − | + | ||
| − | + | ||
| − | + | ||
| − | + | ||
| − | + | ||
| − | + | ||
| − | + | ||
| − | + | ||
| − | + | ||
| − | + | ||
</p> | </p> | ||
<p id="pp"> | <p id="pp"> | ||
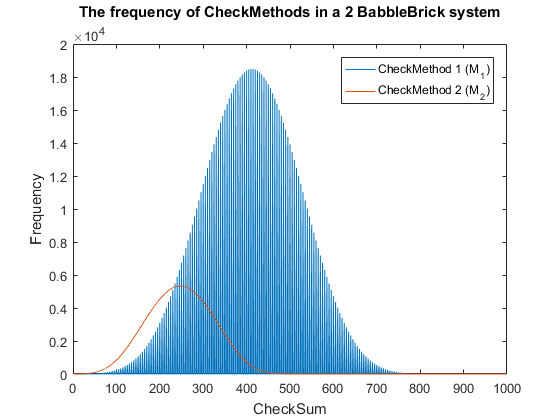
| − | <span class="equation">$ | + | <span class="equation">$M_1 = \sum_{n=1}^{bp}(bp_n + 1) . \alpha . bp$</span> |
<span class="equation_key"> | <span class="equation_key"> | ||
| − | $ | + | $M_1$: Frequency of CheckMethod 1<br /> |
| − | $ | + | $\alpha$: Scaler ($\alpha = 5$ in this example) |
| − | + | ||
| − | + | ||
</span> | </span> | ||
</p> | </p> | ||
| − | |||
| − | |||
| − | |||
| − | |||
| − | |||
<div class="col-xs-12" style="width:100%;position:relative;margin:auto;padding:0;"> | <div class="col-xs-12" style="width:100%;position:relative;margin:auto;padding:0;"> | ||
| − | <div class=" | + | <div class="graph_box col-xs-12"> |
| − | <img src="https://static.igem.org/mediawiki/2016/ | + | <img src="https://static.igem.org/mediawiki/2016/4/4c/T--Exeter--Collaboration_Edinb_3.png"> |
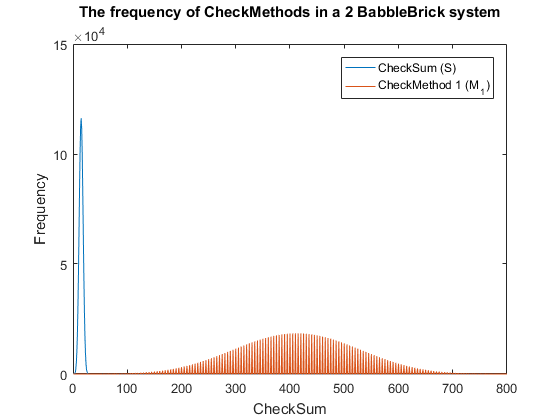
| − | <span>Fig. | + | <span>Fig. 3. The frequency of checkmethod 1 for all possible bits of information in a babbleBlock system containing two BabbleBricks.</span> |
| − | + | </div> | |
| − | + | <div class="graph_box col-xs-12"> | |
| − | + | <img src="https://static.igem.org/mediawiki/2016/d/d7/T--Exeter--Collaboration_Edinb_4.png"> | |
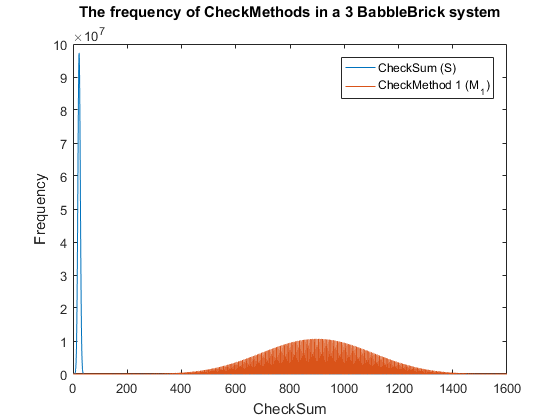
| + | <span>Fig. 4. The frequency of checkmethod 1 for all possible bits of information in a babbleBlock system containing three BabbleBricks.</span> | ||
</div> | </div> | ||
</div> | </div> | ||
<p id="pp"> | <p id="pp"> | ||
| − | + | This method results in Fig.3 and Fig.4 for a 2 and 3 BabbleBlock system respectively, | |
| − | + | which shows a large improvement over the original checksum method. The maximum frequency | |
| − | + | of a single checksum has been significantly decreased whichwill lower the probability of | |
| + | a flase positive occuring; this is largely due to the large range of results available to | ||
| + | the method. However, there is still room for improvement as the shaded area of the graph | ||
| + | indicates that on a smaller scale the frequency of checkmethod 1 varies between high and low | ||
| + | values. Eliminating this fluctuation would allow for the data to be spread out more evenly. | ||
| + | To improve this | ||
| + | method a second layer of multiplication will be implamented, each digit will | ||
| + | now be multiplied by a constant depending on its relative position in the BabbleBrick. | ||
| + | </p> | ||
| + | <p id="pp"> | ||
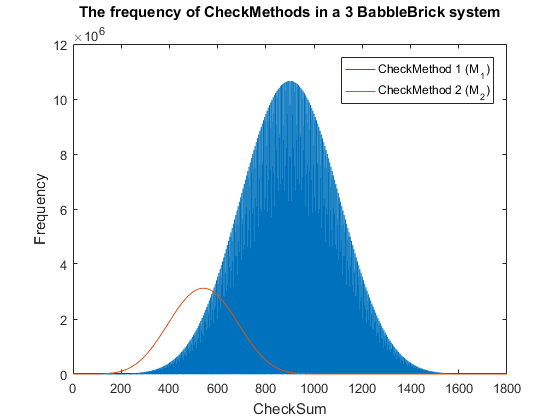
| + | <span class="equation">$M_2 = \sum_{p=1}^B \sum_{q=1}^{5}(bp_{(5B_p + q)} + 1) . q . bp$</span><br /> | ||
| + | <span class="equation" style="font-size:60%;">Or using the remainder modulo '%'</span><br /> | ||
| + | <span class="equation">$M_2 = \sum_{n=1}^{bp} (bp_n + 1) . ((bp \text{ % } 5) + 1) . bp$</span> | ||
| + | <span class="equation_key"> | ||
| + | $M_2$: Frequency of CheckMethod 2<br /> | ||
| + | $B$: Number of BabbleBricks in the BabbleBlock<br /> | ||
| + | $p$: Local integer address of BabbleBrick<br /> | ||
| + | $q$: Local integer address of base pair in BabbleBrick<br /> | ||
| + | $B_p$: The $p^{th}$ Babblebrick in the BabbleBlock | ||
| + | </span> | ||
</p> | </p> | ||
<div class="col-xs-12" style="width:100%;position:relative;margin:auto;padding:0;"> | <div class="col-xs-12" style="width:100%;position:relative;margin:auto;padding:0;"> | ||
<div class="graph_box col-xs-12"> | <div class="graph_box col-xs-12"> | ||
| − | <img src="https://static.igem.org/mediawiki/2016/ | + | <img src="https://static.igem.org/mediawiki/2016/6/6f/T--Exeter--Collaboration_Edinb_5.png"> |
| − | <span>Fig. | + | <span>Fig. 5. The frequency of checkmethod 2 for all possible bits of information in a babbleBlock system containing two BabbleBricks.</span> |
</div> | </div> | ||
<div class="graph_box col-xs-12"> | <div class="graph_box col-xs-12"> | ||
| − | <img src="https://static.igem.org/mediawiki/2016/ | + | <img src="https://static.igem.org/mediawiki/2016/0/06/T--Exeter--Collaboration_Edinb_6.png"> |
| − | <span>Fig. | + | <span>Fig. 6. The frequency of checkmethod 2 for all possible bits of information in a babbleBlock system containing three BabbleBricks.</span> |
</div> | </div> | ||
</div> | </div> | ||
<p id="pp"> | <p id="pp"> | ||
| − | + | <span class="equation">$P_{M_2} = \big(\frac{M_{2\:max}}{F}) \approx \big(\frac{6 \times 10^3}{4^{10}}) = 0.6$% in a 2 BabbleBrick system ($11$% for checksum)</span><br /> | |
| − | + | <span class="equation">$\:\:\:\:\:\:\:\:\:\:\:\:\:\:\:\:\:\:\:\:\:\:\:\:\:\:\:\:\:\approx \big(\frac{3 \times 10^6}{4^{15}}) = 0.3$% in a 3 BabbleBrick system ($9$% for checksum)</span> | |
| − | + | <span class="equation_key"> | |
| − | + | $P_{M_2}$: Maximum probability of the same checkmethod 2 value occuring after any number of mutations<br /> | |
| − | + | $M_{2\:max}$: Frequency of most common checkmethod 2 value<br /> | |
| − | + | $F$: Frequency of possible unique bits of information | |
| − | + | </span> | |
| − | + | ||
</p> | </p> | ||
<p id="pp"> | <p id="pp"> | ||
| − | + | This has been plotted for a 2 and 3 BabbleBlock system in Fig.5 and Fig.6 respectively. | |
| − | + | When comparing checksum to checkcethod 2 the frequency peak is approximately 20 to 30 | |
| − | + | times smaller in both cases whilst utilizing more values. In Fig.5 and Fig.6 the largest | |
| − | + | improvement using the second iteration of the checkmethod is the utilization of every | |
| − | + | integer value, checkmethod 1 appears shaded as the frequency varies frequently. The last | |
| + | step is to test checkmethod 2 when used in a babbleBlock containing 20 BabbleBricks; the | ||
| + | largest value possible assuming a BabbleBlock containing the value ‘3’ in each digit will | ||
| + | grant a value of 60600 which falls out of the current limit of 10$^4$ values. Therefore, | ||
| + | it is recommended that one more BabbleBrick is added to the end of the BabbleBlock in order | ||
| + | to store 10$^5$ values. | ||
</p> | </p> | ||
| − | < | + | <p id="pp"> |
| − | + | To improve this method further more complex multiplications could be added, it would be | |
| − | + | a decision based on optimising efficiency of calculations and minimising false positives. | |
| − | + | In a 2 and 3 BabbleBrick system the probability of a false positives occurring was reduced by | |
| − | + | approximately 20 and 30 times respectively, although the numbers are too large to compute, | |
| − | + | this new method has the possibility of lowering the maximum false positive error of the previously | |
| − | + | used checksum by one or more orders of magnitude. | |
| − | + | If continued further, research should also be done in to the reconstruction of data after it has been lost. | |
| − | + | </p> | |
| − | + | <div> | |
| − | + | <a id="Section_link" href="#section_3" style="display:block;margin:20px auto 0 auto;width:14px;"><span style="color:#47BCC2;font-size: 25px;" class="glyphicon glyphicon-menu-down" aria-hidden="true"></span></a> | |
| − | < | + | </div> |
| − | + | ||
| − | </ | + | |
| − | + | ||
| − | + | ||
| − | <div> | + | </div> |
| + | |||
| + | <div class="col-xs-12 div_content"> | ||
| + | <div id="section_3" class="link_fix"></div> | ||
| + | <div id="contentTitle"> | ||
| + | Parts:Glasgow | ||
| + | </div> | ||
| + | |||
| + | <p id="pp">We collaborated with Glasgow iGEM 2016 to test the efficiency of the T7 Promoter we were using to construct the KillerRed, KillerOrange and Lysozyme kill switches. We new that it was leaky and we speculated that it was reducing the efficiency of our project but we needed proof that the leakiness of the promoter could affect our project. In return they gave us a DH5α.Z1 strain in the hopes it would improve the efficiency of our promoter. After subsequent testing we were unable to express our KillerRed and KillerOrange proteins in this strain. This is the report they sent us for the test of the T7 promoter:</p> | ||
| + | |||
| + | <h5>Exeter and Glasgow iGEM 2016 Collaboration: <br \> | ||
| + | <br> | ||
| + | KillerRed and KillerOrange Promoter Efficiency Experiment | ||
| + | </h5> | ||
| + | |||
| + | <h6>Methods</h6> | ||
| + | |||
| + | <p id="pp">First, we transformed the plasmids for testing promoter efficiency into the E. coli strain DH5α.Z1:</p> | ||
| + | |||
| + | <ul> | ||
| + | <li>J04450 (RFP with a lac-repressible promoter) in pSB1C3</li> | ||
| + | <li>lac-repressible promoter + KillerRed in pSB1C3</li> | ||
| + | <li>lac-repressible promoter + KillerOrange in pSB1C3</li> | ||
| + | </ul> | ||
| + | |||
| + | <p id="pp">Next, we set up 5ml LB broth overnight cultures in boiling tubes with loose caps at 37°C shaking at 225rpm of:</p> | ||
| + | |||
| + | <ol> | ||
| + | <li>DH5α, no plasmid</li> | ||
| + | <li>DH5α, J04450-pSB1C3</li> | ||
| + | <li>DH5α, KillerRed-pSB1C3</li> | ||
| + | <li>DH5α, KillerOrange-pSB1C3</li> | ||
| + | <li>DH5α.Z1, no plasmid</li> | ||
| + | <li>DH5α.Z1, J04450-pSB1C3</li> | ||
| + | <li>DH5α.Z1, KillerRed-pSB1C3</li> | ||
| + | <li>DH5α.Z1, KillerOrange-pSB1C3</li> | ||
| + | </ol> | ||
| + | |||
| + | <p id="pp">We set up each of these both with 1mM IPTG and without, so 16 overnights in total, with 25μg/ml chloramphenicol for the strains with plasmids.</p> | ||
| + | |||
| + | <p id="pp">The next day, we spun down 500μl of each overnight in 1.5ml eppendorfs, resuspended in 1ml PBS buffer (PBS gives less background fluorescence than LB broth), and transferred to cuvettes for OD600 measurements. For the fluorescence measurements, we used a Typhoon FLA 9500 with the samples in a 96-well plate. Each of the 16 samples were pipetted into 3 wells with 300μl each. The settings on the Typhoon were: 1) excitation laser at 532nm and emission filter above 575nm (so would detect any wavelength above 575nm) and 2) excitation laser at 473nm and emission filter above 575nm. Both were across the whole 96-well plate, but the second lower excitation wavelength was included in case the first was too high to excite KillerOrange.</p> | ||
| + | |||
| + | <h6>Results</h6> | ||
| + | |||
| + | <p id="pp">For each of the wells, a fluorescence value in arbitrary units (au) was calculated using ImageQuant software, where we set the 3 wells of PBS only blanks as 0% fluorescence, and the well with the highest value as 100% to convert au into percentage. Next, we normalised for any natural fluorescence in the cells by subtracting the average of the “cells only” wells (DH5α, and Dh5α.Z1, both with and without IPTG) from all wells, and then corrected for the difference in OD600 values between samples by dividing the normalised fluorescence measurements by the OD600 values. The table below shows the average across the 3 wells of each of the 16 samples.</p> | ||
| + | |||
| + | <style> | ||
| + | table{ | ||
| + | padding-top:20px; | ||
| + | padding-right:33%px; | ||
| + | padding-left:33%; | ||
| + | font-size:150%; | ||
| + | text-align:center; | ||
| + | border-collapse: initial; | ||
| + | } | ||
| + | td:first-child { | ||
| + | text-align:left; | ||
| + | font-weight:bold; | ||
| + | } | ||
| + | th{ | ||
| + | padding-left:5px; | ||
| + | padding-right:5px; | ||
| + | } | ||
| + | </style> | ||
| + | <table> | ||
| + | <tr> | ||
| + | <th>Strain + Plasmid</th> | ||
| + | <th>No IPTG</th> | ||
| + | <th>1mM IPTG</th> | ||
| + | </tr> | ||
| + | <tr> | ||
| + | <td>DH5α</td> | ||
| + | <td>0.016009</td> | ||
| + | <td>-0.00115</td> | ||
| + | </tr> | ||
| + | <tr> | ||
| + | <td>DH5α J04450</td> | ||
| + | <td>99.84583</td> | ||
| + | <td>90.32377</td> | ||
| + | </tr> | ||
| + | <tr> | ||
| + | <td>DH5α KillerRed</td> | ||
| + | <td>0.003236</td> | ||
| + | <td>-0.00109</td> | ||
| + | </tr> | ||
| + | <tr> | ||
| + | <td>DH5α KillerOrange</td> | ||
| + | <td>-0.02212</td> | ||
| + | <td>-0.02343</td> | ||
| + | </tr> | ||
| + | <tr> | ||
| + | <td>DH5α.Z1</td> | ||
| + | <td>-0.02934</td> | ||
| + | <td>0.015912</td> | ||
| + | </tr> | ||
| + | <tr> | ||
| + | <td>DH5α.Z1 J04450</td> | ||
| + | <td>14.20878</td> | ||
| + | <td>80.45877</td> | ||
| + | </tr> | ||
| + | <tr> | ||
| + | <td>DH5α.Z1 KillerRed</td> | ||
| + | <td>-0.03287</td> | ||
| + | <td>-0.00517</td> | ||
| + | </tr> | ||
| + | <tr> | ||
| + | <td>DH5α.Z1 KillerOrange</td> | ||
| + | <td>-0.01994</td> | ||
| + | <td>-0.02095</td> | ||
| + | </tr> | ||
| + | </table> | ||
| + | |||
| + | <p id="pp">Graph of these averages. The error bars are standard deviation but are very small because the 3 replicates for each sample are technical replicates, so do not show the variation that would be seen with biological replicates (3 different colonies for each of the 16 samples).</p> | ||
| + | |||
| + | <br> | ||
| + | <br> | ||
| + | |||
| + | <div class="col-xs-12" style="padding:0;margin:0;"> | ||
| + | <img src="https://static.igem.org/mediawiki/2016/a/a1/T--Exeter--collab-glasgow1_png.png" style="max-width:100%;margin:auto;display:block;"> | ||
| + | <br> | ||
| + | <br> | ||
| + | </div> | ||
| + | |||
| + | <p id="pp">Fluorescence scan image from the Typhoon with labels for which samples are in each well.</p> | ||
| + | <br> | ||
| + | <br> | ||
| + | |||
| + | <div class="col-xs-12" style="padding:0;margin:0;"> | ||
| + | <img src="https://static.igem.org/mediawiki/2016/2/2d/T--Exeter--collab-glasgow2_png.png" style="max-width:100%;margin:auto;display:block;"> | ||
| + | <br> | ||
| + | <br> | ||
| + | </div> | ||
| + | |||
| + | <p id="pp">These data indicate that there is no difference in fluorescence between either KillerRed or KillerOrange and the cells only control either with or without induction with IPTG. There could be several reasons for this, including the light was not intense enough to excite the fluorescent proteins, however no fluorescence from this type of the test with a laser for excitation would be unlikely. It is also possible that no protein is being produced, which could be due to insufficient IPTG. However, the RFP in J04450 under the control of the lac-repressible promoter R0010 clearly shows that in the DH5α.Z1 strain, there is less fluorescence without IPTG, than with IPTG. This is not a perfect control for the concentration of IPTG used unless KillerRed and KillerOrange also have the R0010 promoter. Interestingly, in the DH5α strain, there is no significant difference between RFP fluorescence with or without IPTG – this is due to DH5α not having a functional copy of LacI, the lac repressor, therefore lac-repressible promoters are not “OFF”, so cannot be switched “ON” by IPTG induction. </p> | ||
| + | |||
| + | <h6>Sequencing</h6> | ||
| + | |||
| + | <p id="pp">Another reason there may not be any KillerRed or KillerOrange protein produced, is mutations in the promoter. This was something we encountered when attempting to clone a promoter in front of the toxin from the toxin-antitoxin system we were working with. If a protein is toxic to produce, any cell which is producing less or no protein will grow faster than a cell which is producing the toxic protein. This means a mutated, non-functional promoter will have a proliferative advantage during transformation. So, as we were sending our BioBricks for registry for submission, we decided to sequence the minipreps of KillerRed and KillerOrange as well with the registry standard pSB1C3 sequencing primer VF2, to check for any mutations. The results are shown below in screenshots of a plasmid editor software called ApE.</p> | ||
| + | |||
| + | <br> | ||
| + | <br> | ||
| + | |||
| + | <div class="col-xs-12" style="padding:0;margin:0;"> | ||
| + | <img src="https://static.igem.org/mediawiki/2016/4/44/T--Exeter--collab-glasgow3_png.png" style="max-width:100%;margin:auto;display:block;"> | ||
| + | <br> | ||
| + | <br> | ||
| + | </div> | ||
| + | |||
| + | <div class="col-xs-12" style="padding:0;margin:0;"> | ||
| + | <img src="https://static.igem.org/mediawiki/2016/5/53/T--Exeter--collab-glasgow4_png.png" style="max-width:100%;margin:auto;display:block;"> | ||
| + | <br> | ||
| + | <br> | ||
| + | </div> | ||
| + | |||
| + | <p id="pp">Both plasmids had the BioBrick prefix, and the correct sequence for both KillerRed and KillerOrange open reading frame, according to the papers cited on the Exeter 2016 iGEM wiki. The sequence between the prefix and the ATG start codon, we checked against lac-repressible promoters in the iGEM registry. We found a match to R0184, which is a T7 lac-repressible promoter. T7 promoters require T7 polymerase to be transcribed, as they are not recognised by E. coli polymerases. This results confirms the result of the fluorescence measurements. No KillerRed or KillerOrange protein was observed by fluorescence, as neither gene was being transcribed by either DH5α or DH5α.Z1 as neither strain produces the required T7 polymerase. A protein overexpression E. coli strain such as BL21<DE3> which has the T7 polymerase gene inserted into its genome is designed to use T7 promoters would have been able to express these KillerRed and KillerOrange constructs.</p> | ||
| + | |||
| + | <p id="pp">Sequencing result for KillerRed:</p> | ||
| + | |||
| + | <p id="pp"> ATAAAATAGG CGTATCACGA GGCAGAATTT CAGATAAAAA AAATCCTTAG CTTTCGCTAA GGATGATTTC TGGAATTCGC GGCCGCTTCT AGAGTACTTA ATACGACTCA CTATAGGGGA ATTGTGAGCG GATAACAATT CCCCTCAAGA AATAATTTTG TTTAACTTTA AACCTAAAGA GGAGAAAAAT GGGCAGTGAA GGTGGTCCTG CGCTTTTCCA GTCAGACATG ACCTTCAAAA TTTTCATTGA CGGTGAAGTT AATGGACAGA AATTTACGAT CGTAGCCGAT GGCTCAAGCA AATTCCCACA TGGGGACTTC AATGTCCACG CCGTGTGCGA AACAGGCAAA TTACCCATGA GCTGGAAGCC GATTTGTCAT TTGATTCAGT ACGGGGAGCC TTTTTTCGCT CGTTACCCAG ATGGAATTTC TCACTTTGCC CAGGAGTGTT TTCCCGAAGG ACTGTCTATC GATCGTACCG TGCGCTTTGA AAACGACGGT ACTATGACCT CGCATCATAC CTATGAATTA GACGATACAT GCGTGGTAAG TCGTATCACG GTAAACTGCG ACGGTTTTCA ACCTGATGGC CCAATCATGC GTGACCAGTT GGTCGATATC CTGCCTAATG AAACCCATAT GTTCCCGCAT GGGCCAAATG CGGTCCGCCA ATTAGCATTC ATCGGGTTCA CGACTGCGGA CGGCGGACTT ATGATGGGGC ATTTTGACTC TAAGATGACC TTTAACGGTT CGCGCGCGAT TGAAATTCCT GGGCCGCACT TTGTGACGAT TATTACAAAG CAAATGCGTG ATACATCTGA CAAACGCGAC CACGTCTGTC AACGTGAAGT CGCTTACGCA CATTCAGTGC CTCGCATTAC CAGTGCGATC GGTTCAGATG AGGACTGATA ACTGCCCAGG CATCAAATAA AACGAAAGGG TCAGTCGAAA ACT | ||
| + | </p> | ||
| + | |||
| + | <p id="pp">Sequencing result for KillerOrange:</p> | ||
| + | |||
| + | <p id="pp"> TATAAAATAG GCGTATCACG AGGCAGAATT TCAGATAAAA AAAATCCTTA GCTTTCGCTA AGGATGATTT CTGGAATTCG CGGCCGCTTC TAGAGTACTT AATACGACTC ACTATAGGGG AATTGTGAGC GGATAACAAT TCCCCTCAAG AAATAATTTT GTTTAACTTT AAACCTAAAG AGGAGAAAAA TGATGGAATG CGGCCCGGCG CTGTTTCAGA GCGATATGAC CTTTAAAATT TTTATTGATG GCGAAGTGAA CGGCCAGAAA TTTACCATTG TGGCGGATGG CAGCAGCAAA TTTCCGCATG GCGATTTTAA CGTGCATGCG GTGTGCGAAA CCGGCAAACT GCCGATGAGC TGGAAACCGA TTTGCCATCT GATTCAGTGG GGCGAACCGT TTTTTGCGCG CTATCCGGAT GGCATTAGCC ATTTTGCGCA GGAATGCTTT CCGGAAGGCC TGAGCATTGA TCGCACCGTG CGCTTTGAAA ACGATGGCAC CATGACCAGC CATCATACCT ATGAACTGAG CGATACCTGC GTGGTGAGCC GCATTACCGT GAACTGCGAT GGCTTTCAGC CGGATGGCCC GATTATGCGC GATCAGCTGG TGGATATTCT GCCGAGCGAA ACCCATATGT TTCCGCATGG CCCGAACGCG GTGCGCCAGC TGGCGTTTAT TGGCTTTACC ACCGCGGATG GCGGCCTGAT GATGGGCCAT CTGGATAGCA AAATGACCTT TAACGGCAGC CGCGCGATTG AAATTCCGGG CCCGCATTTT GTGACCATTA TTACCAAACA GATGCGCGAT ACCAGCGATA AACGCGATCA TGTGTGCCAG CGCGAAGTGG CGCATGCGCA TAGCGTGCCG CGCATTACCA GCGCGATTGG CAGCGATCAG GATTGATGAC TGCCCAGGCA TCAATTAAAA CGAAAGGCTC AGTCGAAAAC | ||
| + | </p> | ||
| + | |||
| + | <h6>Conclusion:</h6> | ||
| + | |||
| + | <p id="pp">Glasgow iGEM did fantastic work for us, providing us with detailed analysis of the T7 promoter and suggestions for improving the efficiency of our project. Whilst their data on the DH5alpha Z1 strain is accurate and in accordance with subsequent research and advice, we have since noted there is expression of KillerRed and KillerOrange in DH5alpha in lab tests. </p> | ||
| + | |||
| + | <div> | ||
<a id="Section_link" href="#section_4" style="display:block;margin:20px auto 0 auto;width:14px;"><span style="color:#47BCC2;font-size: 25px;" class="glyphicon glyphicon-menu-down" aria-hidden="true"></span></a> | <a id="Section_link" href="#section_4" style="display:block;margin:20px auto 0 auto;width:14px;"><span style="color:#47BCC2;font-size: 25px;" class="glyphicon glyphicon-menu-down" aria-hidden="true"></span></a> | ||
</div> | </div> | ||
| Line 967: | Line 1,056: | ||
<div id="section_4" class="link_fix"></div> | <div id="section_4" class="link_fix"></div> | ||
<div id="contentTitle"> | <div id="contentTitle"> | ||
| − | + | Skype and Meet-ups | |
</div> | </div> | ||
| − | |||
| − | |||
| − | |||
</div> | </div> | ||
| − | |||
</div> | </div> | ||
Revision as of 19:26, 11 October 2016