| Line 54: | Line 54: | ||
== Optimization == | == Optimization == | ||
| − | + | <p>Above model was optimized to compute the unknown variables, PiRi, codon matrix values, using the data from above mentioned paper. In MATLAB, fmincon function was used to minimize the sum of (model-experimental)^2 for all 14137 constructs. After several iterations of optimization, we achieved following results. Optimization was done in MATLAB on a supercomputer facility at IIT Madras.</p> | |
| − | Above model was optimized to compute the unknown variables, PiRi, codon matrix values, using the data from above mentioned paper. In MATLAB, fmincon function was used to minimize the sum of (model-experimental)^2 for all 14137 | + | <br> |
| − | Further, the system was optimized to by removing 5%, 10% outliers, which were computed as the top scores in | + | <p>Further, the system was optimized to by removing 5%, 10% outliers, which were computed as the top scores in |model-experimental|.</p> |
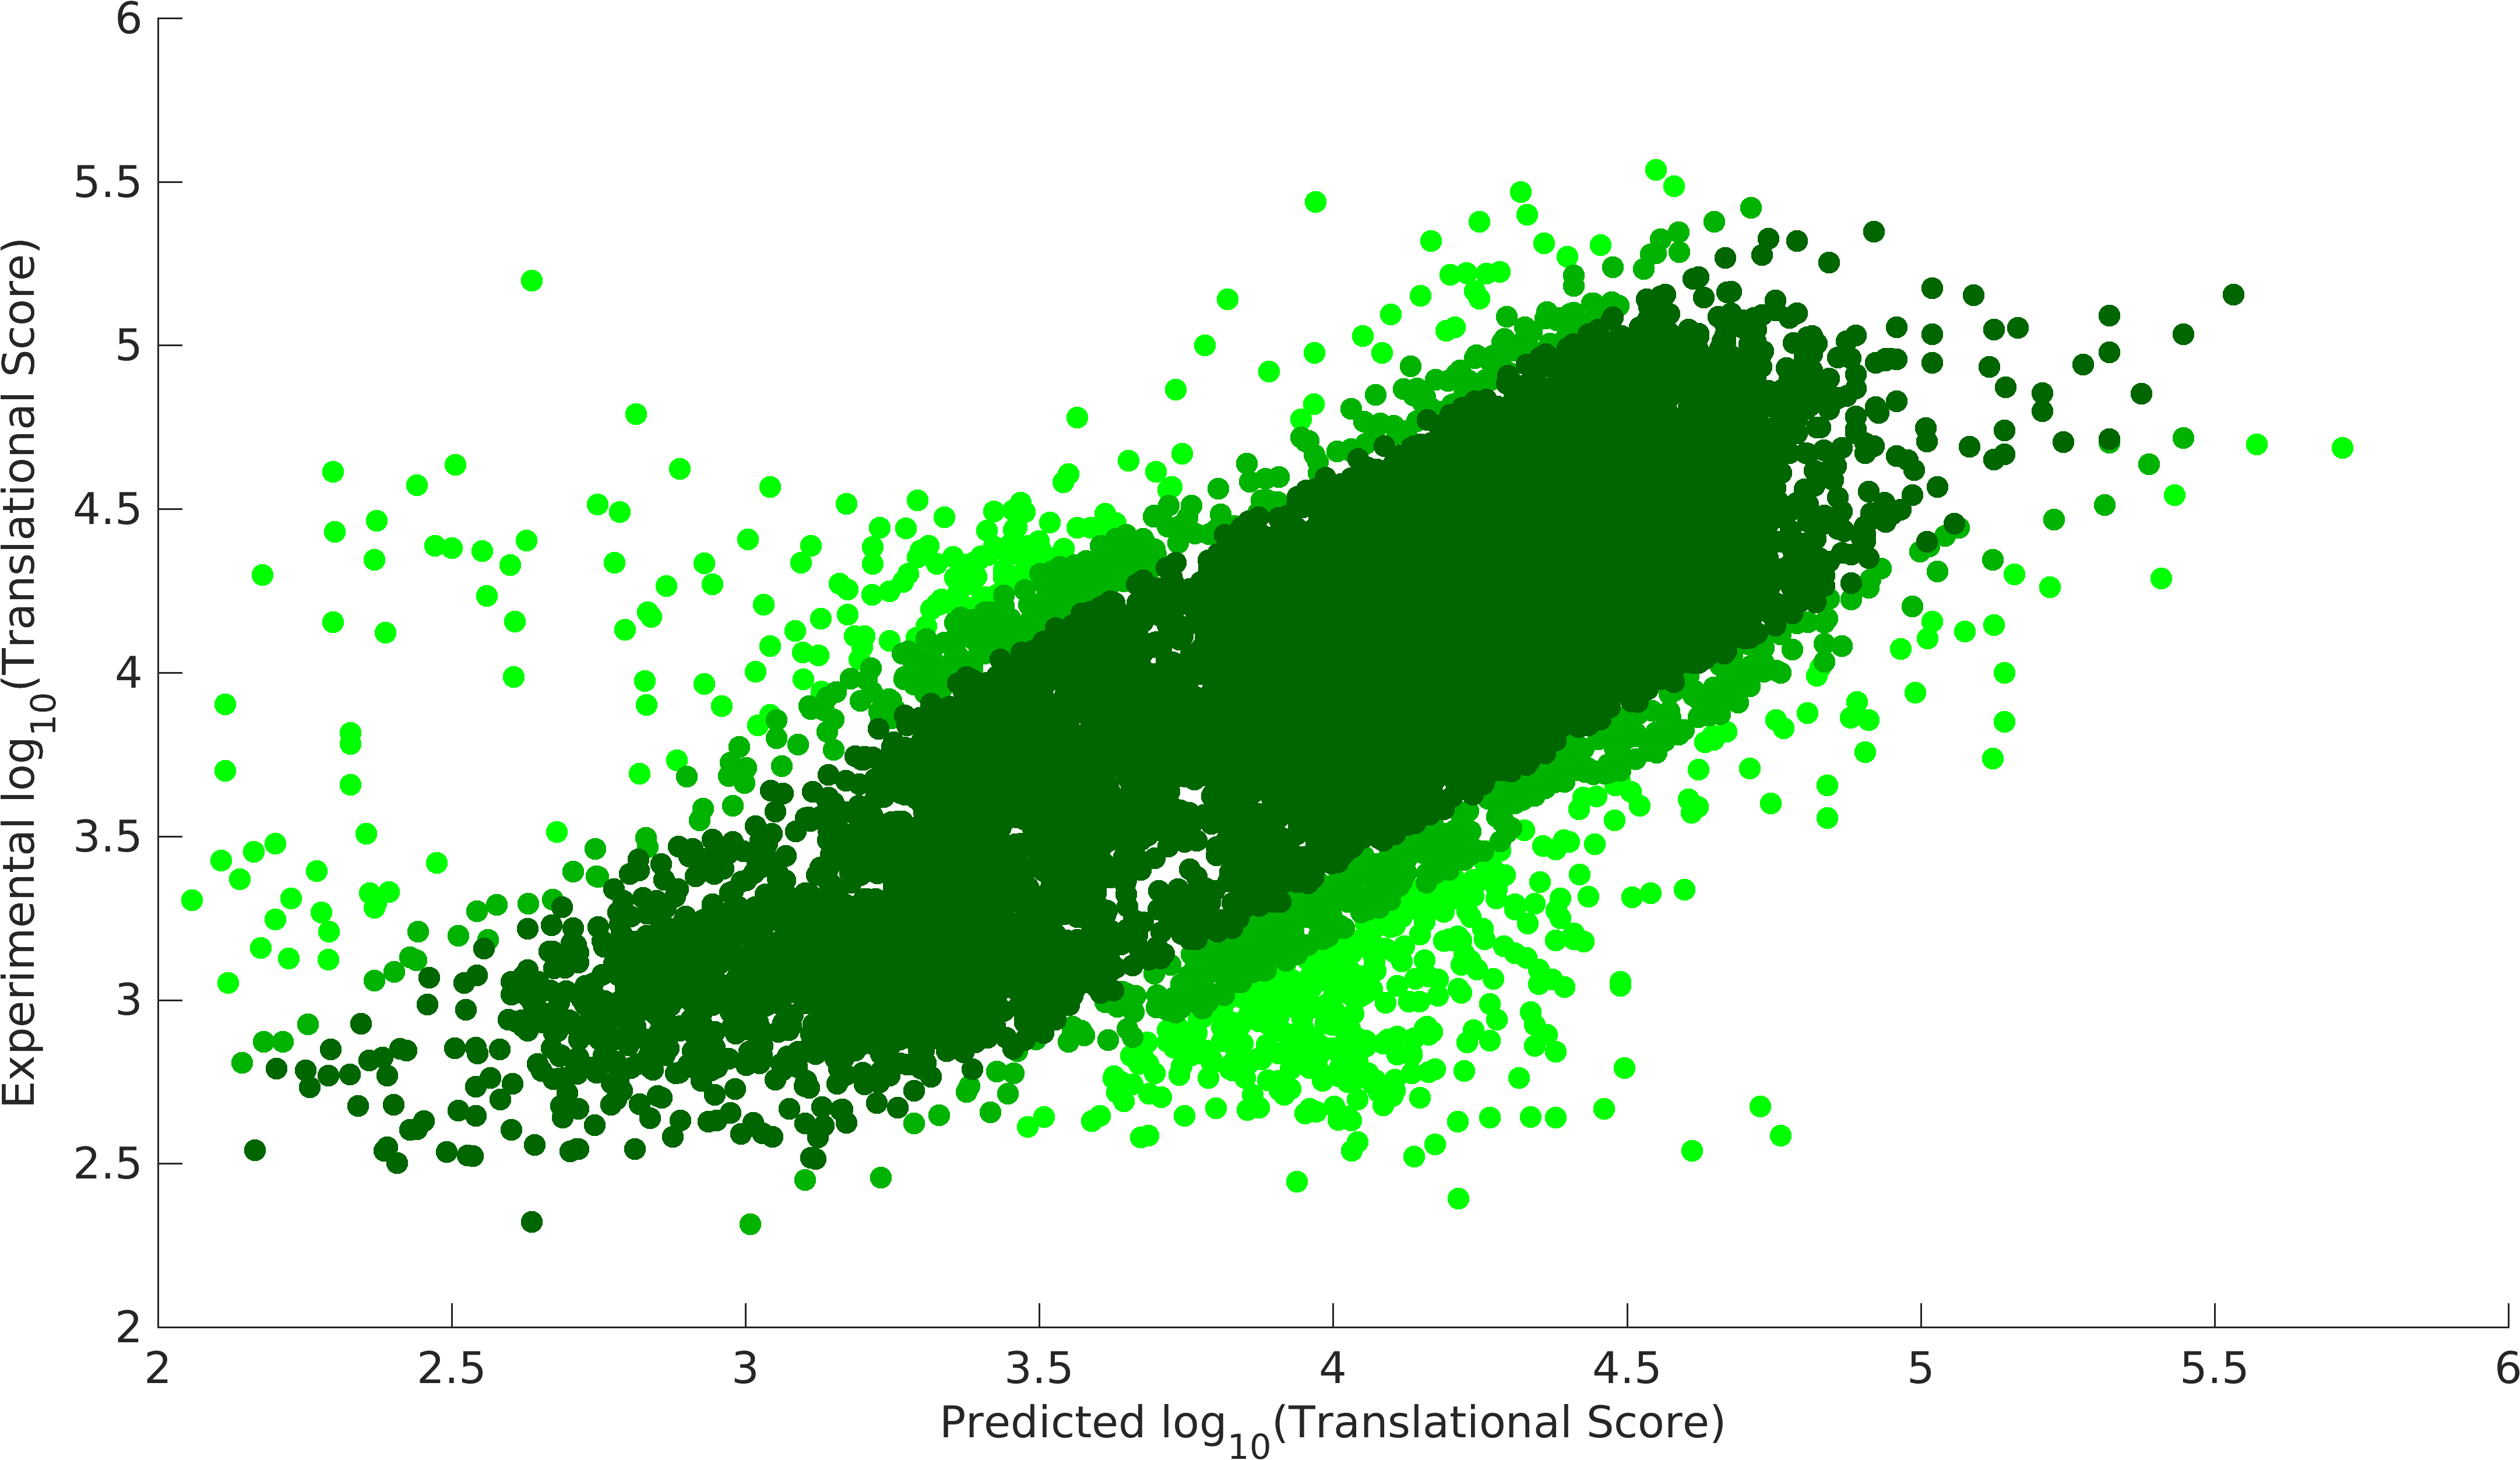
<gallery mode=nolines class=center widths=400px heights=230px caption="Validation of Model"> | <gallery mode=nolines class=center widths=400px heights=230px caption="Validation of Model"> | ||
| Line 65: | Line 65: | ||
== Results == | == Results == | ||
| − | |||
| − | |||
<gallery class=center widths=400px heights=230px> | <gallery class=center widths=400px heights=230px> | ||
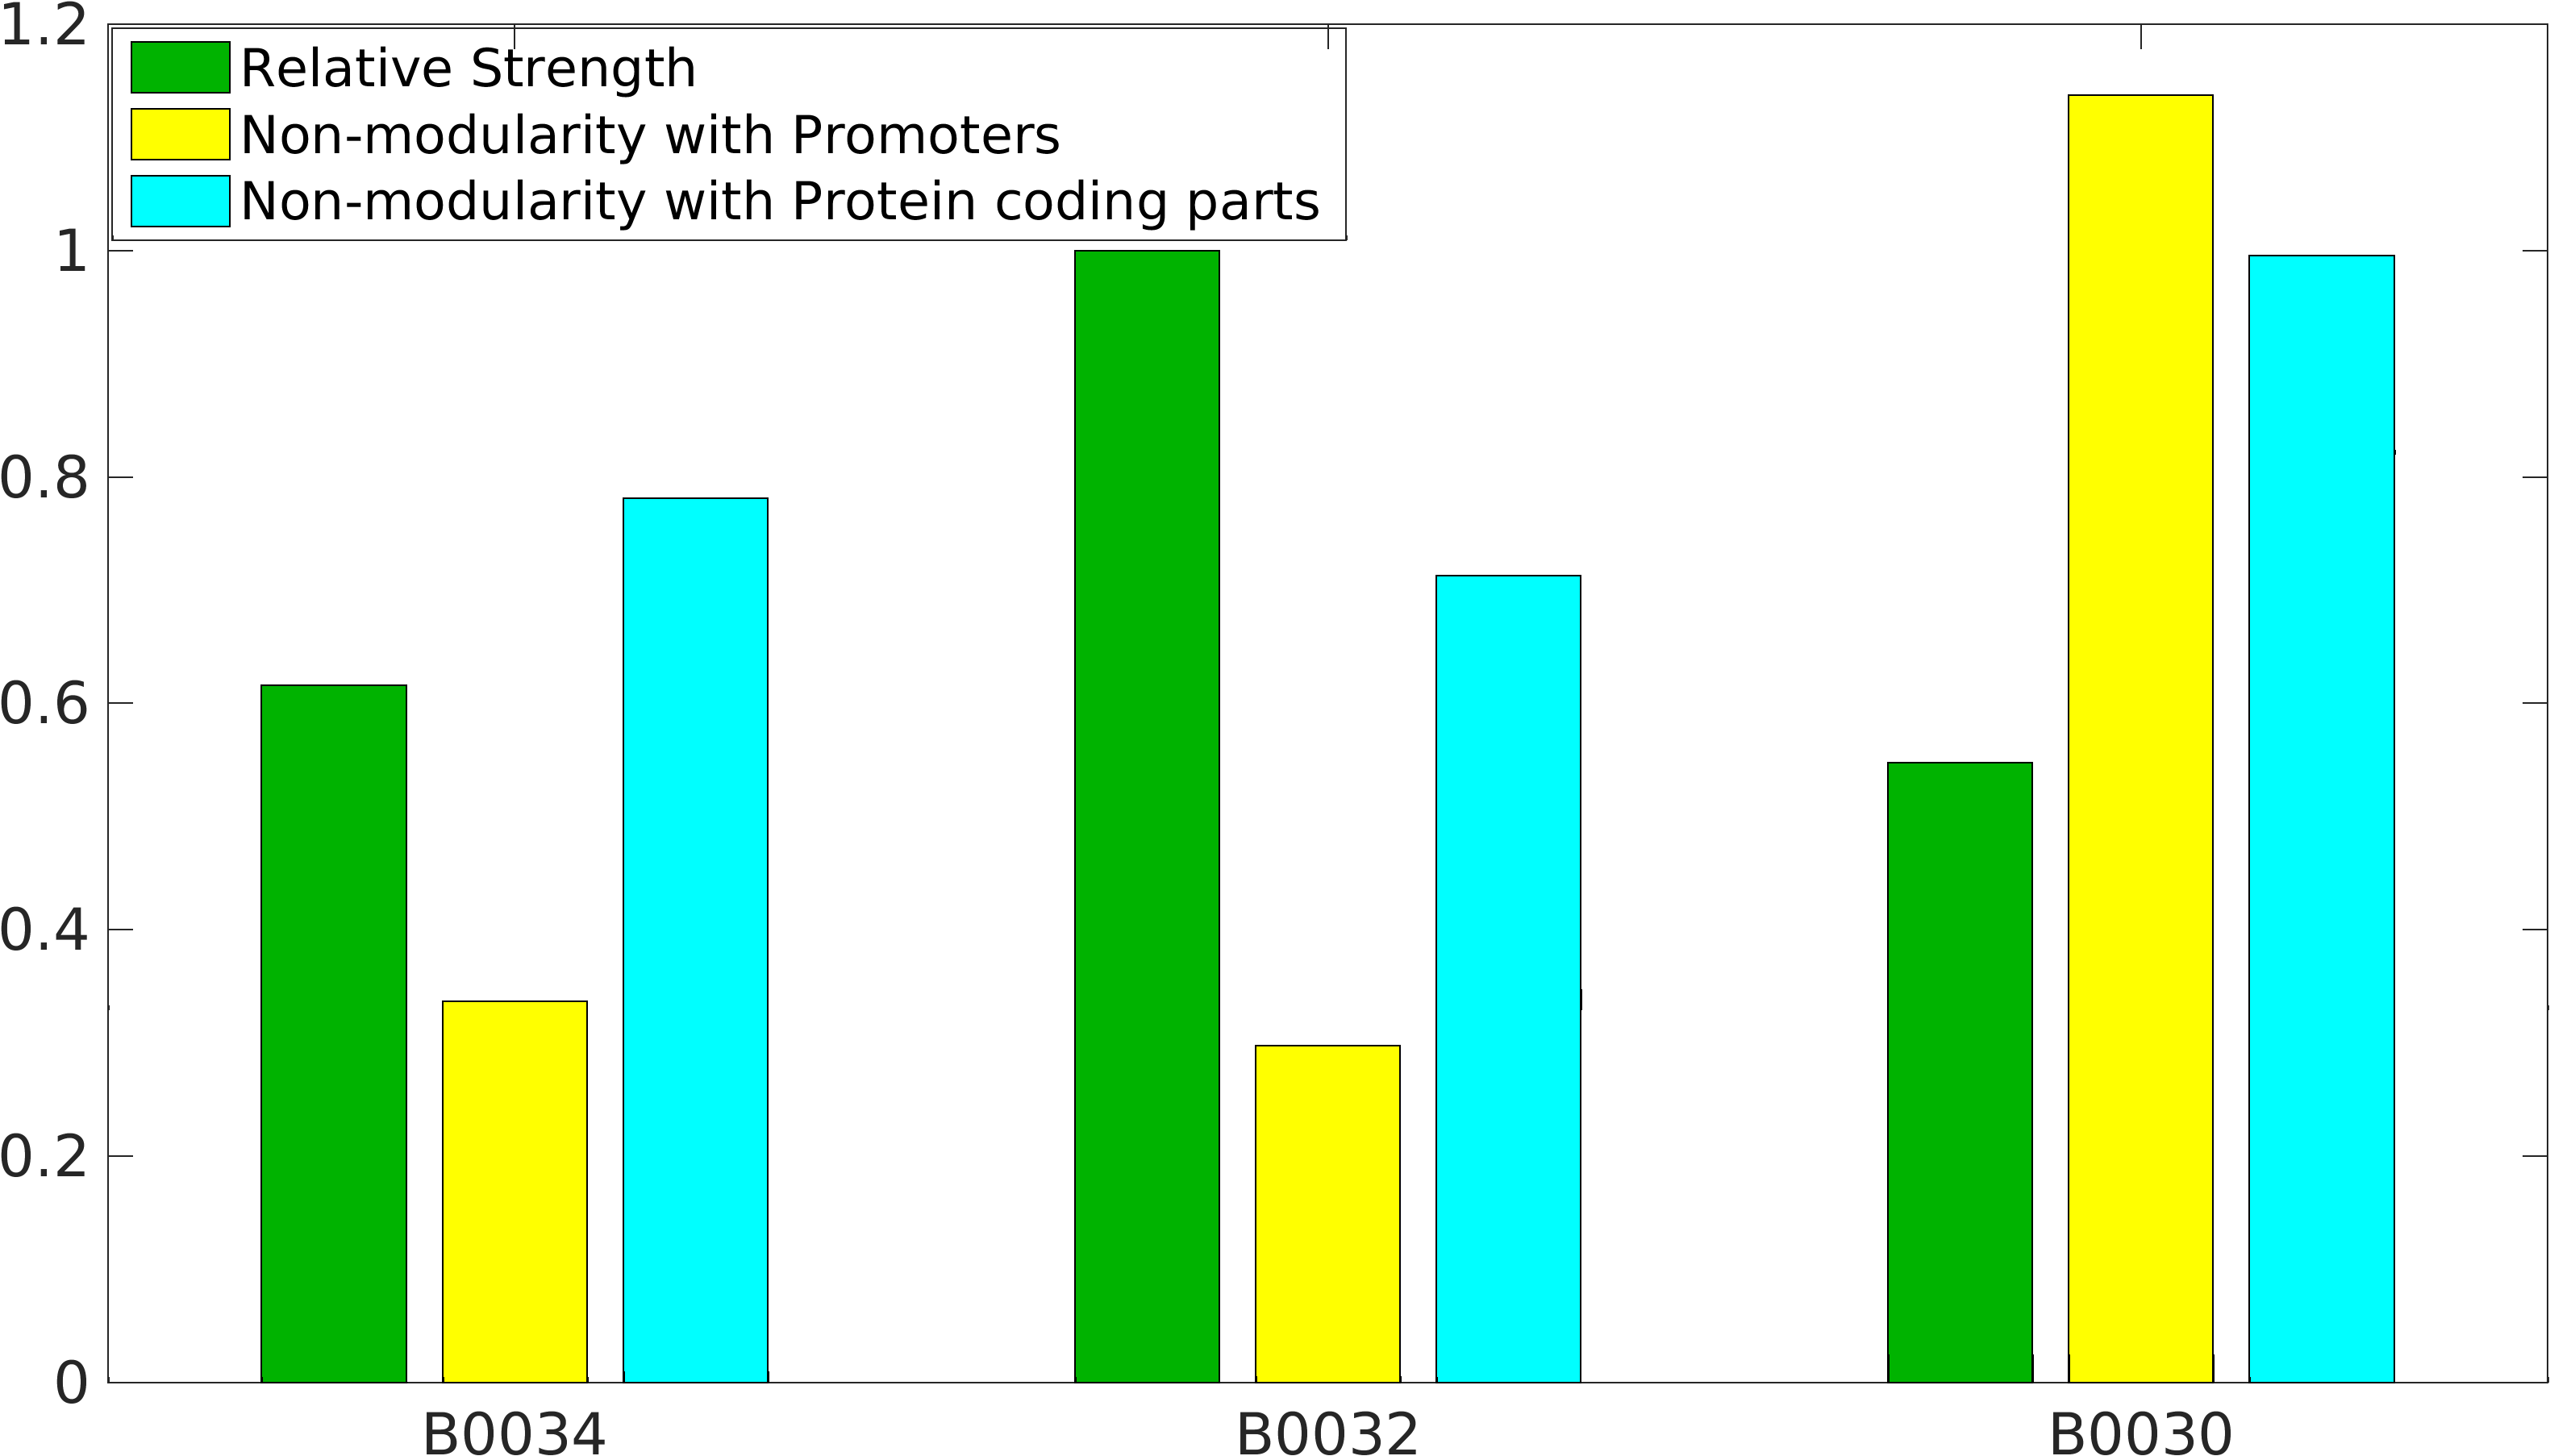
File:Rbs_strength.png|Non-modularity of RBSs with Promoters | File:Rbs_strength.png|Non-modularity of RBSs with Promoters | ||
Revision as of 00:51, 17 October 2016
Modularity of RBS parts
Introduction
Non-modular nature of Ribosomal Binding Sites in bacteria is well known to the synthetic biology community. Most of the biological parts have been assigned a strength for their functionality. For example, Promoters have transcriptional score (RNA/DNA), RBSs have translational score (Protein/RNA). Ideally, if we were to use a promoter and a RBS to produce a protein, we should get transcriptional score * translational score number of protein molecules. In bacterial cells, transcription and translation processes are coupled and can occur simultaneously. This is why, these process are not independent and, hence, not modular. Apart from this, RNA molecule consisting of RBS and first few codons may form secondary structures, which reduces translation efficiency. Also, rare codons have also been shown to influence translation efficiency.
Secondary structure's and codons' influence on translational score of RBS are ususually overlapping as they are a result of A, U, G, C combinations. Therefore, it is important to decouple both effects to unravel underlying patterns.
We have successfully validated an empirical model to predict variations in protein expression levels, which would help future iGEM teams. Here, we represent a thorough description of our work.
Methodology
The dataset from "Causes and effects of N-terminal codon bias in bacterial genes" paper was taken. Protein expression Data was available for following constructs : 2 promoters x 3 RBSs x 1781 (137x13) sfGFP variants in first 11 codons at N-terminal (3 RBS parts were B0034, B0032, B0030) and 2 promoter x 137 natural RBSs x 13 sfGFP variants in first 11 codons at N-terminal (2 Promoters were J23100 & J23108)
Hypothesis and Algorithm
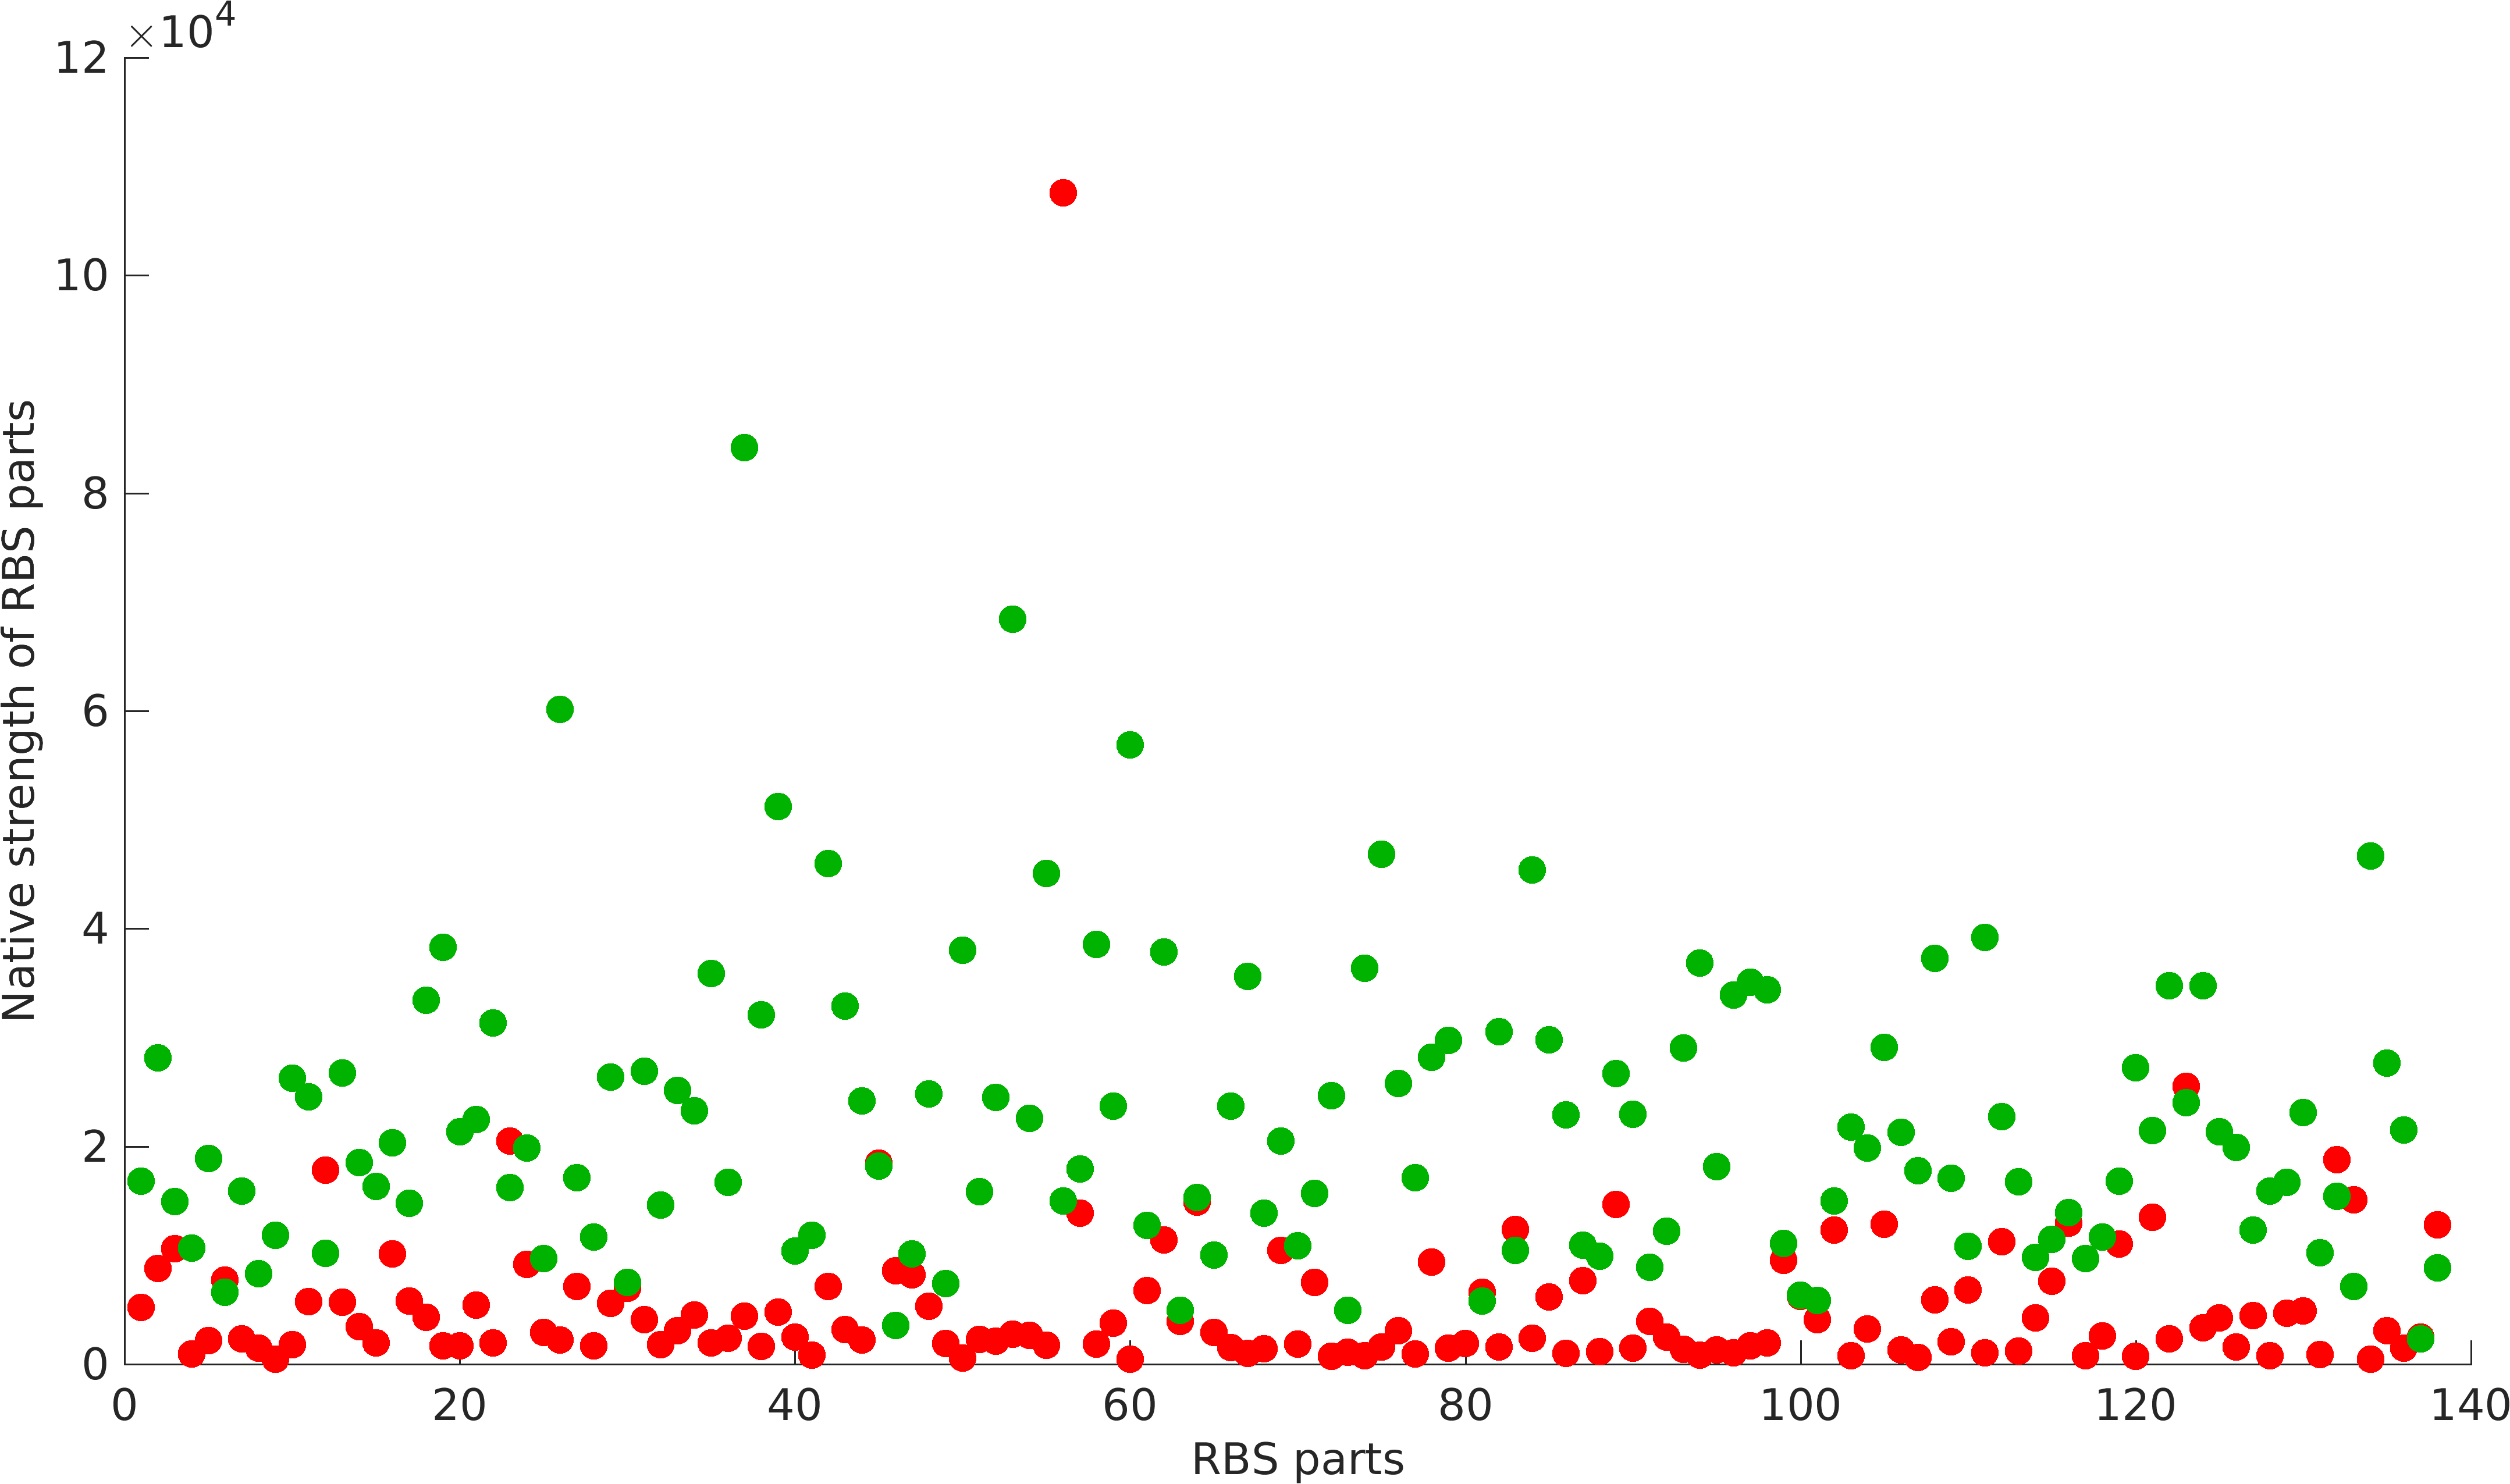
At the beginning, we hypothesized following things based on the information available in literature: Expression is inversely proportional to the stability of secondary structure of mRNA near RBS part. Rare codons present in first 11 codons of proteins have the ability to increase or decrease the translational score of RBS parts. Each RBS part has a native strength irrespective of the promoter and protein coding part it can be used with.
We designed an algorithm to compute the translational score of a given protein expressing construct in following way:
\begin{equation*} TS = \dfrac{NS*C_{pref}}{1+dG} + \alpha \end{equation*}
\begin{equation*} C_{pref}= C_{1}*C_{2}*C_{3}*...*C_{11}*C_{sfGFP} \end{equation*}
Objective function: minimize \(\sum \mid TS_{model}-TS_{experiment} \mid\)
Outlier Removal: top scores in \(\mid TS_{model}-TS_{experiment} \mid\)
where \(C_{i}\) is the codon preference of codon present at \(i^{th}\) position, \(C_{sfGFP}\) a constant for sfGFP protein codons,
TS : Translational Score of RBS part,
NS : Native Strength of RBS part, which is equal to TS at \(\delta\)G=0, \(C_{pref}\)=1;
\(\delta\)G : Stability of RNA strand consisting of RBS and first 11 codon of protein,
\(\alpha\) is a constant.
Quantification of Non-modularity
As previously mentioned, RBS have been found to be non-modular w.r.t. promoter and protein coding parts. A quantification of modularity would enable us to screen better RBS parts to make high order complex genetic circuits in high-throughput manner.
\begin{equation*} NM_p = \frac{\sigma_{NS}}{\langle {NS} \rangle} \\ NM_c = \frac{\sigma_{TS}}{\langle {TS} \rangle} \end{equation*}
where, \(NM_{p}\) is non-modularity of RBS w.r.t. promoters;
\(NM_{c}\) is non-modularity of RBS w.r.t. protein coding part;
NS is the array of native strength of RBS part with given promoters,
TS is the array of translational score of RBS part with given protein coding parts.
Optimization
Above model was optimized to compute the unknown variables, PiRi, codon matrix values, using the data from above mentioned paper. In MATLAB, fmincon function was used to minimize the sum of (model-experimental)^2 for all 14137 constructs. After several iterations of optimization, we achieved following results. Optimization was done in MATLAB on a supercomputer facility at IIT Madras.
Further, the system was optimized to by removing 5%, 10% outliers, which were computed as the top scores in |model-experimental|.
- Validation of Model
Results
We found that some codons favor the translation process, while some of this do not. Following is a list of codons, which favor the translation process:
| Codon | AAA | AAT | AGA | AGC | AGT | ATA | GAT | GGC | GGG | GGT | GTA | TCA | TCC | TCT | TGC |
|---|---|---|---|---|---|---|---|---|---|---|---|---|---|---|---|
| Amino Acid | K | N | R | S | S | I | D | G | G | G | V | S | S | S | C |
| Preference Value | 1.17 | 1.23 | 1.15 | 1.13 | 1.21 | 1.14 | 1.13 | 1.19 | 1.19 | 1.21 | 1.14 | 1.14 | 1.13 | 1.19 | 1.19 |
Following is a list of codons, which reduces the translation efficiency:
| Codon | CAC | CGC | CTC | GTC | TTC |
|---|---|---|---|---|---|
| Amino Acid | H | R | L | V | F |
| Preference Value | 0.9768 | 0.9862 | 0.979 | 0.997 | 0.993 |
A complete list of codons and their preference values are here
Conclusion
We could achieve a heuristic solution with a correlation of 0.87 with 90% of the data points. Model gives us the strength of promoter-RBS combined strength for 280 (2 promoters x 140 RBSs) combinations.
Noise in Devices
Introduction
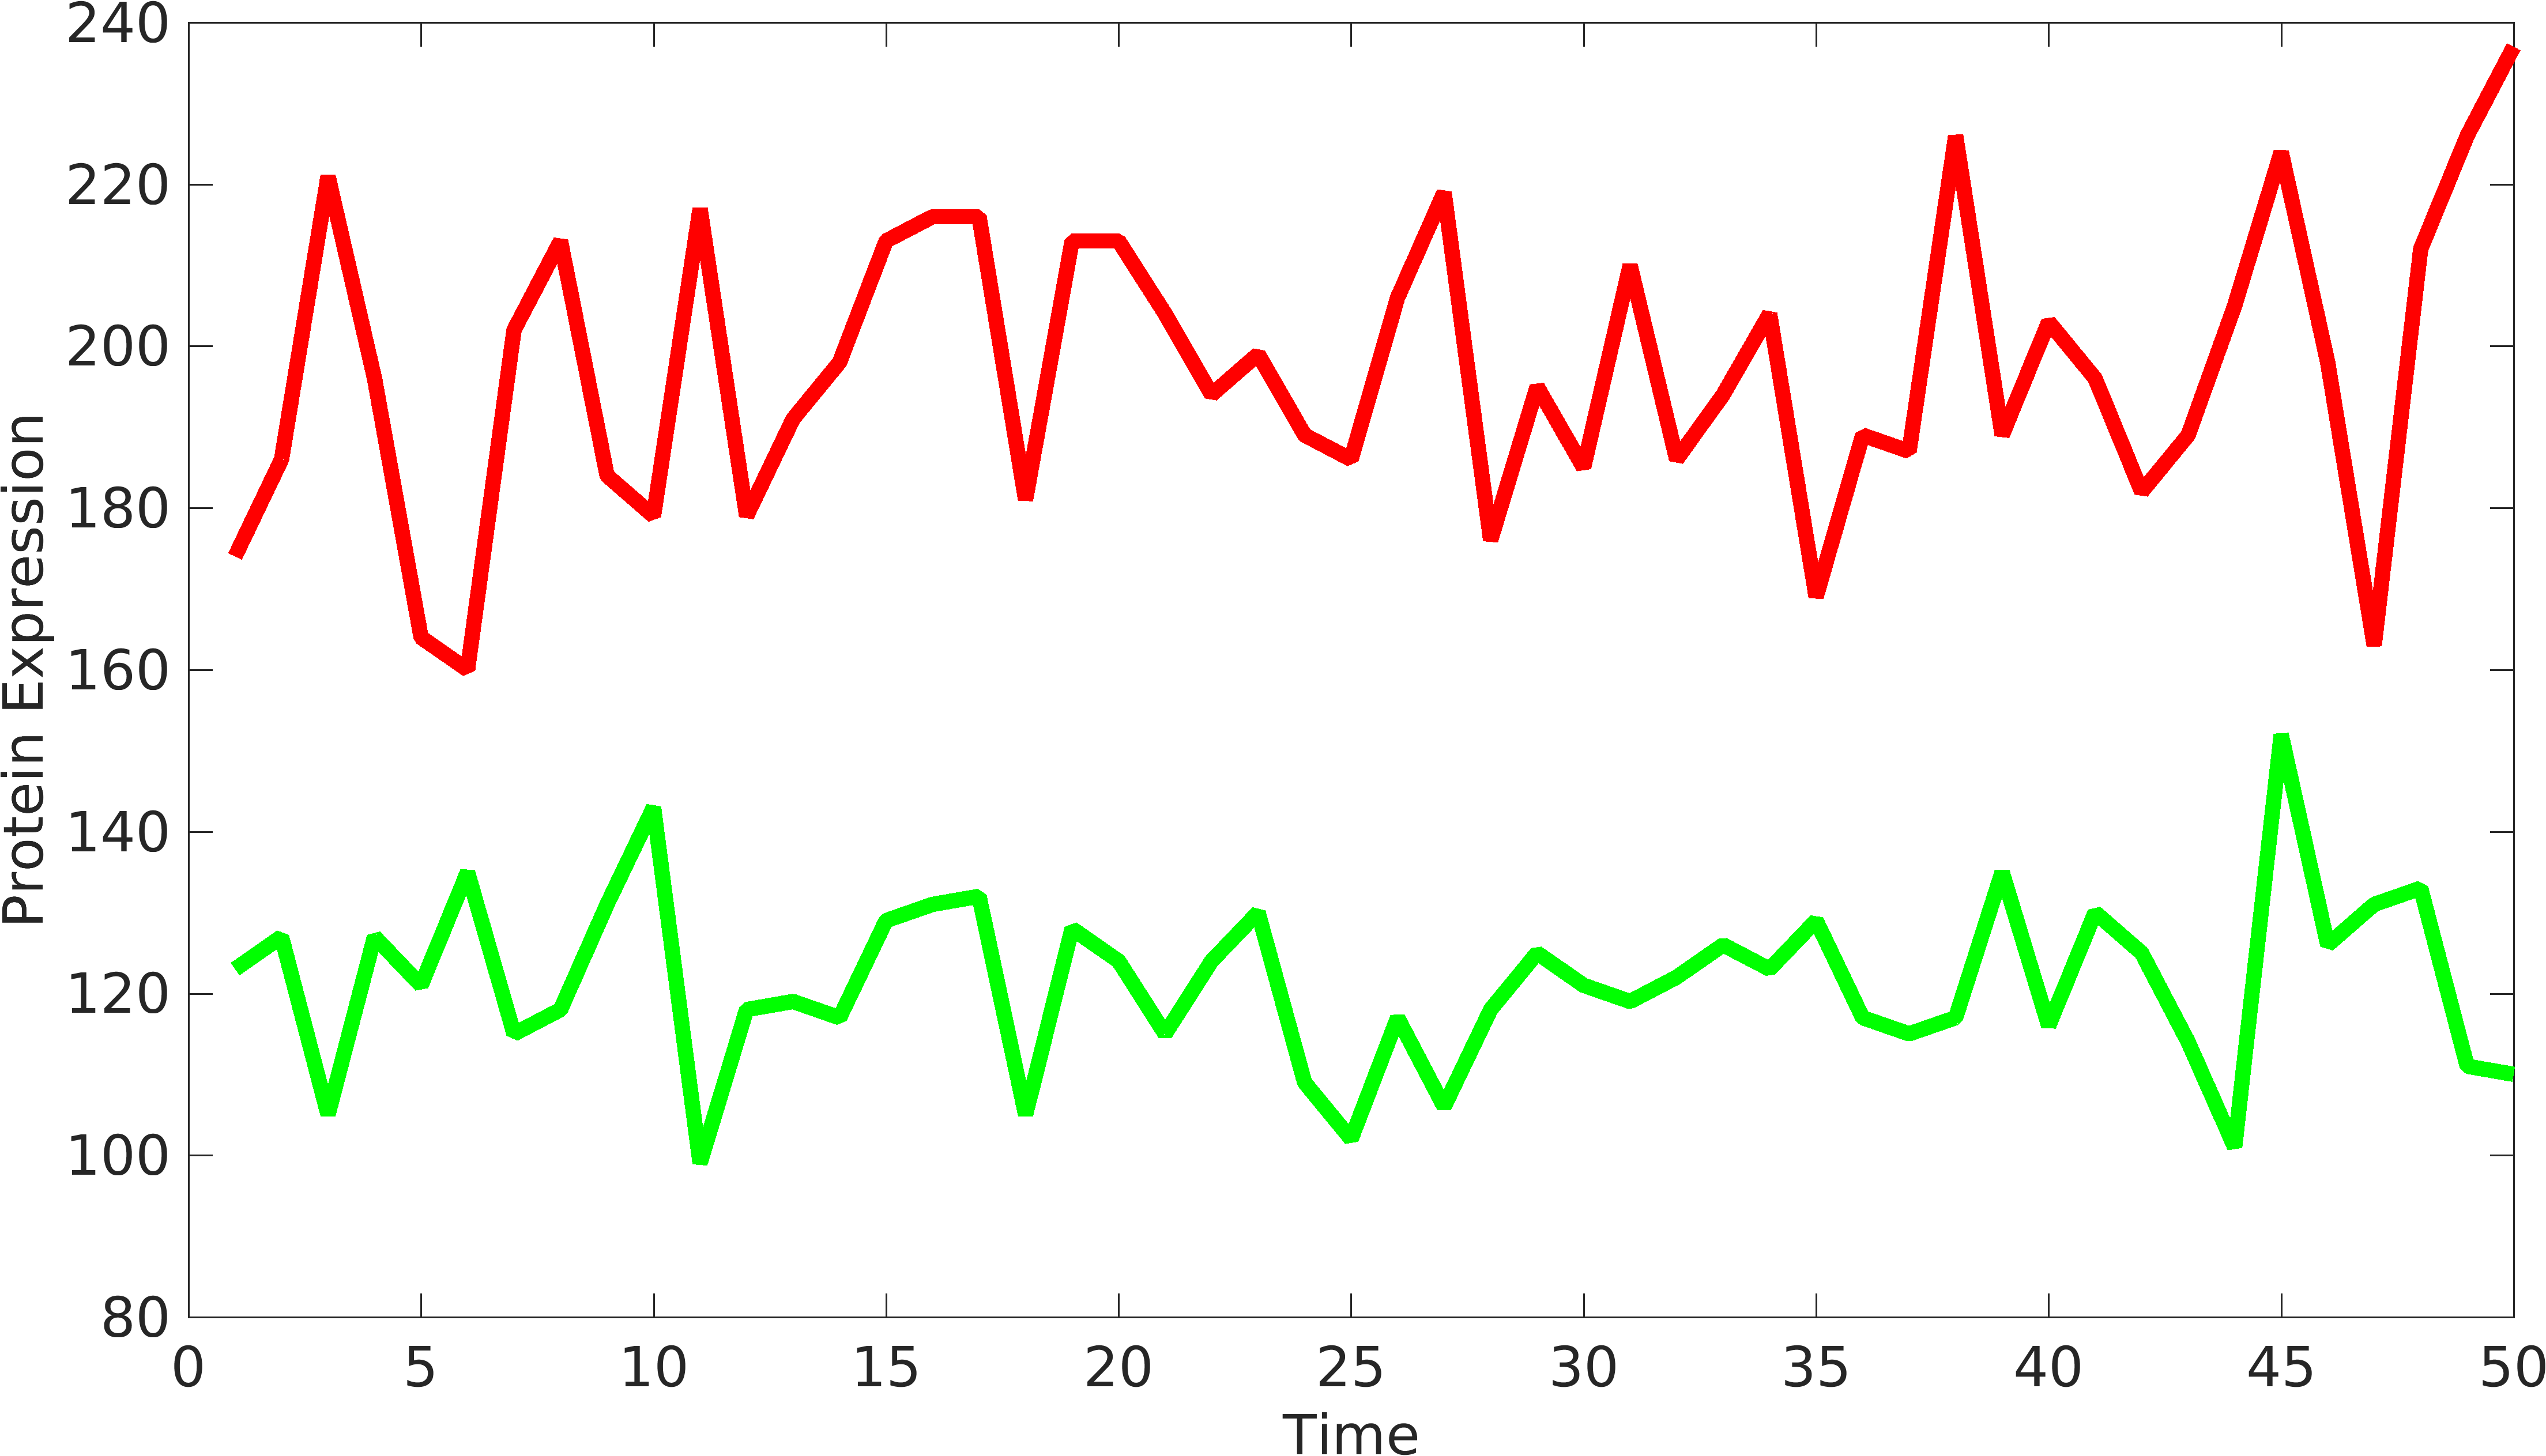
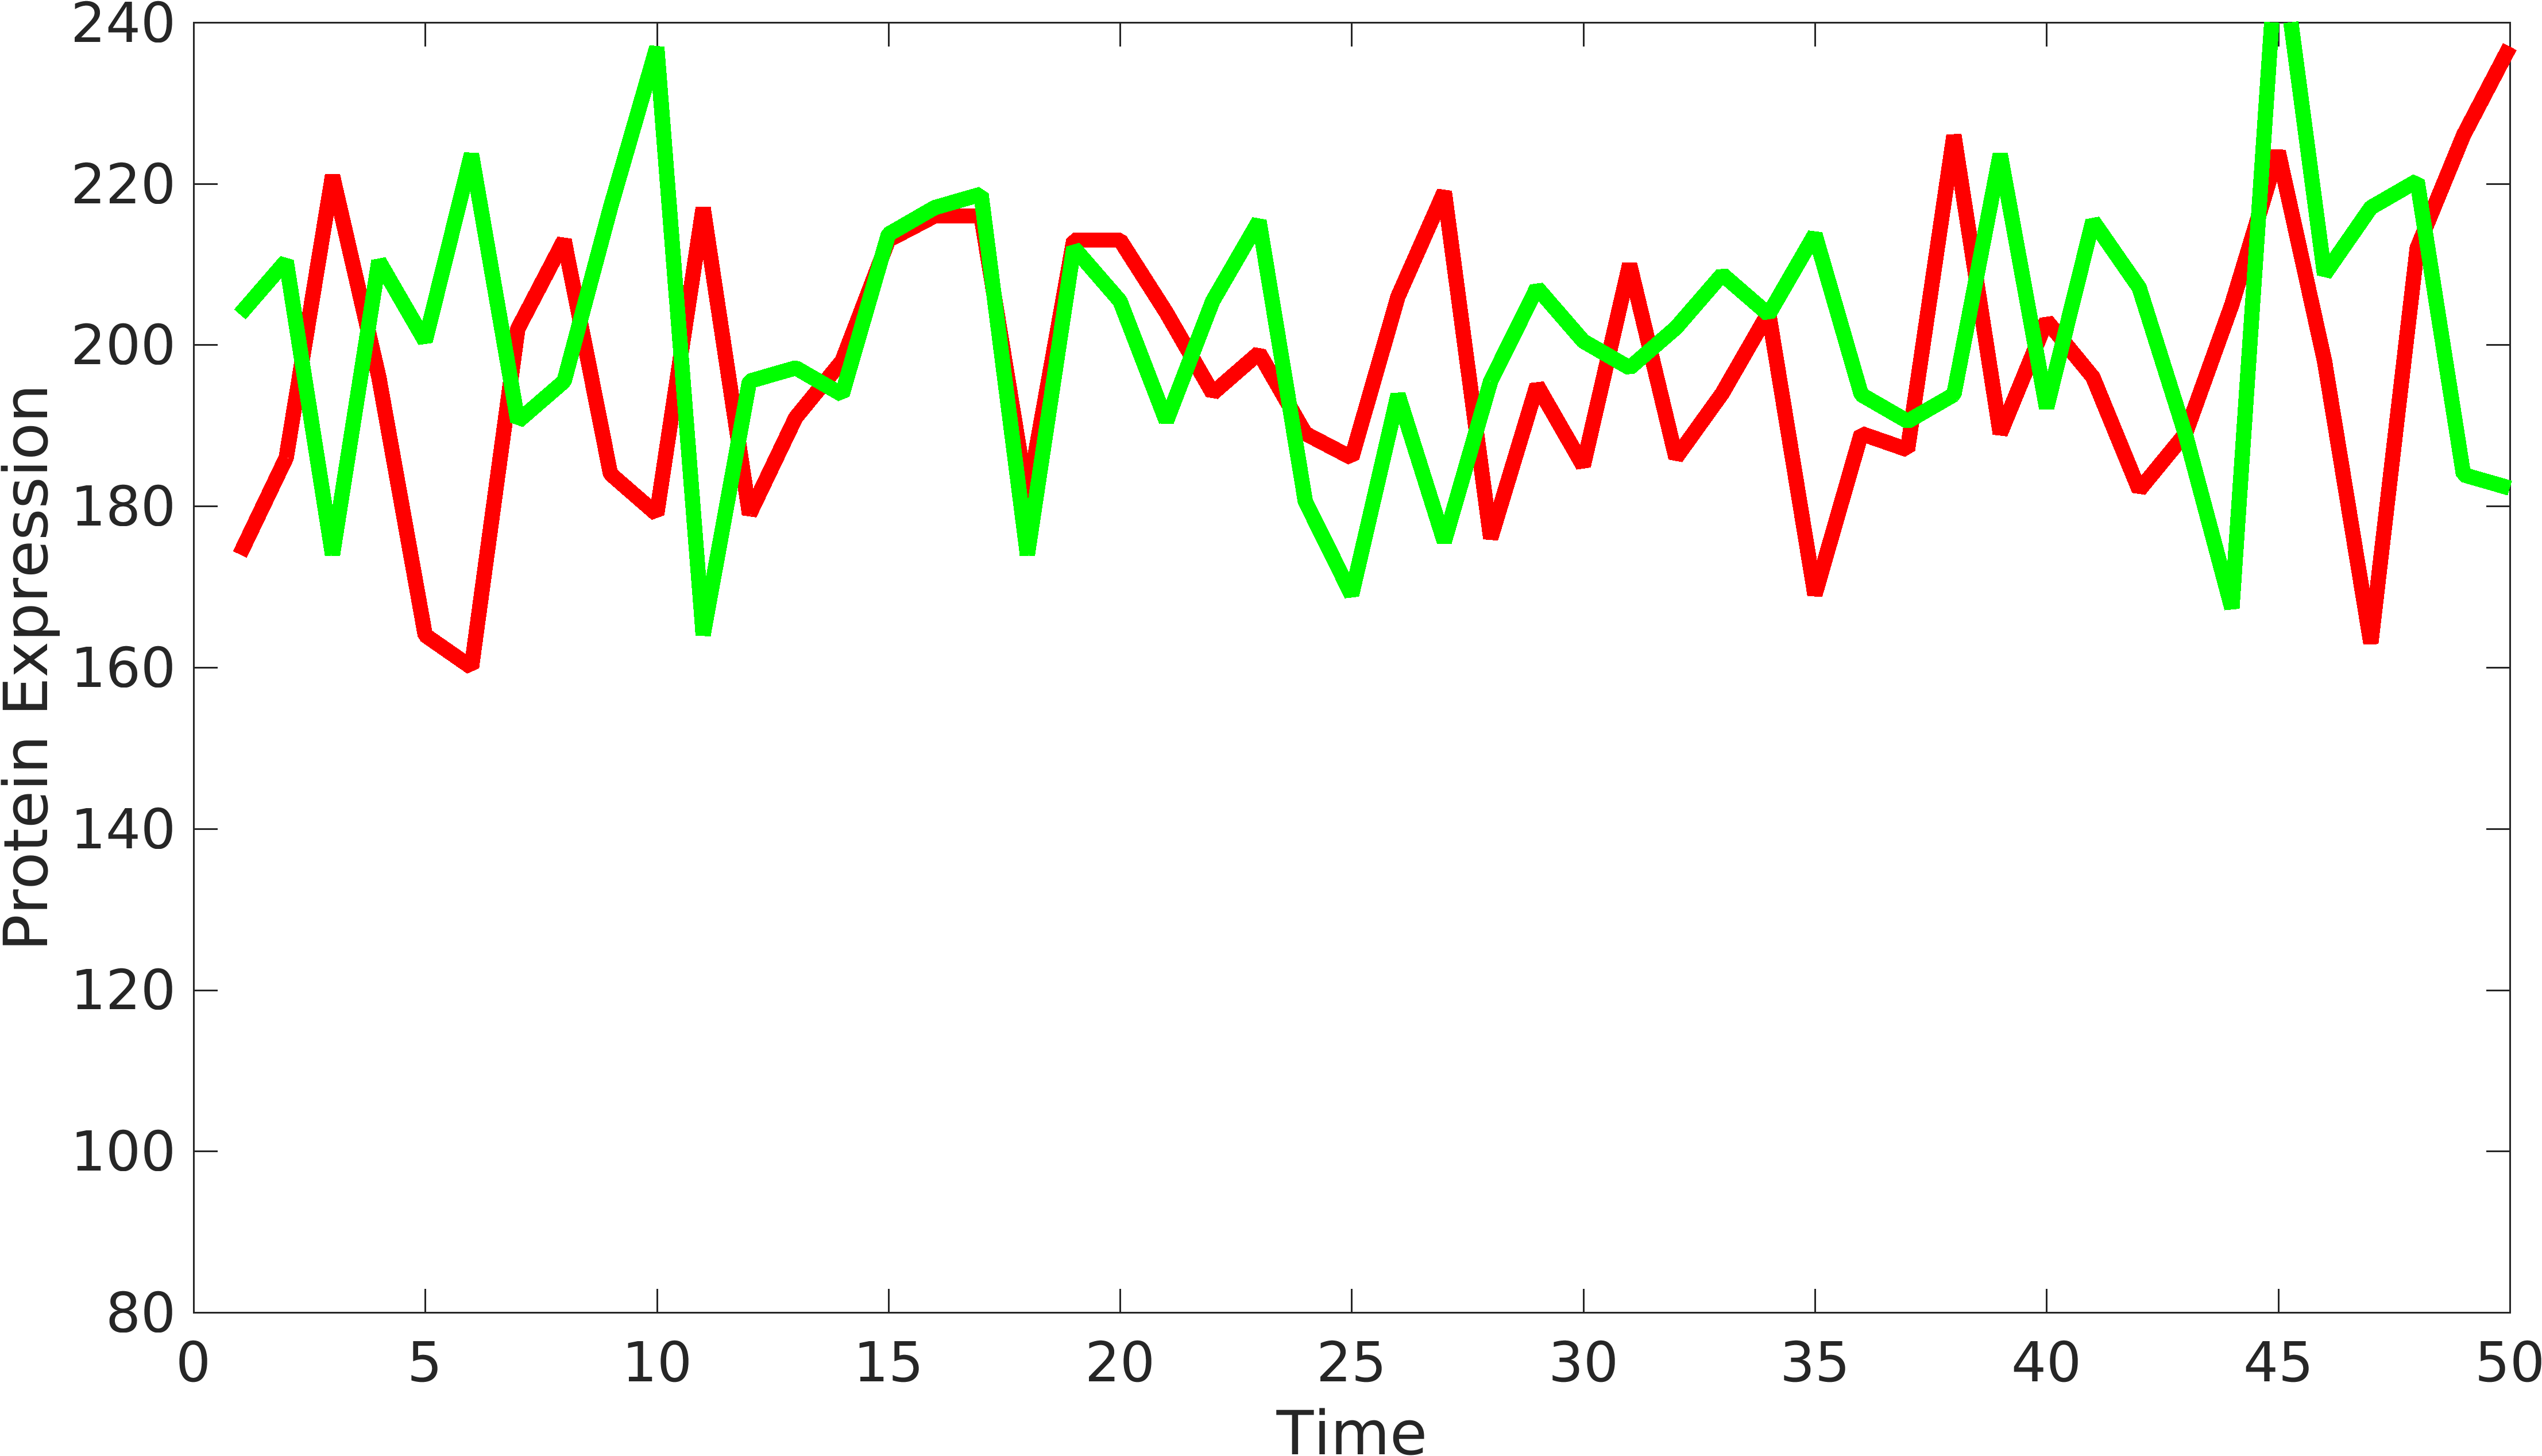
In order to understand behavior of components in devices, we require to have at least two signals coming from the device to understand the variations from intrinsic and extrinsic sources. Similarly, we can have two or more protein producing parts in complex biological devices, using which, we can understand the behavior of biological devices. Elowtiz et al has done significant work in understanding noise in biological devices.
\begin{equation*} Noise_{int}=\frac{\langle {rfp-gfp} \rangle^2}{2*\langle gfp \rangle* \langle rfp \rangle};\\ if \langle rfp \rangle > \langle gfp \rangle; Noise_{int} = \frac{{\langle rfp \rangle}^2}{2*\langle gfp \rangle*\langle rfp \rangle}; \\ Noise_{int} = \frac{\langle {rfp} \rangle}{2*\langle gfp \rangle}; \end{equation*}
Solution
\begin{equation*} gr_{fold}=\dfrac{\langle rfp \rangle}{\langle gfp \rangle} \\ Noise_{int}=\frac{\langle{rfp-gfp*gr_{fold}}\rangle^2}{2*\langle gfp \rangle*\langle rfp \rangle*gr_{fold}};\\ \end{equation*}
References
1. Goodman, Daniel B., George M. Church, and Sriram Kosuri. "Causes and effects of N-terminal codon bias in bacterial genes." Science 342.6157 (2013): 475-479.


