Team:NCKU Tainan/Software
In order to make U. coli work automatically, we developed the software to calculate the data obtained by our device and translate them into the glucose concentrations with a user-friendly interface.
The logic of the coding process is as follows:
- It calculates the production rate whenever a new data is fed
- When the production rate starts to decline, the software automatically finds out the maximum value production rate which is as the steady state.
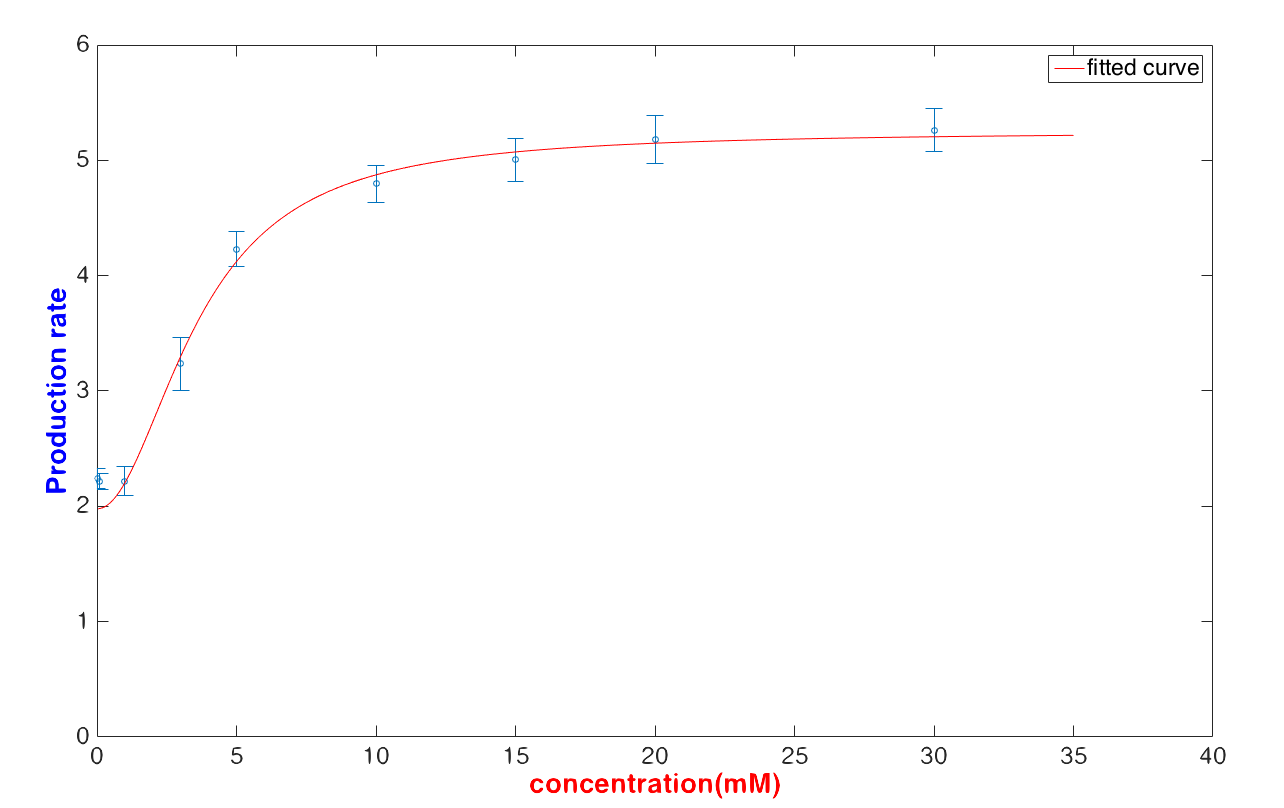
- After knowing the value production rate, it calculates the corresponding glucose concentration value by the formula we introduce in model.
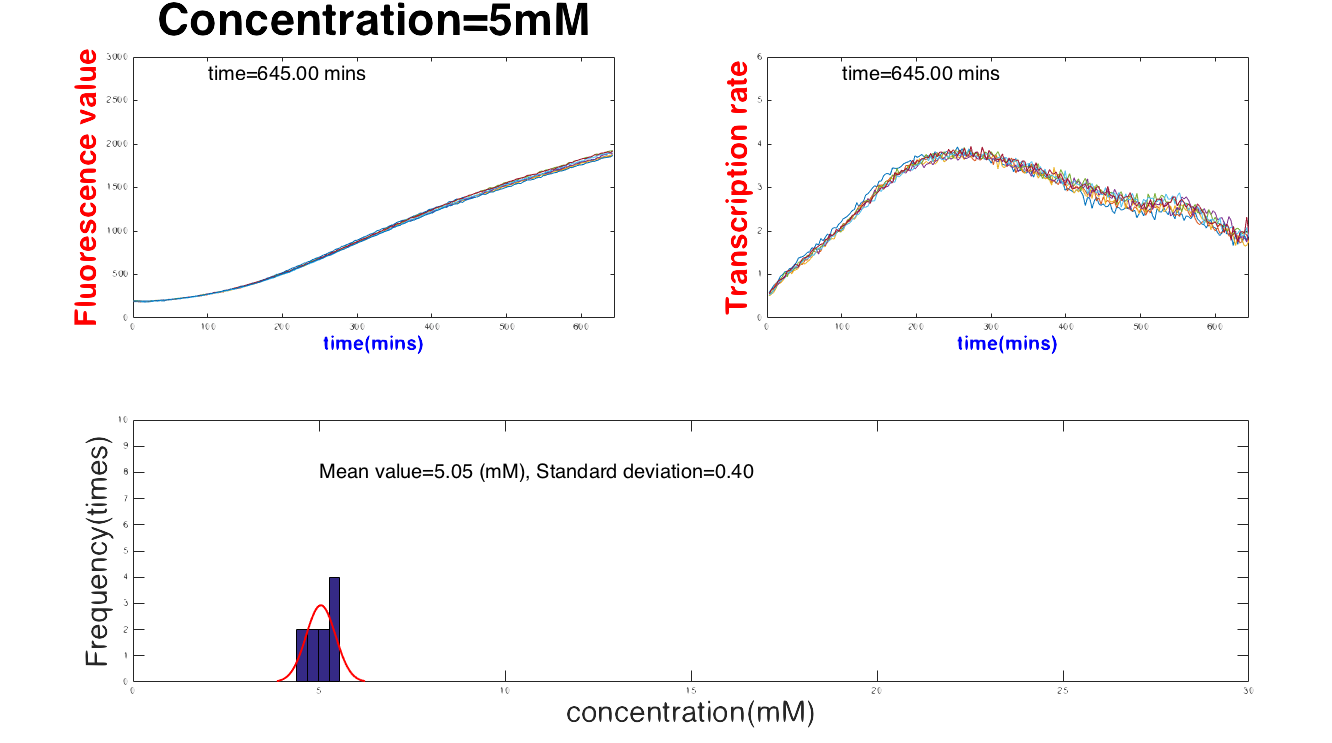
Then, the result can be divided into three parts: Safe, In danger and Emergency. As you can see in Figure 1, when glucose concentration is between 1 mM and 30 m<, our device can numerically report the glucose concentration with a mean value and standard deviation (see Figure 2).
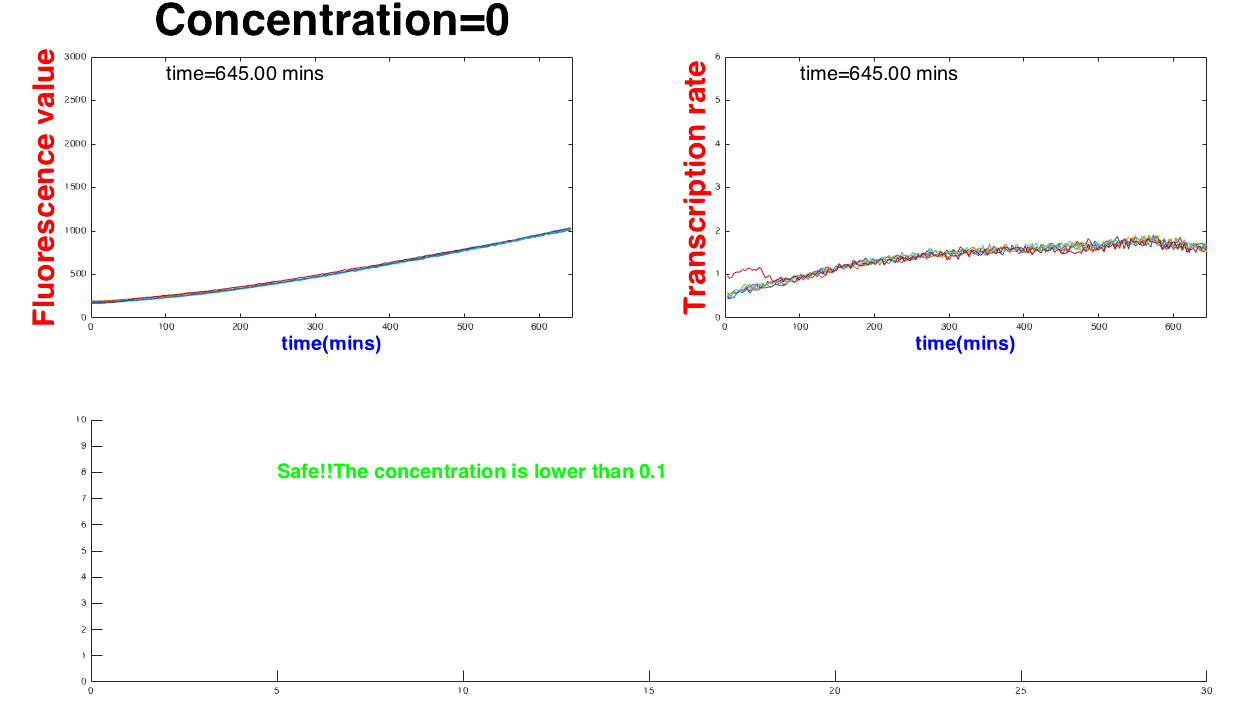
When the concentrate exceeds the range, (number of the range), the software can report the state as "Safe". On the other hans, the device would show “Emergency” whenthe concentration is abnormal, too low or "Emergency" if the concentration is too high, see Figure 3.
 (b)
(b)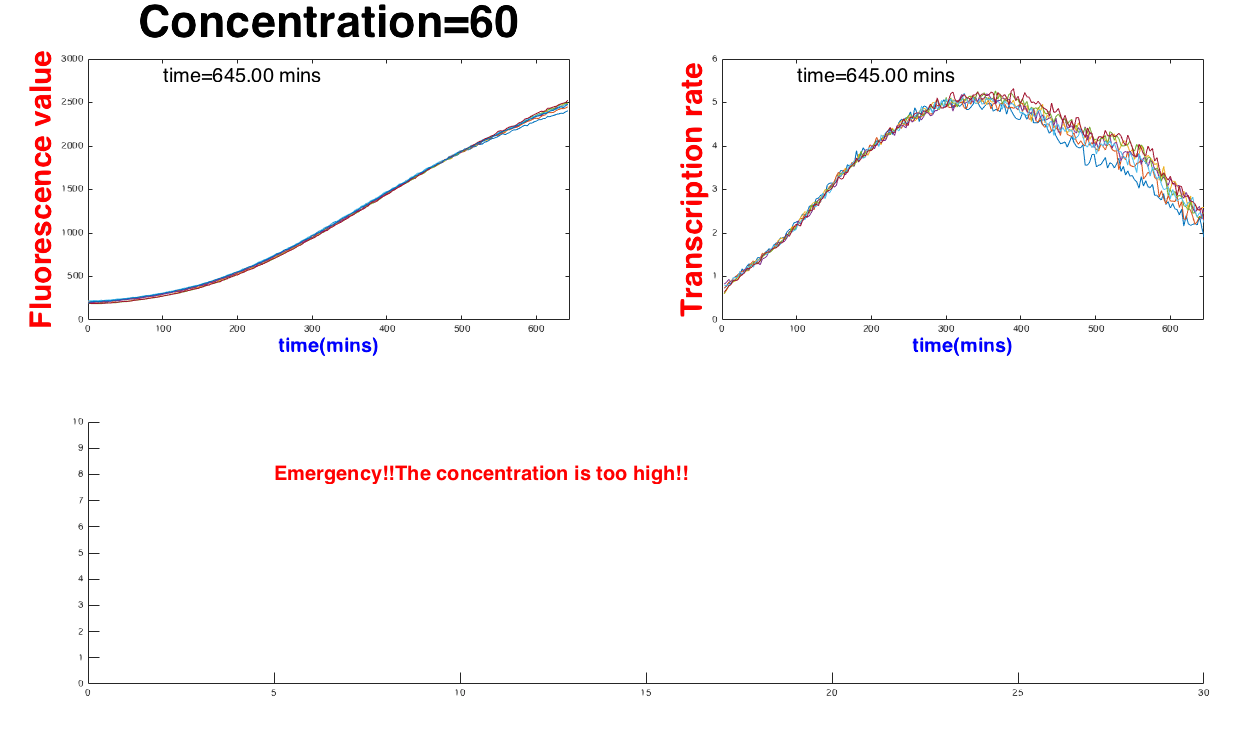
This code allows the computer automatically analyzing the data and giving a report to help our users adjust their life style by knowing the body condition.
clear all
close all
clc

%Input ten sets of data
number=10;

file = '/Users/chenshuyu/Desktop/Find Parameter/0822exp/D.csv';
%load in data set
S=load(file);

OD_time=S(:,1);
%load in the data obtained
for i=1:number
    OD(:,i)=S(:,i+1)
end

%calculate speed
for j = 1:number
    for i= 1:(length(OD_time)-1)
    Speed_time(i)=OD_time(i+1);
    Speed(i,j)=(OD(i+1,j)-OD(i,j))/(OD_time(i+1)-OD_time(i));
    end
end

%Run average every 25
for k = 1:number
   for i= 1:(length(Speed_time)-25)
    avg_time(i)=Speed_time(i);
    sum=0;
    for j=0:(25-1)
        sum=sum+Speed(i+j,k);
    end
    avg(i,k)=sum/25;
    end
end
%movie
count=1;
a = get(0,'ScreenSize');
figure('Position',[0 a(4)/50 a(3)/1 a(4)/1 ]);
for time=1:length(avg_time)

          %y=sin(freqrps*t);
          %plot(t,y);

          subplot(2,2,1)
          plot(OD_time(1:time),OD(1:time,1:8));

          %ylabel('Fluorescence value','FontSize',30,'FontWeight','bold','Color','r');
          %xlabel('time(mins)','FontSize',20,'FontWeight','bold','Color','b');
          axis([0,max(avg_time),0,3000])

          S1=sprintf('time=%.2f mins',time*3);
          text(100,2800,S1,'FontSize',20)
          %S2=sprintf('frequency=%.2f rads/sec (%.2f cyc/sec)',freqrps,freqcps);
          %text(2,.4,S2)
          xlabel('time(mins)','FontSize',20,'FontWeight','bold','Color','b');
          ylabel({'Fluorescence value'},'FontSize',30,'FontWeight','bold','Color','r');
          title('Concentration=5mM','FontSize',45)

            subplot(2,2,2)
          plot(avg_time(1:time),avg(1:time,1:7));
          axis([0,max(avg_time),0,6])
          S2=sprintf('time=%.2f mins',time*3);
          text(100,5.6,S2,'FontSize',20)
          xlabel('time(mins)','FontSize',20,'FontWeight','bold','Color','b');
          ylabel({'Transcription rate'},'FontSize',30,'FontWeight','bold','Color','r');
          %}
          M(time)=getframe;

end

%Large counting number
l=0;
%R counting number
m=1;
%movie
for k=1:number
    for i=1:length(avg_time);
        if avg(i,k)==max(avg(:,k));
            t0(k)=avg_time(i);
        end
    end
    Vmax=max(avg(:,k));
    Vmax_k(k)=Vmax;

    if Vmax >= 5
        l=l+1;
        x=-1;
    else
    %calculate the concentration due to the formula
    x=(18.6542*Vmax-38.2493)/(5.07-Vmax);
    end
    if x<=0

        continue;
    else
        R(m)=x^(1/2.0183);
        m=m+1;
    end

end

if m<=number/2

    if l>number/2
        statement='Emergency!!The concentration is too high!!'
         subplot(2,2,3:4)
    axis([0 30 0 10])
    text(5,8,statement,'FontSize',20,'FontWeight','bold','Color','r')
    else
        statement='Safe!!The concentration is lower than 0.1'
         subplot(2,2,3:4)
    axis([0 30 0 10])
    text(5,8,statement,'FontSize',20,'FontWeight','bold','Color','g')
    end

else

   subplot(2,2,3:4)
    statement=sprintf('Mean value=%.2f (mM), Standard deviation=%.2f',mean(R),std(R));
    histfit(R);

    axis([0 30 0 10])
    xlabel('concentration(mM)','Fontsize',30)
    ylabel('Frequency(times)','Fontsize',30)
    text(5,8,statement,'FontSize',20)
end
To visualize our data better, we designed an app applicable to the smart devices and displays which visualize the result from U-KNOW. The data is synchronized with the processor of Arduino. With the simple I/O Arduino user interface, we bring U-KNOW to people’s daily lives and make it available for everyone to have an easy access to embrace simple diabetes monitoring.
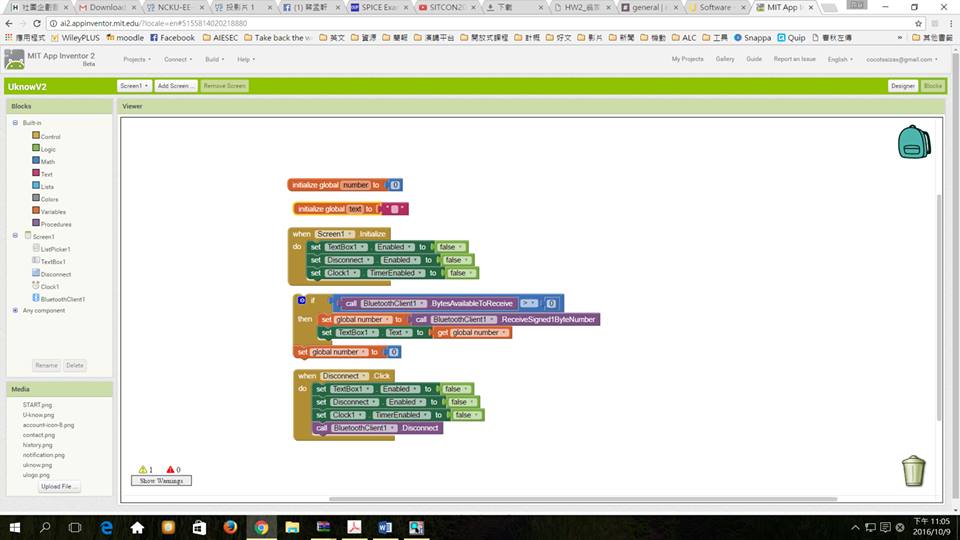
Also, by using App Inventor, we can easily code the app. It brings out one additional benefit. People who are interested to make their own U-KNOW can easily find the open resources and produce one for themselves. Even if they don’t possess strong engineering background, they are still able to be a marker. By moving these blocks, App inventor is an easy way to provide those makers the coding basics.
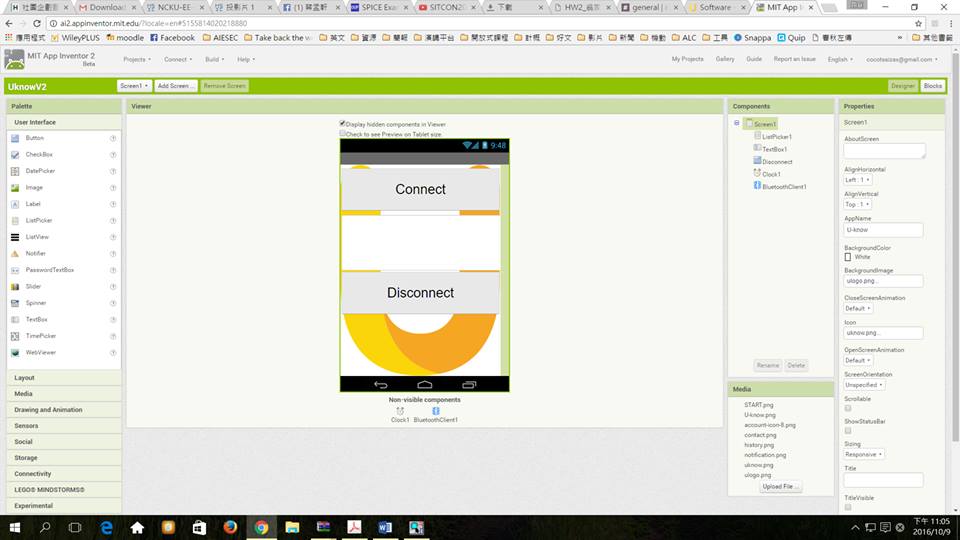
App Inventor is an open source which allows us to adopting this technology without many barriers. Using Arduino and App inventor, as open sources, enable people to build the new and innovative hardware and software that leverage this emerging technology.
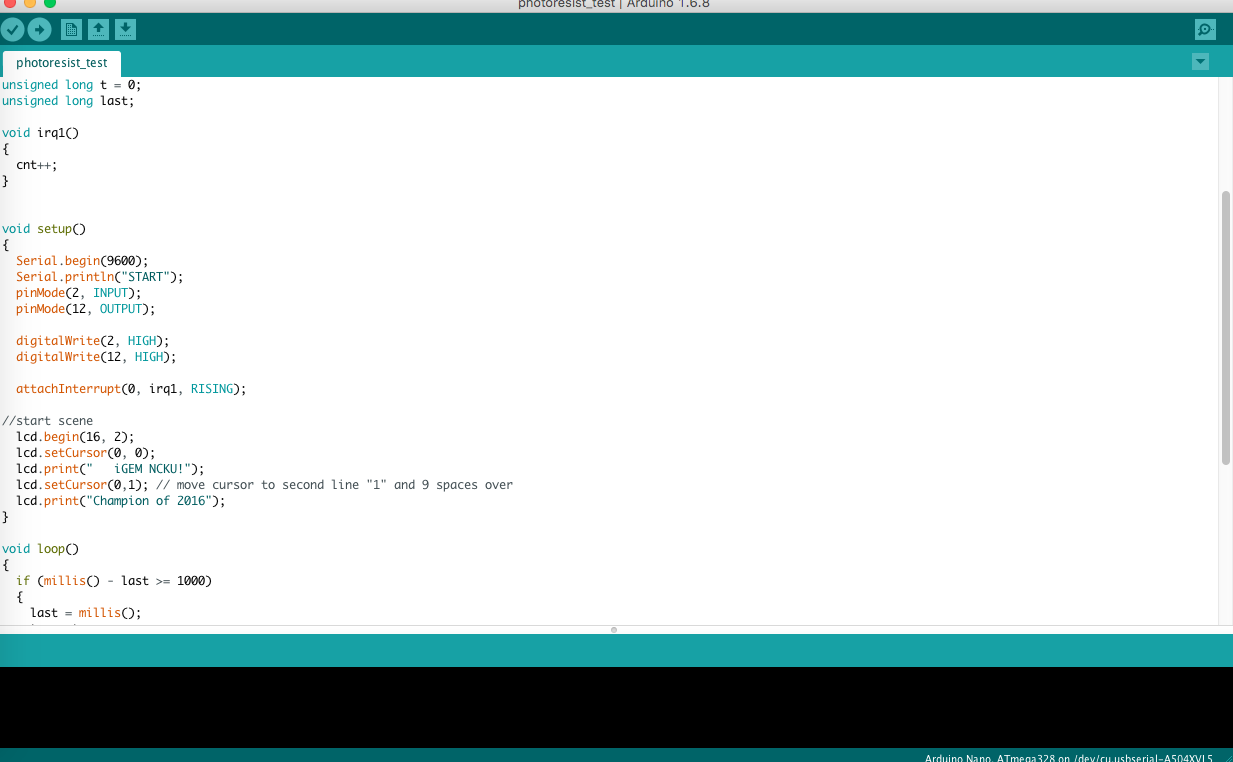
Assembling our Arduino, we use it to trigger the whole system and even digitalize bio-signals. A light sensitive resistor is adopted to transform the bio-signal into digital signal so that we can synchronize the data with the displays and smart device by Bluetooth.
The computer can automatically initiate the process and complete the function of Arduino in terms of codes. Below is the code to function U-KNOW.
/*

This is the code of our arduino device

*/

#include

// initialize lcd screen

LiquidCrystal lcd(8, 9, 4, 5, 6, 7);

volatile unsigned long cnt = 0;
unsigned long oldcnt = 0;
unsigned long t = 0;
unsigned long last;

void irq1()
{
  cnt++;
}


void setup()
{
  Serial.begin(9600);
  Serial.println("START");
  pinMode(2, INPUT);
  pinMode(12, OUTPUT);

  digitalWrite(2, HIGH);
  digitalWrite(12, HIGH);

  attachInterrupt(0, irq1, RISING);

//start scene
  lcd.begin(16, 2);
  lcd.setCursor(0, 0);
  lcd.print("   iGEM NCKU!");
  lcd.setCursor(0,1); // move cursor to second line "1" and 9 spaces over
  lcd.print("Champion of 2016");
}

void loop()
{
  if (millis() - last >= 1000)
  {
    last = millis();
    t = cnt;
    unsigned long hz = t - oldcnt;
    Serial.print("FREQ: ");
    Serial.print(hz);

    Serial.print("\t = ");
    Serial.print((hz+50)/100);  // +50 == rounding last digit
    Serial.println(" mW/m2");

    lcd.clear();
    lcd.setCursor(0,0);
    lcd.print("Result:");
    lcd.setCursor(0,1);
    lcd.print(hz);
    lcd.print(" hz");
    oldcnt = t;
  }
}