Team:BGU ISRAEL/Results
Results
Our Results
- R. ruber Growth experiments - A new discovery!
- pNP-butyrate Assay
- Electron microscopy imaging of PET degradation
- P. putida antibiotic resistances test results
- P. putida carbon source utilization results
- E. coli ethylene glycol utilization results
-
Examining the utilization of PET by E. coli expressing LC-Cutinase

-
P. putida Fuel Cell experiments
-
Characterizing E. coli growth inside a dialysis bag
-
Characterization of the co-culturing of E. coli and P. putida - a controlled symbiotic approach
- Detection of TPA in plates containing PET and E. coli using fluorescence
The bacterium Rhodococcus ruber R. ruber, known to utilize polyethylene (PE) as a carbon source, was grown in various liquid growth media with and without amino-acids and containing PE or PET pellets for a period of 30 days.
For control we used a SM liquid growth medium with glucose, glucose and amino-acids and a SM medium with no carbon source (for detailed instructions on preparation of the media see Protocols ).

Figure 1: R. ruber grown on SM liquid media with various carbon sources for a period of 30 days. Positive control is glucose and negative control is SM medium with no carbon source.
As expected the results show that growth on glucose media was substantially faster and yielded high O.D600 measurements throughout the experiment. We have observed similar results when the bacterium was grown on media containing amino acids (AA), suggesting the bacteria can utilize the AA as a carbon source. The media containing plastic as the sole carbon source (PET, PE), reached higher O.D600 values from that of a medium with no carbon source (SM medium) but lower O.D600 than on glucose media or plastic enriched with AA media. All samples have shown a steep rise in the absorbance on the first few hours of the experiment. We can assume that these results are due to the trace of rich medium that was left from the starter that was used prior to the begining of the experiment. This might also explain the increase in O.D600 values in the SM medium. Lack of values of certain samples is due to contaminations or broken equipment.
After 30 days we ceased measuring O.D600 values, but continued monitoring our samples for bacterial growth. Samples were left to incubate unopened for 3 months to test for the formation of biofilms.

Figure 2: R. ruber biofilm formation on a PE pellet.
As seen in the picture (fig. 2), after 3 months R. ruber developed a biofilm surrounding the pellet (in this case – PE). The orange color is a unique property of R. ruber.
We have witnessed similar results with PET pellets, suggesting R. ruber can also utilize PET as a sole carbon source.
We took samples from both PET and PE media (with pellets) and examined them with a Phase-contrast microscope and scanning electron microscope (SEM):

Figure 3: An image taken with a Phase-contrast microscope from SM media with PET after incubation with R. ruber.
First, we could see that R. ruber was present in its planktonic form in the media.

Figure 4: An image taken with a Phase-contrast microscope from SM media with PET after incubation with R. ruber. In the center we notice a large vacuole we bacteria inside.
After further examining the images we noticed the formation of vacuoles close to aggregates of bacteria. We assumed the vacuoles are made up of Extracellular polymeric substance (EPS) that was secreted by the bacteria into the media. We speculated that in this case the EPS is used for the absorption of the PET micro particles and allows the accumulation of secreted enzymes. The enzymes are used to catalyze the initial cleavage of the polymer and allow absorption of nutrients (Laspidou et al 2002). These images suggest a mechanism to improve degradation by increasing the extracellular degrading enzyme concentrations.
More samples from the same experiment were analyzed using SEM:

Figure 5: A scanning electron microscope image of an untreated PE pellet in a X1000 magnification.

Figure 6: A scanning electron microscope image of a PE pellet after 30 days of incubation with R. ruber in a X1000 magnification.
As seen from the images above, there is a substantial difference between the surfaces textures. The control's (fig. 5) surface is rough while the treated one is smoother (fig. 6). It can be explained by the ability of bacteria, i.e. its enzymes, to degrade exposed and less dense polymers with more ease, smoothening the outer layer.
We performed SEM on the PET samples in order to examine if the same effect on the polymer's surface is observed:

Figure 7: A scanning electron microscope image of an untreated PET pellet in a X10,000 magnification.

Figure 8: A scanning electron microscope image of a PET pellet after 30 days of incubation with R. ruber in a X10,000 magnification.
Contrary to our expectations, the untreated PET surface is smooth while the treated sample’s surface seemed to have gone through degradation (fig. 8).
Furthermore, we have come to notice the appearance of crystalline rods near bacteria aggregation sites. That can be explained by the preferential degradation of the amorphous material exposing the better defined (higher crystallinity) material that goes through a slower degradation (Shah et al 2008).

Figure 9: A scanning electron microscope image of a PET pellet after 30 days of incubation with R. ruber in a X2,500 magnification.
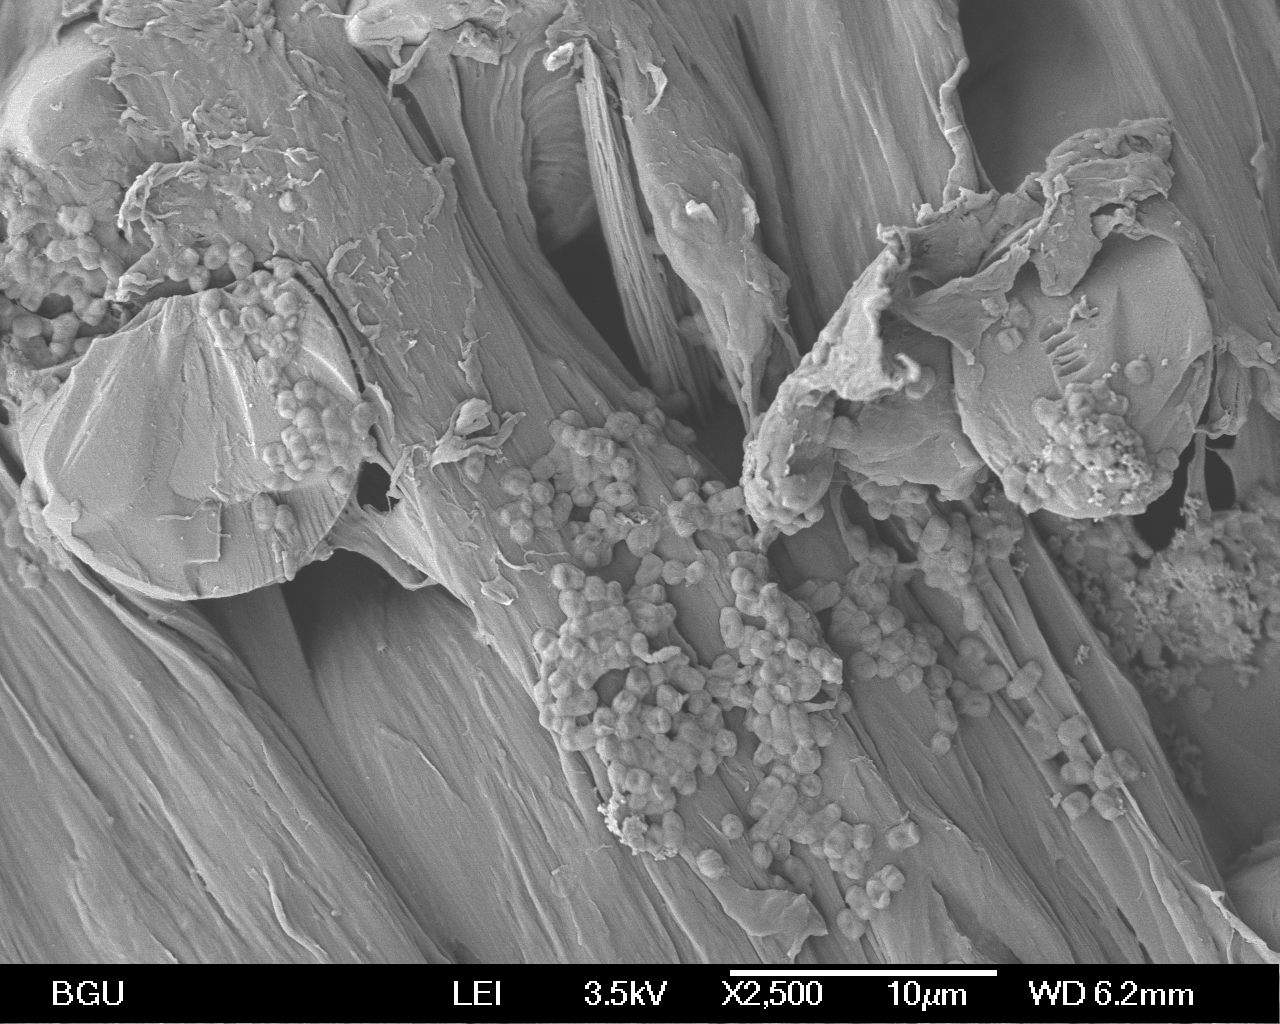
Figure 10: A scanning electron microscope image of a PET pellet after 30 days of incubation with R. ruber in a X2,500 magnification.

Figure 11: A scanning electron microscope image of a PET pellet after 30 days of incubation with R. ruber in a X2,500 magnification.
Our results suggest that R. ruber is able to degrade PET, having presented substantial changes before and after incubation with PET. It should be mentioned that it is not yet established that R. ruber is able to utilize PET as a carbon source.
In order to verify this possibility, more tests are needed.
After identifying R. ruber's mechanisms of plastic degradation such as secretion of polymer degrading enzymes and forming vacuoles from EPS to increase the extracellular enzyme concentration,
we decided to concentrate our efforts on improving a PET degrading enzyme.
It is important to note, that to the best of our knowledge, this is the first time that PET degradation by R. ruber is reported.
References
- Laspidou, C. S., & Rittmann, B. E. (2002). A unified theory for extracellular polymeric substances, soluble microbial products, and active and inert biomass. Water Research, 36(11), 2711-2720.
- Shah, A. A., Hasan, F., Hameed, A., & Ahmed, S. (2008). Biological degradation of plastics: a comprehensive review. Biotechnology advances, 26(3), 246-265.
One method to assess the activity of our designed mutants was using the pNP-butyrate (pNP-B) degradation assay
(see Protocols).
We ran the tests on all 5 variants of the LC-Cutinase protein with different concentrations of the substrate:

Figure 12: pNP-Butyrate degradation activity of all LC-Cutinase variants and W.T. at a substrate concentration of 50μM. For control we used E. coli strain BL-21 without any vector ("BL-21") with pACYC plasmid backbone only ("pACYC").

Figure 13: pNP-Butyrate degradation activity of all LC-Cutinase variants and W.T. at a substrate concentration of 125μM. Controls are the same as with 50μM concentration.

Figure 14: pNP-Butyrate degradation activity of all LC-Cutinase variants and W.T. at a substrate concentration of 250μM. Controls are the same as with 50μM concentration.
As seen from these results, all of our variants, including the codon-optimized Cutinase, have shown increased pNP-B degradation activity compared to the W.T. LC-Cutinase in all concentrations tested.
We can also see that the highest activity is displayed by the codon-optimized(CO) Cutinase, followed by the F4 mutant.
These test were preformed by incubating the substrate with a supernatant from LC-Cutinase expressing bacteria and not taking into consideration the different expression levels of each variant. Even though later tests with R. ruber show that the concentration of enzyme is an important part in efficiency of degradation, we still decided to run these tests again, with equal enzyme concentrations on our 2 fastest variants - CO and F4:

Figure 15: pNP-Butyrate degradation activity of 3 LC-Cutinase variants - CO, F4 and the W.T., at a substrate concentration of 125μM. Enzyme concentration is 0.11mg/ml.
Again, we can see that the CO and F4 variants have higher activity in regards to pNP-B degradation than the W.T. Cutinase. The CO Cutinase is once again with the highest activity, suggesting that expression levels are not a major determinant in its pNP-B degradation activity.
To calculate the amount of improvement in activity of our variants we constructed a Lineweaver-burk plot using the following protocol:
A pNP-Butyrate stock were prepared with 25 mM Tris-HCl (pH 8.0) and pNP-Butyrate in concentrations ranging from 50 μM to 2000 μM.
Enzymatic activity was determined at 26.8oC:
| Previously documented W.T. | Our W.T. enzyme | Codon-optimized enzyme | F4 variant | |
|---|---|---|---|---|
| Km [mM] | 0.21-0.24 | 0.19 | 0.98 | 1.17 |
| Kcat [s-1] | 232±20 | 48±10 | 2700±100 | 2095±100 |
| Kcat/Km [s-1*M-1] |
1050 | 252±20 | 2755±100 | 1791±100 |
As seen from the results, the Km values of our variants compared to the W.T. is of the same magnitude, so we conclude that there is no significant change in affinity.
Moreover, when comparing the Kcat values of our variant to the W.T. we see a significant improvement which is consistent with our previous results.
Finally, we can see that the catalytic efficiency, portrayed by the Kcat/Km value, has been significantly improved in our variants, compared to the W.T. enzyme, both ours and the previously documented.
We can conclude from all these results that we managed to dramatically improve LC-Cutinase's activity, with regards to pNP-Butyrate degradation.
To further characterize LC-Cutinase's PET degradation activity we used Scanning-electron microscopy of PET pellets incubated with E. coli expressing LC-Cutinase.
Control:

Figure 16: A scanning electron microscope (SEM) image of a PET pellet after 2 days of incubation in a liquid LB broth with no bacteria. X1000 magnification.

Figure 17: A scanning electron microscope (SEM) image of a PET pellet after 2 days of incubation in a liquid LB broth with no bacteria. X1000 magnification.

Figure 18: A scanning electron microscope (SEM) image of a PET pellet after 2 days of incubation in a liquid LB broth with no bacteria. X2500 magnification.

Figure 19: A scanning electron microscope (SEM) image of a PET pellet after 2 days of incubation in a liquid LB broth with no bacteria. X5000 magnification.A scanning electron microscope (SEM) image of a PET pellet after 2 days of incubation in a liquid LB broth with no bacteria. X5000 magnification.
One control was PET pellets incubated for 2 days in LB liquid media with no bacteria.
As seen from the images, the surface of the PET pellets is relatively smooth, there are some high crystallinity rod shaped structures but they are fairly covered.

Figure 20: A scanning electron microscope (SEM) image of a PET pellet after 2 days of incubation in a liquid LB broth with E. coli transformed with the pACYC vector with no insert. X1000 magnification.

Figure 21: A scanning electron microscope (SEM) image of a PET pellet after 2 days of incubation in a liquid LB broth with E. coli transformed with the pACYC vector with no insert. X2500 magnification.
As a second control we used E. coli transformed with the pACYC vector with no insert (the backbone alone), to assess the effects of bacteria themselves on the PET.
PET incubated with LC-Cutinase expressing bacteria:

Figure 22: A scanning electron microscope (SEM) image of a PET pellet after 2 days of incubation in a liquid LB broth with E. coli expressing the codon-optimized LC-Cutinase protein. X1000 magnification.

Figure 23: A scanning electron microscope (SEM) image of a PET pellet after 2 days of incubation in a liquid LB broth with E. coli expressing the codon-optimized LC-Cutinase protein. X1000 magnification

Figure 24: A scanning electron microscope (SEM) image of a PET pellet after 2 days of incubation in a liquid LB broth with E. coli expressing the codon-optimized LC-Cutinase protein. X5000 magnification.
As seen above, after incubation with the LC-Cutinase expressing bacteria, the surface of the PET is rougher than the control. We also notice that the surface of the PET looks more porous and the rod shaped, high crystallinity PET, is more exposed than in the control.
Moreover, when comparing the bacteria expressing the LC-Cutinase gene and the bacteria transformed with an empty vector backbone, we see a clear difference in the texture of the PET. We assume that this is the result of the PET degradation activity of the LC-Cutinase enzyme.
Please note, that when comparing the appearance of degraded PET between LC-Cutinase degraded PET and R. ruber degraded PET, they looked the same, however, the difference was that it took a month to R. ruber to degrade PET to the observed picture (Fig. 8-10) while it only took two days to LC-Cutinase to reach the same. Although, this is not a quantitative measure, it is an indication of the enzyme’s high activity.
As part of our work with the P. putida KT2440 strain we wanted to test its antibiotic resistances, so we can select the appropriate cloning vectors.
Here are our results:
| Antibiotics | Concentration [μg/mL] | Resistant |
|---|---|---|
| Ampicillin | 100 | Yes |
| Chloramphenicol | 34.1 | Yes |
| Ampicillin + Chloramphenicol | 100 + 34.1 | Yes |
| Spectinomycin | 100 | No |
| Spectinomycin X2 | 200 | No |
| Streptomycin | 100 | No |
| Streptomycin X2 | 200 | No |
| Kanamycin | 25 | No |
| Kanamycin X2 | 50 | No |
| Ampicillin + Chloramphenicol + Streptomycin | 100 + 34.1 + 100 | No |
| Control- No Antibiotics | 0 | Yes |
Analysis of these results showed that P. putida KT2440 is sensitive to Kanamycin, Streptomycin and Spectinomycin.
These results led us to choose the pSEVA224 and pSEVA434 vectors - with Kanamycin and Spectinomycin resistances respectively.
In order to test P. putida's ability to utilize TPA and PCA as a carbon source we measured O.D610 values for a period of ~100 hours with P. putida in liquid M9 media with either TPA or PCA as a carbon source. To prevent contamination, we used Ampicillin and Chloramphenicol (at 100μg/mL and 34.1μg/mL respectively) as selection markers.

Figure 25: P. putida KT2440 grown in liquid M9 media with different concentrations of PCA for a period of 96 hours. 5 and 10mM concentration were tested twice ("a/b").

Figure 26: P. putida KT2440 grown in liquid M9 media with different concentrations of TCA for a period of 136 hours. 20 and 30mM concentration were tested twice ("a/b").
From these results we conclude that P. putida can utilize PCA as a sole carbon source, as previously reported. In contrast, our results show no growth with TPA, which lead us to the conclusion that P. putida cannot utilize it as a sole carbon source.
Reviewing these results leads us to the conclusion that the TPA degradation pathway must be cloned into the P. putida bacterium for efficient PET degradation.
Here are the results of E. coli strain BL21's growth with liquid M9 media containing ethylene glycol as a sole carbon source:

Figure 27: E. coli strain BL21 grown in liquid M9 media with different concentrations of EG for a period of 96 hours.
We can conclude from these results that our E. coli strain BL21, like other E. coli strains, can utilize EG as a sole carbon source, with an optimal concentration of 30mM.
In order to test the PET degradation ability of the LC-Cutinase enzyme variants, all variants were grown on M9 minimal medium plates with shredded PET pellets as a sole carbon source to test their ability to degrade PET. (for detailed instructions on the preparation of the media see Protocols).

Figure 28: E. coli expressing the codon-optimized(CO) LC-Cutinase grown on a M9 soft agar plate with shredded PET pellets as a sole carbon source. Colonies are marked in red.

Figure 29: E. coli expressing the F4 LC-Cutinase variant grown on a M9 soft agar plate with shredded PET pellets as a sole carbon source. Colonies are marked in red.

Figure 30: E. coli expressing the F7 LC-Cutinase variant grown on a M9 soft agar plate with shredded PET pellets as a sole carbon source. Colonies are marked in red.

Figure 31: E. coli expressing the R4 LC-Cutinase variant grown on a M9 soft agar plate with shredded PET pellets as a sole carbon source. Colonies are marked in red.

Figure 32: E. coli expressing the R7 LC-Cutinase variant grown on a M9 soft agar plate with shredded PET pellets as a sole carbon source. Colonies are marked in red.

Figure 33: E. coli expressing the W.T LC-Cutinase grown on a M9 soft agar plate with shredded PET pellets as a sole carbon source. Colonies are marked in red.

Figure 34: Control. E. coli expressing the W.T. LC-Cutinase grown on a M9 agar plate no carbon source.
As seen in the images above, all LC-Cutinase variants were able to grow on the plates containing shredded PET, suggesting that the PET is degraded and E. coli is utilizing at least one of its products (we assume - ethylene glycol).
We cannot conclude which variant degrades the PET with the highest efficiency, as the PET in the plates is not evenly spread and the amount of PET degraded cannot be measured in this assay.
However, we have clearly shown that our bacteria can utilize PET as a carbon source using the LC-Cutinase protein, which is a proof-of-concept for one part of our project. Looking at the entire design- our biofuel cell will consist of E. coli expressing LC-Cutinase that degrades the PET and consumes ethylene glycol (it includes the previous results in the E. coli ethylene glycol utilization results). We have managed to show that out E. coli will be able to break down PET in conditions similar to those in our designed biofuel cell and to survive without any other carbon source.
Moreover, our new LC-Cutinase genes consist of a PelB leader sequence that has been codon optimized to maximize expression levels in E. coli. The PelB leader sequence is a previously registered part (Part:BBa_J32015).
To verify our hypothesis that PCA (Protocatechuic acid) is a suitable electron transfer mediator for our fuel cells we measured its potential using cyclic voltammetry (CV).

Figure 35: Voltagramm of PCA.
Calculating the values from the CV measurements we found that the substance had a middle point Potential of E0'= 174 mV vs. an Ag/AgCl reference electrode. We concluded that the potential was low enough to function as an electron transfer mediator in the system's anode, although not an ideal one.
In order to test the ability of P. putida to grow in a biofuel cell anode we had to assess its ability to produce an electroactive biofilm on graphite plates used in a biofuel cell.
We incubated the bacteria in a liquid LB medium and hanged a graphite plate half inside the medium and half outside.

Figure 36: A P. putida biofilm on a graphite disc.
As seen from the picture above, our bacterium is able to form a biofilm on the graphite electrode.
After testing the compatibility of each component of our fuel cell, we ran several tests to assess its efficiency:

Figure 37: Power-output as a function of voltage using an Ag-AgCl reference electrode.
We can see a large increase in power output induced in the sample containing bacteria in the 250-500 mV range, compared to the control. In the second day of measurements, there was a decline in power output probably due to cell death. The last measurement is not shown due to contamination in the control cell.
The internal resistance was measured in the first day with values of 60 Ω for the cell containing bacteria and 1000 Ω for the control. Which is an indication to the electroactivity of P. putida compared to control, with relatively high internal resistance.
As proof of concept in the biofuel part of our project, Our test results may suggest that there is a potential in constructing a biofuel cell based on the electrochemical activity of P. putida KT 2440 with protocatechuic acid as an electron mediator. That being said, more experiments are required in order to confirm our hypothesis and determine the proper concentrations of the protocatechuic acid and characterize the mechanisms with which it mediates P. putida's electron transfer. It should be mentioned that protocatechuic acid polymerizes in the presence of amine groups, a reaction that could interfere with the electron transfer, hence other more potent mediators will be explored including the operation of the biofuel cell without mediators, since P. putida are reported to produce their endogenous electron transfer mediators.
We have demonstrated that creating a biofilm on a graphite anode can be easily done, making this part of our system applicable. Furthermore, we succeeded in generating electricity using a relatively unfavorable condition for the bacterium. Hence showing a potential in in building the final system in which the bacteria will be incubated in similar conditions and under the similar stresses.
Our symbiotic approach relies on mutual growth of E. coli and P. putida. For this approach to succeed E. coli must successfully grow inside a dialysis bag.
In this experiment we grew E. coli strain BL-21 transformed with the pACYC vector containing the LC-Cutinase W.T. gene and induced with IPTG in a liquid M9 medium with PET.

As seen from the results, our E. coli was able to grow with only PET as a sole carbon source, suggesting it utilized PET's degradation product, ethylene glycol, as a carbon source.
Moreover, we see that E. coli remained viable throughout the experiment, verifying our hypothesis that it can grow inside a dialysis bag, and suggesting that our symbiotic design using a dialysis bag is plausible.
We consider that result as an important step and a proof-of-concept of our final goal.
In order to assess the ability of our two chosen bacterial species - E. coli and P. putida to grow in symbiosis, a key element in our project's design, we cultivated both bacteria in a liquid LB medium, separated by a dialysis bag.
After 72 hours of growth we transfered samples taken from inside and outside the dialysis bag to petri dishes. The petri dishes were incubated over-night at 37oC. Samples were taken for analysis using colony-PCR to identify the strains.


Figure 41: Plate number 1 - samples taken from inside and outside the dialysis bag and grown over-night on a petri dish containing Chloramphenicol. As seen from the image, both samples show growth, corresponding to P. putida's endogenic resistance and E. coli's plasmid acquired resistance to Chloramphenicol.

Figure 42: Plate number 2 - samples grown on a petri dish containing Ampicillin. As seen from the image, both samples show growth, suggesting that both samples contain P. putida, which has endogenic resistance to Ampicillin.
Figure 43: Plate number 4 - samples taken from inside and outside the dialysis bag and grown over-night on a petri dish containing Kanamycin. As seen from the image, no growth is visible in either sample. This is expected as neither P. putida nor E. coli is resistant to Kanamycin.
As seen from the results above, both bacteria maintained viability using our dialysis bag apparatus during the experiment.
Some results show presence of both bacteria inside and outside the bag. Those results are a consequence of a rupture in the dialysis membrane which occurred during the experiment.
Nevertheless, our experiment clearly demonstrates the ability of E. coli and P. putida to exist in symbiosis.
Our two dialysis bag experiments clearly demonstrate the plausibility of our designs. We managed to demonstrate PET degradation and utilization of its product, EG, by E. coli surrounded by a dialysis membrane and a consortium consisted of E. coli and P. putida with the same apparatus. Results from both experiments show that our designs work under conditions similar to our final product and proves our project's applicability.
After seeing bacterial growth on our PET plates, we wanted to combine our protocols of PET utilization and to detect the presence of TPA in our plates. If our speculation was correct, the LC-Cutinase was supposed to be expressed from the E. coli, degrade the PET, and the bacterium could consume ethylene glycol from the degradation products. If that was the case, TPA would be present in the plate.

Figure 44: PET plates (prepared as previously described in the PET Utilization experiment (Experiments Page), after colony growth, were exposed to UV light (as described in the Terephthalic acid detection assay (Experiments Page)), then tested in a fluorescence gel imager to detect TPA presence by excitation in 314nm end detecting emission at 426nm. For control, TPA presence was detected in plates containing E. coli transformed with an empty vector plasmid (the same vector used for expression of LC-Cutinase), and no bacteria at all.
As shown, plates containing E. coli expressing LC-Cutinase showed higher emission levels, which indicates of higher presence of TPA in the plates in question. The control plates still have certain background emission, but it can be due to background emission from the polystyrene plates. This experiment, although it cannot quantify the degradation efficiency, is another indication of the existence and activity of the LC-Cutinase enzyme, and the ability of E. coli expressing our LC-Cutinase to utilize its degradation product- ethylene glycole.
Address:
Ben-Gurion University of the Negev
Ben Gurion 1, Beer Sheva 8410501, Israel
Mail: igembgu2016@gmail.com
Connect With Us!


