Team:UMaryland/Model
</div> </div>


Background |
Pathway |
Optimization |
Results |
|---|
Background
The Modeling portion of the UMaryland iGEM project proposes specific adjustments to the expression levels of enzymes in the methane digestion pathways. Our modeling efforts focus on ensuring the viability of our engineered organism, and optimizing the efficiencies of our pathways. Along the way, our team encountered stumbling blocks that we would like to illuminate for iGEM teams in the future. Incorporated into our modeling page is a concise guide on getting started with the Matlab applet, Simbiology, to model simple metabolic pathways. If you have no interest in this guide, please feel free to optimize your time by skipping over the purple text.
Simbiology is a tool that enables teams with variable modeling backgrounds to build pathway architectures by using a simple drag and drop interface. Although Simbiology is an extremely useful and intuitive tool, it does require some experience to navigate, and it does have its errors; but more on that later. The first step is to open Simbiology by typing “simbiology” into the Matlab command window, then hitting enter.
 Simbiology allows you to drag these elements onto an interface to design your model. For our model, we mainly used the “species” icon and the “reaction” icon.
To begin drawing your metabolic pathway, drag and drop a “reaction” icon, located on the left hand sign of the window, onto the blank canvas covering the right half of the window. Then double click on the small orange reaction circle that you placed, and enter your chemical reaction into the block property editor by replacing “null -> null” with your balanced formula. Enzymes are included in the balanced formula. Make sure your enzyme is represented as both a reactant and a product. Clicking out of the Block Property Editor will create species with arrows pointing into your reaction and arrows pointing out of your reaction. Enzymes are connected to the reaction by a dotted line, representing an intermediate that is not consumed or produced by the reaction. You may place as many reactions and species onto the canvas as you would like. If you would like an example model architecture, our pathways are shown later.
Creating the Pathway Architecture
The models for our formate and fructose pathways each consist of two compartments, four reactions and 14 or 15 species, respectively. The initial goal for our project was to produce a co-culture of cells consisting of “sMMO Cells” that produce methanol and “Formate/Fructose Cells” that detoxify methanol, all in an effort to completely biodegrade methane. The first compartment in our model shown below is the “sMMO Cell” that converts methane to methanol, which travels to the second compartment of our model, either the “Formate” or “Fructose Cell.” Each species represents a different molecule involved in our pathway. The architecture for our Formate pathway displays a progression of compounds starting at methane and ending at carbon dioxide. In all, this pathway is facilitated by four enzymes.
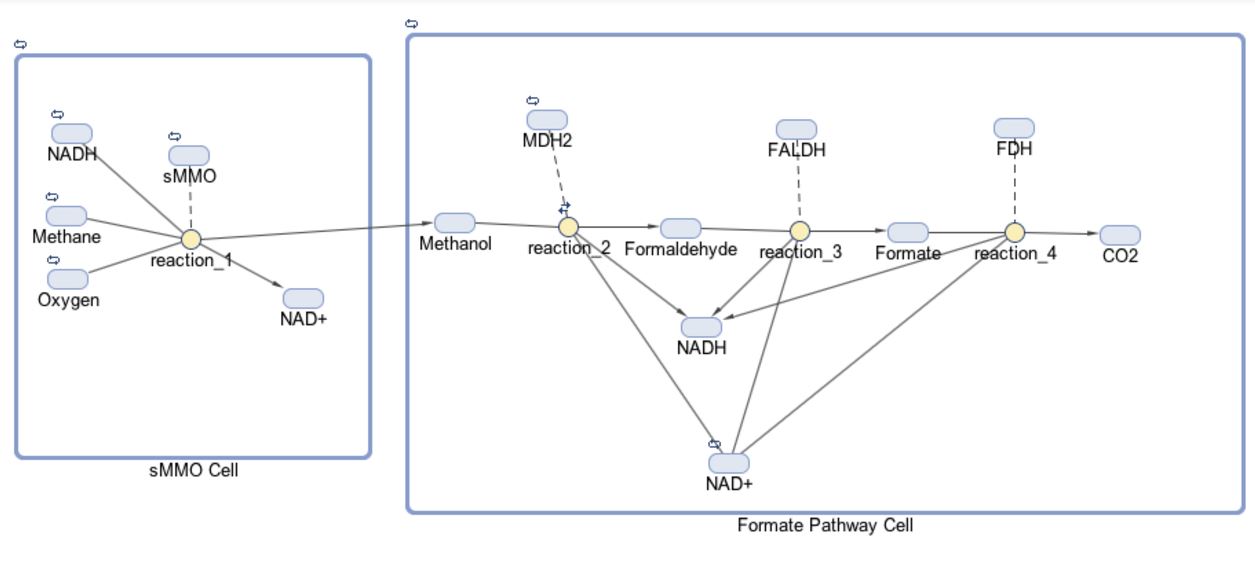
The first half of each pathway is identical. The first enzyme used in each pathway is sMMO, which catalyses the oxidation of methane to methanol while simultaneously oxidizing NADH to NAD+. Both pathways then proceed to oxidize methanol to formaldehyde, which is a reaction catalyzed by the MDH2 enzyme.

Once formaldehyde is produced, the two pathways begin to differ. In the Formate Pathway, formaldehyde is first oxidized to formate, which is then oxidized to carbon dioxide by FALDH and FDH enzymes respectively. In the Fructose Pathway, formaldehyde is incorporated into a 5 carbon sugar by HPS to make D-arabinose 6-phosphate, a 6 carbon sugar. PHI then converts D-arabinose 6-phosphate into D-fructose-6-phosphate, which is a substrate of glycolysis.
The enzyme kinetics for each of the aforementioned proteins are listed in the table below:
| Enzyme | Km (mM) | Vmax (micromoles product/minute/mg enzyme) |
|---|---|---|
| sMMO1 | 0.003 | 0.056 |
| MDH22 | 360 | 0.09 |
| FALDH3 | 0.09 | 5.9 |
| FDH4 | 1400.0 (formaldehyde)34.0 (NAD+) | 0.625 |
| HPS5 | 0.74 (formaldehyde)0.081 (D-ribulose-5-phosphate) | 5.9 |
| PHI6 | 0.029 | 20 |
Enzyme kinetics can be entered into the Reaction Editor by double clicking on the small orange circle representing a reaction. First choose a Kinetic Law, then enter the kinetic values simbiology asks for. Simbiology will then use the Kinetic Law and kinetic values to produce a reaction rate.
The standard units for Vmax are micromol product/minute/milligram enzyme, however, Simbiology initially asks for Vmax in terms of micromole/minute. To the best of our knowledge the easiest way to include enzyme amount as a factor in your model is by manually changing the units of Vmax to micromole/minute/micromole by clicking on the unit drop down menu and selecting “Create new unit” (Vmax must be represented in units of micromole/minute/micromole because of dimensional analysis constraints in Matlab, but keep in mind that you will most likely enter enzyme amount as a mass value). After changing Vmax units, you must change the ReactionRate by multiplying the given formula by the name of your enzyme. At any point in the creation of your model, you may double click on the species representing your enzyme and enter an amount value (leave the enzyme amount in terms of micromole).

This stage of creating our Simbiology model presented a subtle, yet extremely significant stumbling block to our progress. The drop down menu for units allows one to select different prefixes for units. Unfortunately, it seems as though these prefixes were not properly integrated into the software, and Simbiology will not perform the necessary dimensional analyses to convert between micro and milli, for example. Therefore, it is crucial that all your analogous units employ identical units. For example, our modeling team decided to work exclusively with a “micro” prefix for concentration and molarity units. 56 nanomoles became 0.056 micromoles and 300 millimolarity became 300,000 micromolarity.
This leads us to an important piece of advice: do not implicitly trust everything the program claims to do. Our modeling team discovered this discrepancy in the Simbiology software by running models in parallel with certain hand done calculations. When our model did not remotely resemble our paper and pencil calculations, we knew there was an error in the way Simbiology handled units. We recommend that in addition to creating your desired model, you create a control model where the outcome is known, or perform hand-written calculations to check certain parts of your model.
From this point on, Simbiology runs fairly smoothly, so we’ll leave it to you to figure out the rest. Best of luck!
After we created the basic architecture for our two models, we experimented with various parameters to optimize our pathway.
Optimization and Parameter Scanning
We analyzed the contributions of three different parameters on the viability of our pathways: methanol tolerance, methane concentration, and presence of an Activator protein, ACT.
Parameter 1: Methanol tolerance
Methanol, formaldehyde, and formate are toxic substrates produced by the methane digestion pathways. As our project stands, each pathway is cloned so that the enzymes are expressed in 1:1 ratios. Under these circumstances, formaldehyde and formate do not build up in the cell. However, because the MDH2 enzyme has a relatively large Km of 360,000 μM, methanol builds up to a toxic concentration. MDH2 must therefore be expressed at a higher cellular concentration than sMMO so that methanol production does not significantly outpace methanol consumption.
Team Aachen 2015, which worked to upcycle methanol into a universal carbon source, indicated that their E. coli survived methanol concentrations at up to 1.6M. By modifying the ratio of sMMO and MDH2 enzymes, we simulated the efficiency of our pathway under conditions of increased methanol production.
 Simulations were run to determine the equilibrium concentration of methanol at various sMMO to MDH2 ratios. We found that at a ratio of 300 mg to 217.3 mg respectively, methanol concentration reaches an equilibrium of 0.5M. By running a multitude of these simulations, and tracking the amount of carbon dioxide produced over a set time period, we were able to conclude that Increasing the sMMO to MDH2 ratio beyond 300 mg to 217.3 mg will not significantly improve methane degradation (as indicated by carbon dioxide production).
Sidenote: Because the reaction catalyzed by MDH2 forms a bottleneck in our pathway, we concluded that MDH2 should be expressed at the greatest concentration. We determined the peak enzyme concentration to be 5.3 μM because Team Braunschweig 2014 experimentally calculated that their part, which used the same backbone, promoter, and ribosome binding site that we used for all our parts, expressed protein at 5.3 μM. Expression for every other enzyme is tuned based on the fact that MDH2 concentration is 5.3 μM (217.3 mg per liter).
We sought to optimize the ratio of MDH2 to sMMO by finding the point at which an increase in sMMO production no longer contributes to significantly faster methane digestion (inferred from carbon dioxide production). We found that increasing sMMO beyond 240 mg per liter does not greatly contribute to our pathway running faster. This ratio of sMMO to MDH2 corresponds with a methanol equilibrium of 0.5 M, which according to Team Braunschweig is non-toxic to the cell.
Parameter 2: Methane Concentration
In seawater, methane has a maximum solubility of 890 μM7. To determine the optimal methane concentration for our pathway, we created multiple models with methane concentration ranging from 0 μM to 890 μM. At a methane concentration of 200 μM, methane degradation (inferred from carbon dioxide production) began to plateau.** In order to degrade the highest fraction of methane possible, methane should therefore be bubbled through the cells at a concentration of 200 μM, which is equivalent to 0.031% methane (v/v).
Parameter 3: Presence of ACT protein
Literature analysis of the MDH2 enzyme reveals that an activator protein, ACT, reduces the Km of MDH2 by 2-fold. Our team did not plan to clone the ACT protein, but the modeling team decided to determine if cloning this protein would significantly improve the efficiency of our pathway. We repeated the parameter scanning above (with methanol tolerance and methane concentration) after changing the Km of MDH2 from to 360,000 μM to 180,000 μM. We found that sMMO concentration once again peaked at 0.5M, but the corresponding sMMO concentration was an increased 300 mg/L, implying that the pathway functioned at a higher rate. Methane is still most efficiently degraded at a concentration of 0.031%.
Calculating the Success of Our Optimized Pathway
With the results of our parameter scanning, we have compiled together a series of recommendations to optimize our pathway, and modeled the effect of said pathway.
 After optimizing enzyme ratios and determining the steady state methanol concentration that those ratios correspond to, we were able to simulate our optimized pathway and observe the rate of methane degradation. Once our optimized pathway reaches steady state, the only product formed is carbon dioxide. This demonstrates that our engineered E. coli cells can survive our pathway, because no toxic intermediates build up in excessive amounts. After a 10 day period, 0.2 moles of carbon dioxide are produced, corresponding to 0.2 moles of methane consumed. This value holds true for the Fructose pathway as well as the formate pathway.
After optimizing our pathway, we briefly analyzed the kinetic values of our enzymes to adjust the concentrations of FALDH, FDH, HPS, and PHI in response to the optimized pathway. These changes have no significance to our optimization. Ultimately we recommend that if MDH2 is expressed at 100%, sMMO should be expressed at 29.4%, FALDH should be expressed at 8.5%, FDH should be expressed at 22.6%, HPS should be expressed at 1.5%, and PHI should be expressed at 0.79%. This recommendation will be reflected in future work through the selection of promoters and ribosome binding sites that achieve these enzyme concentration ratios. If these ratios are followed, methanol concentration should reach equilibrium at 0.5 M, which, according to experimentation by Team Braunschweig, is viable.
If the ACT protein is expressed, 0.2 moles of methane (4.48 liters stp) will be digested by 1 liter of cell culture every 10 days. If the ACT protein is not expressed by the cells, there is a 20% reduction in efficiency, causing 0.16 moles of methane (3.6 liters stp) to be digested by 1 liter of cell culture every 10 days.** In terms of proportion of methane sequestered, we should be able to digest all methane bubbled through our solution as long as If methane gas is bubbled through at a concentration of 0.031%.
References
- Green, J.; Dalton, H. Biochem. J 1986, 236, 155–162.
- Krog, A.; Heggeset, T. M. B.; Müller, J. E. N.; Kupper, C. E.; Schneider, O.; Vorholt, J. A.; Ellingsen, T. E.; Brautaset, T. PLoS One 2013, 8 (3), e59188.
- Martínez, M. C.; Achkor, H.; Persson, B.; Fernández, M. R.; Shafqat, J.; Farrés, J.; Jörnvall, H.; Parés, X. Eur. J. Biochem. 1996, 241 (3), 849–857.
- Fogal, S.; Beneventi, E.; Cendron, L.; Bergantino, E. Appl. Microbiol. Biotechnol. 2015, 99 (22), 9541–9554.
- Nobuo Kato, Hiroyuki Ohashi, Takao Hori, Yoshiki Tani & Koichi Ogata (1977) Properties of 3-Hexulose Phosphate Synthase and Phospho-3-hexuloisomerase of a Methanol-utilizing Bacterium, 77a, Agricultural and Biological Chemistry, 41:7, 1133-1140, DOI: 10.1080/00021369.1977.10862658
- Chen, L. M., H. Yurimoto, K. Z. Li, I. Orita, M. Akita, N. Kato, Y. Sakai and K. Izui (2010). "Assimilation of formaldehyde in transgenic plants due to the introduction of the bacterial ribulose monophosphate pathway genes." Biosci Biotechnol Biochem 74(3): 627-635.
- Yamamoto, S.; Alcauskas, J. B.; Crozier, T. E. J. Chem. Eng. Data 1976, 21 (1), 78–80.


© University of Maryland iGEM 2016