2016 PROJECT
Construction of different systems
Bring DNA Closer (BDC) tool construction
The BDC tool construct is composed of the dCas9 SP linked to FRB* and the dCas9 TD linked to FKBP12 (for further details, go check our design page ADD LINK). To construct this tool, the two dCas9s were ordered as plasmids from addgene.org (ADD LINK), and the mutated FRB and FKBP12 genes were obtained y ordering gblocks.
We planned to check dCas9 sequences before using it. As plasmids we received from adgene were already into bacteria when we received it, we cultured them in order to extract them, and then we sent them for sequencing.
The first arduous step was to get enough material from plasmid extraction, because plasmids were low copy number. Since we didn't manage to do it, we tried to perform a PCR on extracted plasmids, using primers of our design.
Sadly, the amplification step didn't go well, and when we finally sent plasmids for sequencing, it didn't match with expected sequences.
Because of a lack of time, we decided to put this part of the project asside to focus on constructing the visualization tool
Visualization tool construction
For this sub-project, we ordered gBlocks thanks to IDT’s offer, and according to our design (link to corresponding page). Since these gBlocks were meant to construct our biobricks, it had to respect iGEM's rules, and also IDT requirements for DNA synthesis. Therefore, the sequences we got were modified to remove forbidden restriction sites, adapt to E.coli codon usage, and have an acceptable GC% and number of repetitions within sequences. Each of these gBlocks were then integrated to intermediate plasmids and those plasmids were transformed into E. coli . Then they were ready for further manipulation such as Gibson assembly or digestion and ligation techniques to construct our final design.
The following gBlocks were designed to construct our Visualization tool (Table 1):
| gBlocks
|
size (bp)
|
| gblock 1.1
|
960
|
| gblock 1.2
|
960
|
| gblock 2.1
|
1023
|
| gblock 2.2
|
808
|
| gblock 3.1
|
960
|
| gblock 3.2
|
960
|
| gblock 4.1
|
706
|
| gblock 4.2
|
1288
|
| gblock GFP 1.9
|
862
|
Table 1: gBlocks used to build the visualization tools
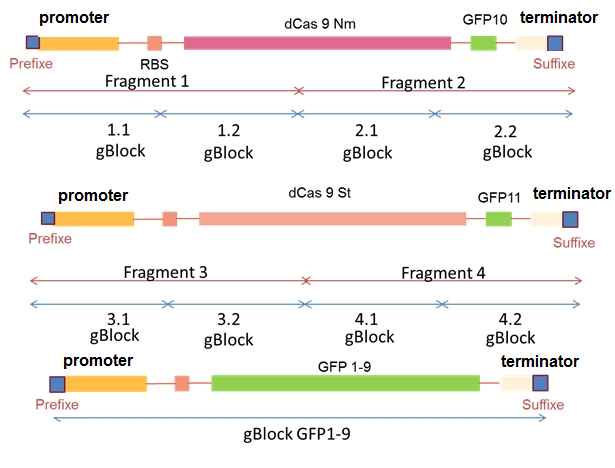
Figure 1: Scheme of the visualization tool design. Visualization tool is composed of three main parts: biobrick containing dCas9 Nm and GFP10 coding sequences, biobrick containing dCas9 St and GFP11 coding sequences, and biobrick containing GFP 1-9 coding sequence. The two first biobricks are split into 2 fragments, themselves split into 2 gBlocks
Try to put Figure 1 next to the table 1 PLZ!
As it is described in Figure 1, the biobrick containing coding sequences for dCas9 Nm and GFFP10 is made of two fragments called fragment 1 and fragment 2. These two fragments are themselves respectively composed by gBlocks 1.1 and 1.2, and gBlocks 2.1 and 2.2.
The biobrick containing coding sequences for dCas9 St and GFP11 is made of two fragments called fragment 3 and fragment 4. These two fragments are themselves respectively composed by gBlocks 3.1 and 3.2, and gBlocks 4.1 and 4.2.
It is important to notice that in both biobricks, the two fragments are overlapping to allow a ligation by Gibson technique.
Finally, the third GFP subunit (1 – 9) biobrick is only composed of gBlock GFP 1-9.
The first step was to check gBlocks, because according to IDT, there is an error rate, and only 80% of gBlocks have the correct ordered sequence.
In order to check them, gBlocks were cloned into pUC19 in first attempt, or pJET plasmid for difficult cases. pUC19 is a plasmid that allows white/blue screening, and pJET is a plasmid that allows only cells containing the plasmid cloned with an insert to grow on selective media.
Positive colonies were screened by colony PCR, using universal pUC19 or pJET vectors. PCR products were checked using gel electrophoresis. Figure 2 shows the results for gBlock 3.1. In this particular case, the expected fragment was 960bp. Results showed that clones 2 and 5 were positive.
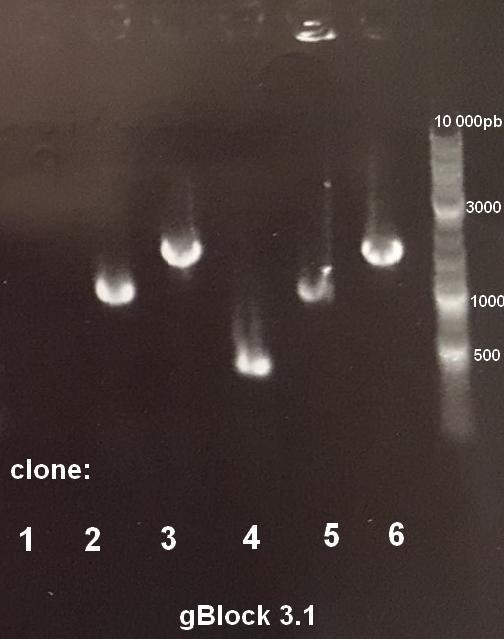
Figure 2: Colony PCR products gel electrophoresis of gBlock 3.1. Expected fragment: 960bp. Clones 2 and 5 are positive.
Plasmid DNA was extracted from cultures of positive colonies and sent for sequencing. When sequences were correct, the same plasmidic DNA extraction products were used to perform a high fidelity PCR, using primers which hybridized at both extremities of the gBlock. This PCR product was then stocked or used to perform a ligation.
Figure 3 shows the electrophoresis gel of ligations producing fragment 3 and 4. Expected fragments size was respectively 1920bp and 1994 bp. Those fragments were obtained.
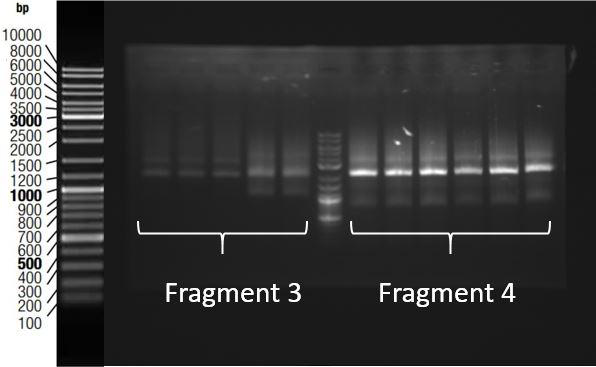
Figure 3: Gel electrophoresis of ligations products for Fragments 3 and 4. Expected size were respectively 1920 and 1994 bp. Results showed that correct sized fragments were obtained.
Thanks to an overlap between two fragments within biobricks, and an overlap between prefix and suffix present on fragments and pSB1C3, we were able to assemble them in pSB1C3 using Gibson Assembly. Gibson Assembly products are then transformed into bacteria, and a colony PCR was performed using primers complementary to biobrick suffix and prefix to screen positive bacteria colonies. PCR products are then checked on gel electrophoresis. Figure 4 shows the results of this screening for the assembly of fragments 3 and 4.expected fragment was approximately 4000bp. This fragment was obtained from colonies 6 and 8.
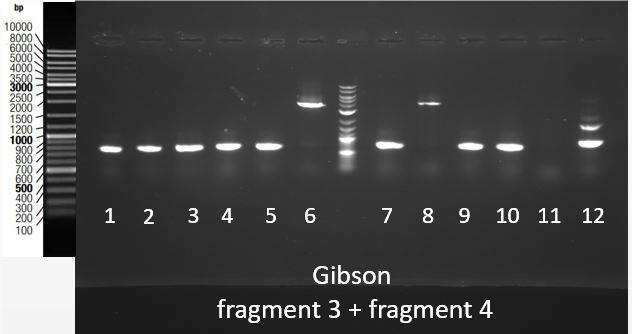
Figure 4: Migration of colony PCR products obtained from bacteria transformed with the Gibson Assembly of Fragments 3 and 4 in pSB1C3. The expected product was around 400bp. Expected product was found in clonies 6 and 8.
Therefore, plasmids were extracted from the same colonies that turned out to have the expected fragment, were stocked for further use.
To sum-up results, by the end of summer, we were able to construct biobrick containing dCas9 St and GFP11 coding sequences, and also the biobrick containing coding sequence for the third part of tripartite GFP (GFP 1- 9). Sadly, we encountered some problems during gBlocks assembling for the biobrick containing dCas9 Nm and GFP10 coding sequences, and we were not able to finish the Visualisation tool.
Characterization system for our visualization tool
The process of characterizing our visualization tool was a two-steps process. In a first time, we needed to characterize the Split Tripartite GFP activity, and then to characterize the whole tool. You can find more details about this strategy on our dedicated page. (ADD LINK)
Split tripartite GFP and FRB FKBP12 dimerization system Characterization
We designed an experiment to characterize both split tripartite GFP and FRB/FKBP12 dimerization system. In this purpose, we constructed two new biobricks composed by FRB and GFP11 coding sequences, and FKBP12 and GFP10 coding sequences.
This part of project has been designed in order to test the functionality of GFP 3 parties. We take advantage of FRB/FKBP system again here in this assessment test of GFP. The following gBlocks were designed to assembled with GFP parts as it is illustrated in strategy page of our wiki.
| gBlocks
|
size (bp)
|
| gblock FRB
|
374
|
| gblock FKBP
|
419
|
We succesfully contructed the plasmid containing our Biobrick coding for FRB-GFP11 illustrated on figure2 and FKBP-GFP10 illustrated on figure3.

Figure2.Map of plasmid pSB1C3 coding FRB fused with GFP11

Figure3. Map of plasmid pSB1C3 coding for FKBP fused with GFP10
Then we assembled 2 plasmids together and construct the plasmid coding for FKBP GFP10 and FRB - GFP 11 as it is shown in figure 4.

Figure4. Map of plasmid pSB1C3 coding for FKBP GFP10 and FRB - GFP 11
Visualization tool characterisation
As it is explained in the page dedicated to strategy of our project we design the gBlocks to construct the plasmid coding for sgRNA.
| gBlocks
|
size (bp)
|
| gblock detection
|
1020
|
| gblock St sgRNA
|
310
|
| gblock Nm sgRNA
|
362
|
| gblock spacer
|
900
|
We inserted each of the gBlocks in the plasmids (pUC19 or pJET) then we transformed each plasmid in the bacteria. Due to the lack of time we could not finalized construction of our designed plasmid (pZA11) which has been chosen for this part of our project.
2014 PROJECT
Improvement of a previous part, BBa_K13372001
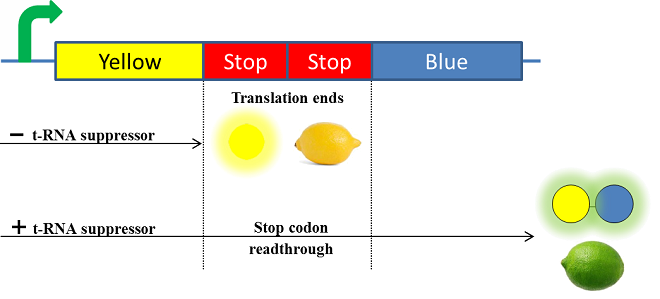
As a part of the characterization of a previous existing Biobrick Part, we have chosen the [http://parts.igem.org/Part:BBa_K1372001 BBa_K13372001] biobrick from the Paris-Saclay 2014 project This is not a lemon. It was designed to mimic the ripening of a lemon in E. coli by a salycilate-inducible expression of a suppressor tRNA.
The Paris Saclay 2014 team chose to use chromoproteins to express these colours in E. coli. Chromoproteins are reflective proteins that contain a pigmented prosthetic group and do not need to be excited to be seen. They fused a yellow chromoprotein with a blue one in order to display a green color. This construction is referred as the green fusion chromoprotein. In order to make the bacteria ripe like a real lemon, they decided to take advantage of the fusion protein’s design by using a translational suppression system. They added an amber codon (stop codon) within the linker separating the yellow and the blue chromoproteins genes. Therefore, the suppressor tRNA will suppress amber codon allowing the translation of the green fusion chromoprotein in presence of salicylate. Conversely, the down regulation of the suppressor tRNA in absence of salicylate will allow bacteria switch from green to yellow, thus simulating the ripening of a real lemon. This system is referred to as the colour switch system.
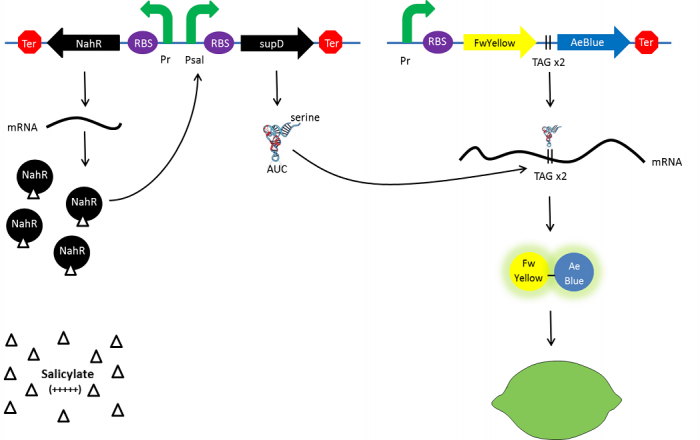
Schema of the lemon ripening project
The tRNA used is the supD suppressor tRNA. It has been placed under control of a salicylate inducible promoter Psal. Its role is to suppress the introduced amber codon. The nahR gene encodes a transcriptional regulator that is induced by salicylate and thus binds nah or Psal promoters. In presence of high salicylate concentration in the agar media, supD will be expressed and so the green fusion chromoprotein: bacteria will display a green color. However, as bacteria grow into agar, less salicylate will remain available into the media. Thus, the decrease of the nahR-salicylate complex amount within bacteria will lead to supD downregulation through time. In turn, decrease of supD amount will result in less codon readthrough and so less translation of the green fusion protein and more translation of the yellow chromoprotein. As a result, bacteria will gradually change from green to yellow.
Explanatory diagram of the lemon ripening
Characterization
In order to characterize the biobrick, the color switch system (BBa_K13372001) was tested on three different constructions, contained in the plasmid pcl99:
- TAA: LacZ and Luc coding sequences in the same open reading frame, separated with an ochre stop codon.
- TQ: LacZ and Luc coding sequences in the same open reading frame.
- TAG: LacZ and Luc coding sequences in the same open reading frame, separated with an amber stop codon.
Each condition was tested under three different salicylate concentrations. In order to achieve that, both measurements of Beta-Galactosidase and Luciferase activities were performed on bacteria cultures.
The experiment was conducted on three sets of cultures of bacteria:
- TAA: BL21|pSB1C3_BBa_K1372001 and pcl_TAA
- TQ: BL21|pSB1C3_BBa_K1372001 and pcl_Tq
- TAG: BL21|pSB1C3_BBa_K1372001 and pcl_TAG
Each of those sets of culture were incubated with three different salicylate concentrations: 0, 30µM and 1mM.
Three clones (clones 1, 2 or 3) were tested for each condition, with three different salicylate concentrations (0, 30µM or 1mM), with in addition a negative control sample.
pcl_TAA construction contains a TAA stop codon between LacZ and Luc. This codon is not recognized by the supD suppressor t-RNA : no luciferase activity is expected.
pcl_Tq construction does not contain any stop codon : the luciferase activity is expected to be at the maximal.
pcl_TAG contains the TAG codon recognized by supD suppressor t-RNA : the expression of luciferase should be inducible by salicylate.
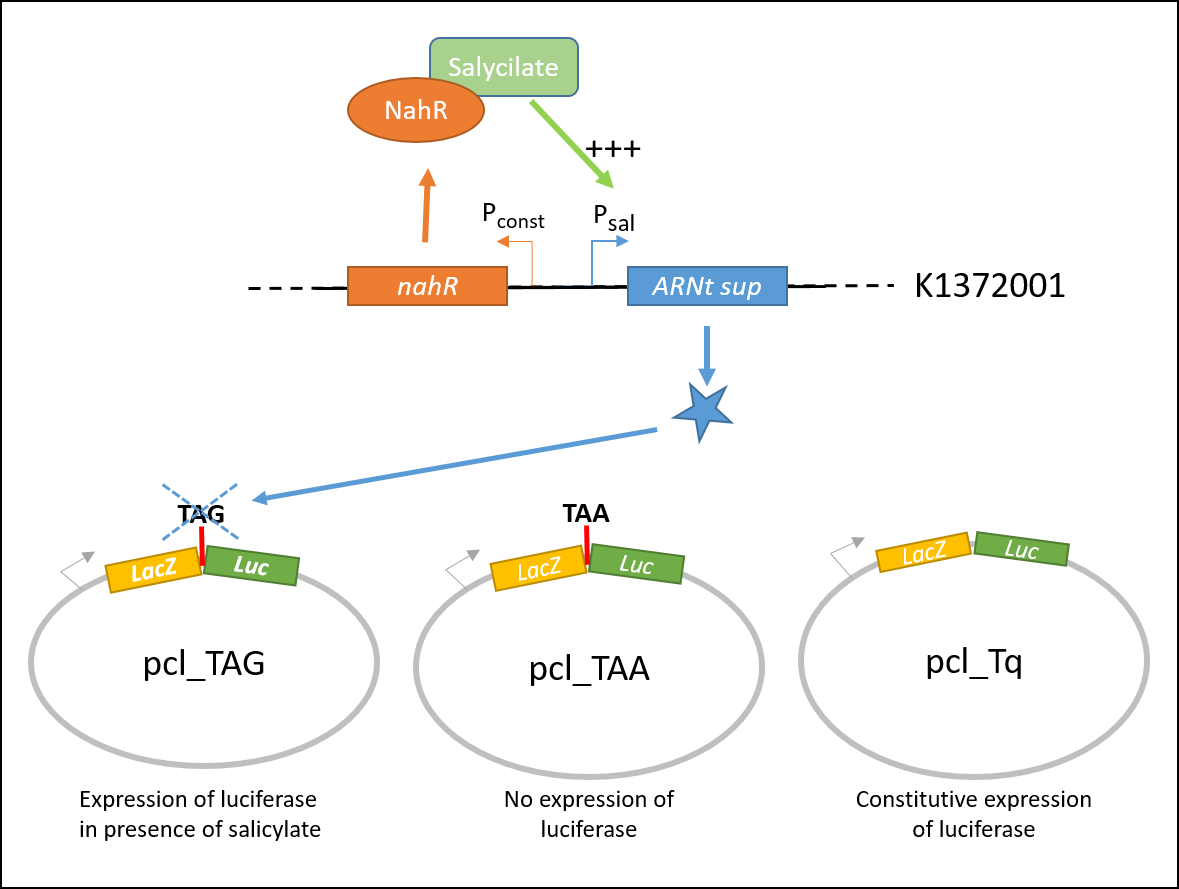
Explanatory diagram of the characterization
The luciferase luminescence is expected to vary depending to the different constructions conditions and to salicylate concentrations, instead of the Beta Galactosidase activity, which will remain constant. Thus luciferase data were normalized with those from Beta Galactosidase and our results are expressed as the Luciferase/Beta-Galactosidase activity. This ratio is independent of the level of transcription, initiation or mRNA stability.
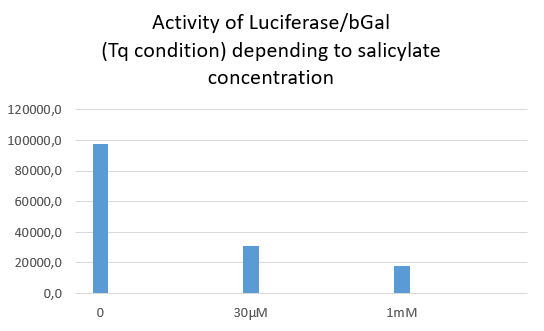
Luciferase activity with TQ construction depending of salicylate concentration
The Tq plasmid does not contain any stop codon between LacZ and Luc. Thus, no matter the salicylate concentration, both Luciferase and Beta Galactosidase activities are supposed to be detected.
As expected a high level of Luciferase/bGal activity is observed, but the ratio decreases when salicylate concentration increases. Indeed, both activities of Luciferase and bGal drop from 30µM of salicylate, but luciferase activity was more affected by the salicylate than bGal one.
One may hypothesize that salicylate inhibits differently both reporter proteins activities, with a stronger inhibition of luciferase activity. We cannot determine whether this inhibition is due to a physiological consequence onto bacteria metabolism or occures after protein extraction.
In order to read the next results, we calculated a readthrough percentage, by doing a ratio between luciferase/bGal from TAA or TAG constructs and luciferase/bGal from TQ. Thus, we obtain a readthrough percentage.
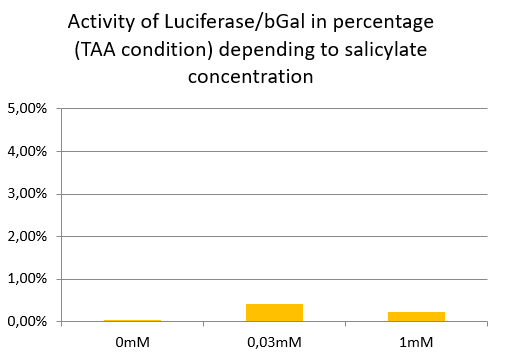
Luciferase activity with TAA construction depending of salicylate concentration
In TAA condition, regardless of the salicylate concentration, there is no significant Luciferase activity, so the ratio remains very low at any concentrations.
We conclude that supD suppressor tRNA is very specific of the TAG codon and has no impact on the TAA stop codon.
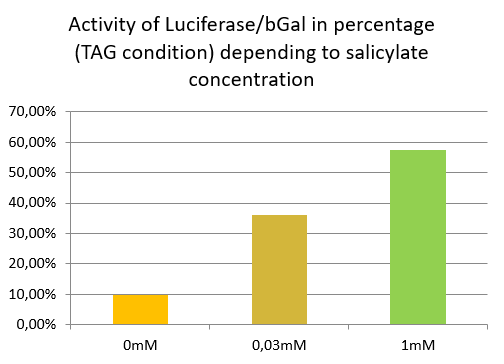
Luciferase activity with TAG construction depending of salicylate concentration
In TAG condition we can see an increase of stop codon readthrough activity with the increase of the salicylate concentration.
In comparison to the results obtained with the TAA construction, the readthrough level increases similarly to the concentration of salicylate.
This indicates that TAG stop codon is efficiently readthrough in presence of supD tRNA, allowing the production of a significant amount of luciferase.
In conclusion, the Psal promoter is fully inducible by salicylate and the suppressor tRNA is functional to suppress the TAG codon. These experiments demonstrate that the BBa_K1372001 buobrick is fully functional.