Austin_UTexas
Interlab Measurement Study
The Interlab Study is an initiative started in 2014 by the iGEM foundation to collect standard measurement data from around the world. This year, as a part of the measurement track, we completed the Interlab study according to the directions provided on the iGEM Interlab Study webpage. The purpose of this year's study was to measure the absorbance and fluorescence of three different GFP containing devices as well as a positive and negative control. The absorbance and fluorescence of a series of diluted FITC samples and LUDOX-S30 served as measurement standards. Below, we have detailed our procedures, implications of our results, and conclusions we have drawn that relate back to our main focus of evolutionary stability in synthetic biology. In synthetic biology, it is important that part characterization is consistent between different labs to create well-defined standard parts for the Registry. We are excited to contribute to this study!
Protocol
- Transform the genetic parts from the Interlab 2016 kit into TOP10 E. coli cells using electroporation
- Streak out an agar plate (LB/CAM) with the E. coli containing the device and any controls
- Streak out one plate/device and control
- Incubate plates overnight (18-20 hours) at 37°C
- Inoculate liquid culture with experimental devices (in duplicate) and controls in test tubes with 10 ml LB/CAM media (2 test tubes for each device for a total of 10)
Plate Reader Protocol
- Obtain an initial OD600 measurement of the overnight cultures, based on this data dilute the samples to a target OD600 measurement of around 0.02
- Incubate liquid cultures for 6 hours at 300 rpm in 37°C. At each hour time point, starting with 0 hour, a 100 µl sample of each culture was loaded onto a clear-bottom 96 well plate, this ended after 6 hours
- The samples were measured using a Infinite 200 Pro plate reader. The settings were: Excitation at 495 nm with a 9 nm bandwidth and Emission at 530 nm with a 20 nm bandwidth. The OD600 was also measured
Ludox Measurement
- From the provided Ludox in the Interlab kit, 4 total samples of 100 µl Ludox were added to a clear-bottom 96 well plate. In addition 4 samples of 100 µl water were also added to the plate
- The OD600 absorbance of the samples was measured using a Infinite Pro 200 plate reader
FITC Standard Curve Measurement
- The FITC stock tube was obtained from the Interlab kit. The FITC was prepared by spinning down the tube, resuspending in 1 mL of 1xPBS solution to create a 2x FITC solution, incubating for 4 hours at 42°C, and diluting the solution with 1xPBS to create a final 1x FITC solution
- The prepared FITC solution was serially diluted in a clear-bottom 96 well plate. In wells A2-A12 100 µl of PBS was added. 200 µl of the FITC 1x solution was added into A1. Starting with A1, 100 µl of A1 was pipetted into A2 and mixed, afterwards 100 µl of A2 was pipetted into A3 and mixed, this method continued until 100 µl of A10 was added and mixed in A11. 100 µl of A11 was pipetted into liquid waste. For each mixing the solution was pipetted up and down three times. This same procedure was conducted three more times until A1-A12, B1-B12, C1-C12, and D1-D12 were filled
- The samples were measured using a Infinite 200 Pro plate reader. The settings were: Excitation at 495 nm with a 9 nm bandwidth and Emission at 530 nm with a 20 nm bandwidth. The OD600 was also measured
Devices Measured
- The positive control was transformed in lab and contains the following BioBrick parts: A promoter - BBa_I20270 and a backbone (pSB1C3)
- The negative control was transformed in lab and contains the following BioBrick parts: A promoter - BBa_R0040 and a backbone (pSB1C3)
- The first device was transformed in lab and contains the following BioBrick parts: A promoter - BBa_J23101, an RBS - B0034, a GFP coding sequence - E0040, a transcriptional terminator - B0015, and a backbone (pSB1C3)
- The second device was transformed in lab and contains the following BioBrick parts: A promoter - BBa_J23106, an RBS - B0034, a GFP coding sequence - E0040, a transcriptional terminator - B0015., and a backbone (pSB1C3)
- The third device was transformed in lab and contains the following BioBrick parts: A promoter - BBa_J23117, an RBS - B0034, a GFP coding sequence - E0040, a transcriptional terminator - B0015., and a backbone (pSB1C3)
Data
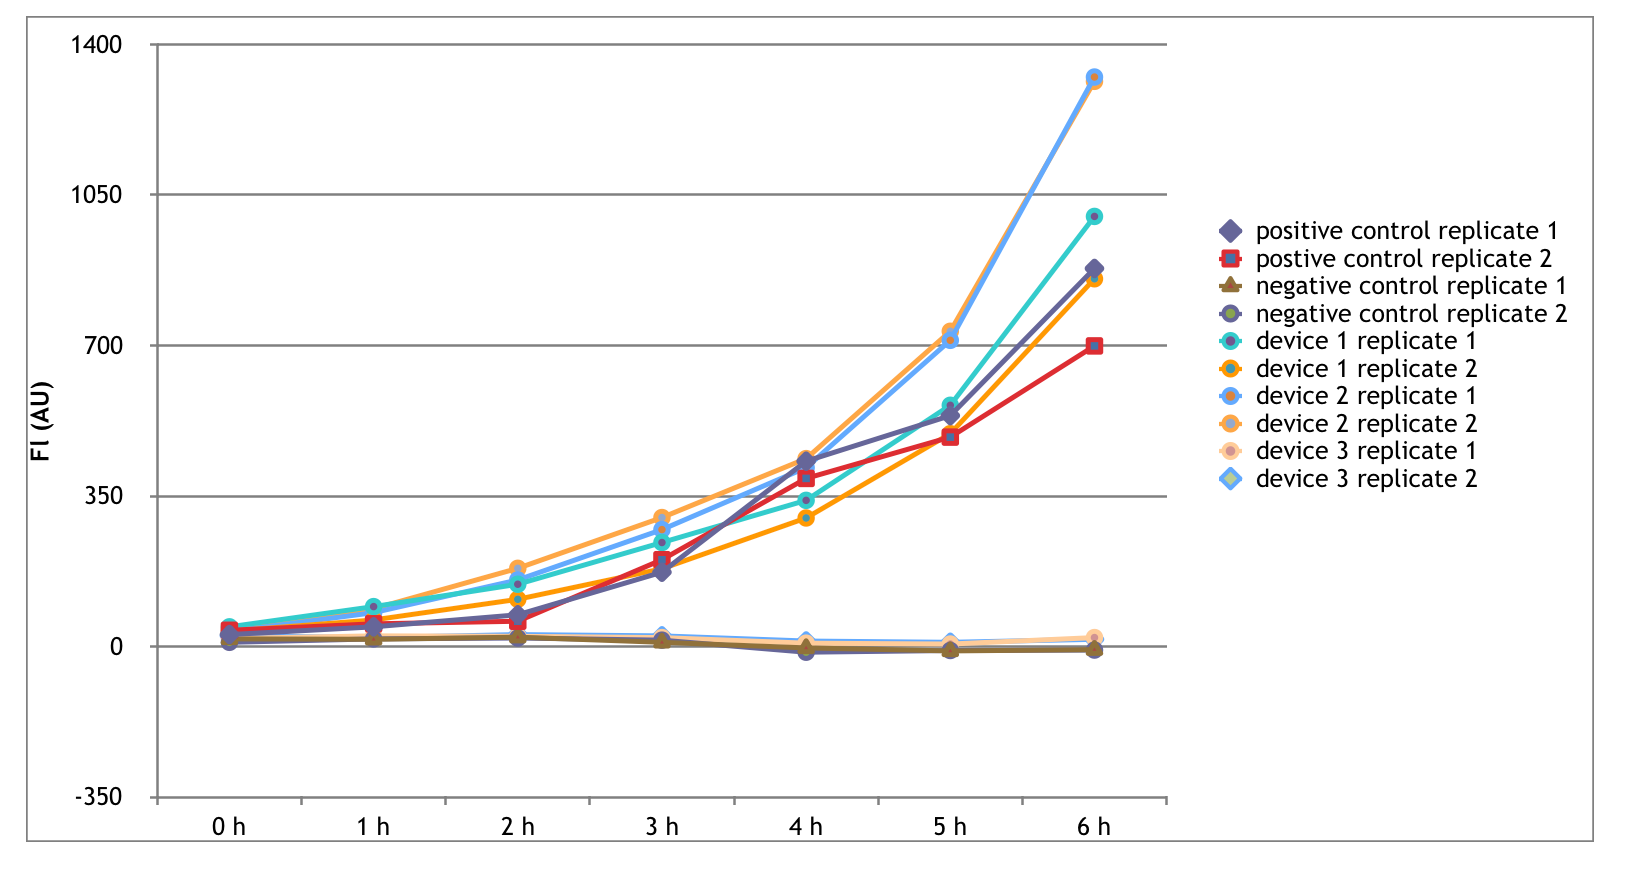
Fluorescence Timeline


