Team:Technion Israel/Model
Introduction
The goal of this model is to describe the processes inside the Flash Lab system:
- Change in the concentration of chemo-repellent.
- Change in the concentration of bacteria.
This model is based on the Keller – Segal equation of chemotaxis (1) in
a one dimensional problem (Thin channel).
It is important to notice that this model can show the overall behavior and not exact
values. The final system is supposed to detect a variety of materials in many different
solvents, each of them has its own diffusion properties. Also, some aspects such
as working conditions (temperature, humidity etc.) might change in widespread commercial
use and affect the results. Taking those into account, further fitting will be necessary.
For PDF version of this model press here
Chemo-Repellent Concentration
Model
The basic assumptions of the model for the chemo-repellent are:
-There are no forces except for diffusion:
- Chemo-repellent concentration in the sample is relatively low and does not cause osmotic pressure.
- The changes in pressure due to loading the sample is negligible.
- No other significant external forces (for example, moving the chip while using).
- The bacteria do not consume the chemo-repellent and its concentration does not change with time. In contrast, in case of a chemo-attractant this assumption is not valid.
- Expect to detect small proteins and molecules (the ligands). The diffusion coefficient for such materials is about 10-9 [m2/s].
- Because of the geometric properties of the channel and the expected diffusion coefficient, this is approximately a semi-infinite one dimensional problem.
- Initial condition: no chemo-repellent is present in the chip at time zero (a).
- Boundary condition: at infinite distance the concentration is zero (b) and the there is conservation of dissolved material mass (c).
We modelled the change in concentration of the chemo-repellent based on a "Top Hat Function" solution for the diffusion problem:
v [M] is the chemo-repellent concentration.
D[m2/s] is the chemo-repellent diffusion coefficient.
N [mol] is the number of moles of the repellent .
A [m2] is the cross-section area of the channel.
h [m] is length of the sample in the channel.
x [m] is the distance on the channel.
t [s] is time.
The solution for this problem is:

Equation 1: Chemo-repellent diffusion problem.

Equation 2: General solution for chemo-repellent diffusion problem.

Graph 1: Chemo-repellent concentration: top hat diffusion.
If x=0 [m] is defined as the point where the sample is loaded to the chip, then the solution for the diffusion problem is:

Equation 3: Chemo-repellent concentration.
Model Results
We ran the chemo-repellent concentration equation in Matlab - Our code can be found here. The parameters used:

Table 1: Parameters for diffusion model.
*This is the diffusion coefficient for potassium permanganate (see "Comparison to Experiment")
** h = (Sample volume)/(Reservoir cross section).
The output for different times:

Graph 2: Model for repellent concentration.
The change in distance of the diffusion limit between 0 to 15 minutes, is relatively big. As the time passes the diffusion limit's speed lowers significantly, and the concentration profile becomes more linear.
Comparison to Experiment
Most diffusion experiments need a dedicated system that is based on the diffusion of an isotope or a fluorescent material that can be detected easily and very precisely. we chose a more basic system since this is only a preliminary testing for showing that the overall system behaves as we expect.
The experiment ran as the setup shown in the "Overview" section: The channel was filled with bacteria in motility buffer and then the sample was inserted. We replaced the motility buffer with water and the chemo-repellent with potassium permanganate in the following amounts:

Table 2: Substance for diffusion experiment.
Modeling was done under the assumption that the motility buffer acts as water, due to the fact that it is mostly water (~98%). Potassium permanganate is a salt with a known diffusion limit and acts as most of the materials we want to detect using our system (small molecules). Also, it has an intense pink color in low concentration which makes diffusion limit visible.
We ran the experiment 4 times, with a standard ruler to measure the distance of the diffusion limit.
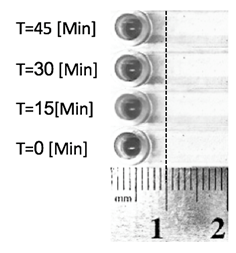
Fig. 2: Diffusion of potassium permanganate in water in different times (enhanced picture).
As expected by the mathematical model, the diffusion limit starts moving relatively fast and its speed decreases rapidly. The difference in distance between the models and the experiment can be explained by:
-The actual diffusion limit is in too low concentration of potassium permanganate to be seen in the naked eye. If the visible concentration is about 1.5*10-5 [M] the experimental results line up with the model (graph 3).
-The ruler is a crude measuring tool. Its mistake is ± 0.5 [mm].
-Difficulties in loading uniformly the sample, especially in low volumes. Mistakes in loading the sample inside the bacterial fluid and not on, or sticking the drop of sample to one of the entry slot walls will cause uneven diffusion.

Graph 3: Comparison of diffusion model (c=0.00015[M]) to experiment.
Bacterial Concentration
The basic mathematical model for bacterial chemotaxis is the Keller-Segal equations (1) of chemotaxis:

Equation 1: Keller-Segal equation
where:
u[M] is the bacteria concentration.
v[M] is the chemo-repellent concentration.
k1[m2/s] is the bacteria diffusion coefficient.
k2[m2/M * s] is the bacteria chemotactic coefficient.
k3[M/s] is bacteria life and death coefficient.
x[m] is the distance in the channel.
t[s] is time.
The basic assumptions of the chemotaxis model are:
-k2 describes how sensitive is the bacteria to changes in chemo-repellent concentration.
In other words, as its negative value decreases the bacteria will react more violently to same repellent exposure.
-Because of the geometric properties of the channel, this is approximately a one dimensional problem.
-We ran our tests in a short time scale (t<30[min]) so we presume that the change in concentration
of bacteria due to life and death is negligible, k3=0.
-The chemo-repellent concentration is known for every x and t.
-There are no changes in the flux of bacterial concentration at the start (a) and at end of the channel (b).
Mathematical Model
Under these assumptions the equation takes the form:

Equation 2: The Bacterial concentration problem.
The above partial differential equation cannot be solved analytically, so we must turn to
numerical analysis tools. The implicit Euler method is one of the most basic numerical
methods for the solution of ordinary and partial differential equations. This method is
guaranteed to be stable and gives us the solution for the entire space in a single point in time.
Using the following discretization:


Equation 3: Bacteria concentration problem – discrete form.
And we can write it as follows:

Equation 4: Bacteria concentration problem – Final form
Given the initial condition:

Equation 5: Bacteria concentration problem- initial condition.
And the boundary conditions which are translated to the following discrete conditions:

Equation 6: Bacteria concentration problem- boundary conditions
With I being the final value of i – index of location.
The above conditions keep the flux of bacteria zero on both sides of the chip as occurs in the actual chip.
Hence, no bacteria enter or exit the chip.
The above equation was entered into the Thomas-Three-Diagonal algorithm for solving matrix equations,
giving us the solution for the entire space of the problem in a specific point in time. By advancing
in time as we solve the equation at each time point we get the solution for the bacterial concentration
for every x,t.
Model results
We ran the chemo-repellent concentration equation in Matlab -
Our code can be found
here.
The parameters used:

Table 1: Parameters for chemotaxis model
Please notice, the results are normalized to enable us to show them on the same scale.
The results are as follows:

Graph 1: Results of bacterial chemotaxis model
Model conclusions:
- The peak of bacterial concentration is caused by the bacterial chemotactic
response, moving away from the chemo-repellent, and concentrating.
- The "wave" of bacterial concentration starts moving relatively fast, and slows
down quickly. This is due to the change in repellent concentration. The "wave"
converges to ~7[mm].
- The bacteria react significantly less to a normalized repellent concentration of
less than ~3[mm]. This is approximately where the two graphs intersect.
- As the concentration of repellent goes down, the bacteria are less reactive.
This continues as the bacteria's diffusion speed surpasses the chemotaxis rate. In other
words, more bacteria move away from the concentration peak than into it for t>15[mim].
- Projecting this on the chip color experiment, we can predict there will be three shades
of color: weak where the bacteria moved from (low concentration), strong where the bacteria
moved to (high concentration) and on the far end, unchanged as the bacteria were not exposed
to the repellent.
Comparison to Experiments
The experiment ran as the setup shown in the "Overview" section: The channel was filled with bacteria in motility buffer and then the sample was inserted. We used engineered E. coli with a S.Tar PctA receptor taken from a plate and suspended in motility buffer. The chemo-repellent used is TCE.

Table 2: Substance for chemotaxis experiment
a.

b.

Fig. 1: a. Chemotaxis of E. coli with a S.Tar PctA receptor due to exposure to TCE (enhanced picture). b. E. coli with a S.Tar PctA receptor exposed to motility buffer (control).
As expected, a visible cluster of strong dark blue has formed next to a lighter shade due to
chemotactic activity. Furthermore, the distance the bacteria passed is only a few millimeter
as the model predicted.
The time scale does not line up: The color darkens as the experiment continues. This will
probably be corrected by using more accurate diffusion and chemotactic coefficients.
Some of the inconsistencies between the model and the experiment (like the uneven cluster
of colored bacteria) can be explained by problems loading the chemo-repellent as shown in
the chemo-repellent concentration experiment.
Conclusions
Results
This model predicts the overall behavior of our system. In our experiments we were able to
show that the concentration of the repellent acts as we expected in terms of changes in the
diffusion limit's velocity. When compared to the bacterial concentration, again, the experiments
showed a similar behavior as the numeric solution of Keller-Segal equation.
As explained before, this model requires further fitting to get more accurate results. Not only
by using more accurate coefficients, but with improving the system itself.
Future development
We would like to improve the model and design new ones based on it. First, develop
models for the different coefficients in the Keller-Segal equation: bacteria diffusion
coefficient, chemotactic coefficient and bacteria life and death. Theoretically, those coefficients can be controlled by changing some parameters like
the number of flagella
or receptors a cell has, or even manipulating the biological tracks of the bacteria.
This will enable us to get even more accurate results. Secondly, to build a library of
different receptors and ligands. Thirdly, expanding our
model so it could predict movement of bacteria in different geometric constructs such
as funnels or U bends. This research can be the basis of a prototype commercial device.
As for the first part, we worked with iGEM Freiburg (2) in developing a function for the
chemotactic coefficient. Also, we designed a new assay for experimentally measuring it.
This assay, named Trap & Track, is a novel way to detect chemotaxis on the nanometric level.
By using it we can measure the exact repellent concentration that induces chemotaxis and
calculate the chemotactic coefficient accurately for every material. A detailed explanation
about the assay can be found
here.
As for the second part, the S.Tar system enables us to change the receptors a bacterium
has and by that, change the materials it repels from. In the future, this system can be
expanded to control the efficiency of these receptors and even control other aspects of
the chemotaxis pathway such as the flagella.
The third and final part is to improve the device itself. We designed a new fluidic chip
and fabricated it in different methods.
This new design will give us a more controlled diffusion by cancelling out most of the
flow and fixing the diffusion source. Also, by changing the geometry of the channel,
the bacteria concentration will increase and cause a more noticeable signal. This will improve
the accuracy of the experiments we run, and in turn, our overall model.
References:
1. KELLER, Evelyn F.; SEGEL, Lee A. Model for chemotaxis. Journal of theoretical biology, 1971, 30.2: 225-234.
2. MAZZAG, B. C.; ZHULIN, I. B.; MOGILNER, Alexander. Model of bacterial band formation in aerotaxis. Biophysical journal, 2003, 85.6: 3558-3574..


