Difference between revisions of "Team:TAS Taipei/Model"
| Line 67: | Line 67: | ||
<ul style='margin-left:0px'> | <ul style='margin-left:0px'> | ||
<li class="dropdown"> | <li class="dropdown"> | ||
| − | <a href="https://2016.igem.org/Team:TAS_Taipei/ | + | <a href="https://2016.igem.org/Team:TAS_Taipei/Description"><h4 class="dropdown-toggle disabled" data-toggle="dropdown"><b>PROJECT</b></h4></a> |
<div class="dropdown-menu"> | <div class="dropdown-menu"> | ||
<div class='subcategories_container'> | <div class='subcategories_container'> | ||
<div> | <div> | ||
| − | <h5><a href="https://2016.igem.org/Team:TAS_Taipei/ | + | <h5><a href="https://2016.igem.org/Team:TAS_Taipei/Description">Background</a></h5> |
</div> | </div> | ||
<div> | <div> | ||
| Line 286: | Line 286: | ||
<div class="col-sm-12"> | <div class="col-sm-12"> | ||
<p> | <p> | ||
| − | The amount of damage to crystallin by H2O2 determines the severity of a cataract. We relate the amount of crystallin damage to the corresponding rating on the LOCS scale, used by physicians to rate cataract severity. Our goal is to lower LOCS to below 2.5, the threshold for surgery. Through literature research as well as our own experimental data, <b>we find the maximum allowable crystallin damage to prevent a LOCS 2.5 cataract from developing. </b> | + | The amount of damage to crystallin by H2O2 determines the severity of a cataract (Spector). We relate the amount of crystallin damage to the corresponding rating on the LOCS scale, used by physicians to rate cataract severity. Our goal is to lower LOCS to below 2.5, the threshold for surgery. Through literature research as well as our own experimental data, <b>we find the maximum allowable crystallin damage to prevent a LOCS 2.5 cataract from developing. </b> |
</p> | </p> | ||
</div> | </div> | ||
| Line 297: | Line 297: | ||
There are three ways of measuring cataract severity, each used for a different purpose. | There are three ways of measuring cataract severity, each used for a different purpose. | ||
<ol> | <ol> | ||
| − | <li><b>Lens Optical Cataract Scale (LOCS)</b>>: Physicians use this scale, from 0 – 6, to grade the severity of cataracts. | + | <li><b>Lens Optical Cataract Scale (LOCS)</b>>: Physicians use this scale, from 0 – 6, to grade the severity of cataracts (Domínguez-Vicent). |
</li> | </li> | ||
<li><b>Absorbance at 397.5 nm</b>: This is the experimental method, used by our team in the lab (c.d.) </li> | <li><b>Absorbance at 397.5 nm</b>: This is the experimental method, used by our team in the lab (c.d.) </li> | ||
| − | <li><b>Crystallin Damage</b>: This is a chemical definition. We quantify cataract severity as a function of how much oxidizing agents there are, as well as how long crystallin is exposed to oxidizing agents. </li> | + | <li><b>Crystallin Damage</b>: This is a chemical definition. We quantify cataract severity as a function of how much oxidizing agents there are, as well as how long crystallin is exposed to oxidizing agents. (Cul XL) </li> |
</ol> | </ol> | ||
| − | When we add GSR into the system, crystallin damage decreases. Our goal is to find the <b>equivalent crystallin damage that leads to a LOCS 2.5 cataract</b>, in order to know <b>how much GSR</b> to prevent this amount of crystallin damage in Model 2. | + | When we add GSR into the system, crystallin damage decreases (Cul XL). Our goal is to find the <b>equivalent crystallin damage that leads to a LOCS 2.5 cataract</b>, in order to know <b>how much GSR</b> to prevent this amount of crystallin damage in Model 2. |
</p> | </p> | ||
</div> | </div> | ||
| Line 324: | Line 324: | ||
<div class="col-sm-12"> | <div class="col-sm-12"> | ||
<h3>Motivation</h3> | <h3>Motivation</h3> | ||
| − | <p>Crystallin damage is the chemically significant way quantifying cataract severity. | + | <p>Crystallin damage is the chemically significant way quantifying cataract severity (Cul XL). |
| − | Physicians grade cataracts on a LOCS scale from 0 to 6, with 2.5 usually being the threshold for surgery. This standard method to determine cataract severity is through optical analysis, which is not applicable for chemical analysis. </p> | + | Physicians grade cataracts on a LOCS scale from 0 to 6, with 2.5 usually being the threshold for surgery. This standard method to determine cataract severity is through optical analysis, which is not applicable for chemical analysis. (Chylack)</p> |
<p>The purpose of this model is simple. In Model 2, we find the amount of GSR to maintain in order to ensure a cataract remains below a certain severity. <b>Before we can do that, we must find a way to relate the physical definition of cataract severity (LOCS) to the chemical definition (crystallin damage) in Model 1.</b></p> | <p>The purpose of this model is simple. In Model 2, we find the amount of GSR to maintain in order to ensure a cataract remains below a certain severity. <b>Before we can do that, we must find a way to relate the physical definition of cataract severity (LOCS) to the chemical definition (crystallin damage) in Model 1.</b></p> | ||
<p>We use literature data to relate LOCS to absorbance, which is still a physical property, but is frequently used in the lab. Then, with experimental data, we relate crystallin damage to absorbance, thus completing the link between the chemical and the physical definitions.</p> | <p>We use literature data to relate LOCS to absorbance, which is still a physical property, but is frequently used in the lab. Then, with experimental data, we relate crystallin damage to absorbance, thus completing the link between the chemical and the physical definitions.</p> | ||
| Line 349: | Line 349: | ||
<h3>Data Documentation</h3> | <h3>Data Documentation</h3> | ||
<h4>LOCS to Absorbance</h4> | <h4>LOCS to Absorbance</h4> | ||
| − | <p>The results of <i> | + | <p>The results of <i>Chylack et. Al. </i> relate LOCS to opacity. Opacity (%) is physically related to absorbance at 397.5 nm, and can be calculated with the following equation.</p> |
<p>As a result, we can find the equivalent absorbance of each point on the LOCS scale, shown in Table 1 (outside collapsible).</p> | <p>As a result, we can find the equivalent absorbance of each point on the LOCS scale, shown in Table 1 (outside collapsible).</p> | ||
<h4>Absorbance to Crystallin Damage</h4> | <h4>Absorbance to Crystallin Damage</h4> | ||
| Line 429: | Line 429: | ||
<p>We are about to use experimental data from experiments we performed. As we cannot perfectly simulate a human cataract in our lab, we have to make the following assumptions:</p> | <p>We are about to use experimental data from experiments we performed. As we cannot perfectly simulate a human cataract in our lab, we have to make the following assumptions:</p> | ||
<ol> | <ol> | ||
| − | <li><b>Cataract damage is directly proportional to H2O2 concentration and time.</b> Crystallin damage is mainly caused by H2O2 interacting the cysteine on crystallin. The reaction between H2O2 and cysteine is first-order (Domínguez-Vicent | + | <li><b>Cataract damage is directly proportional to H2O2 concentration and time.</b> Crystallin damage is mainly caused by H2O2 interacting the cysteine on crystallin. The reaction between H2O2 and cysteine is first-order (Domínguez-Vicent), supporting this assumption. This allows us to make the quantification of crystallin damage.</li> |
| − | <li>We assume that the <b>amount of crystallin in the lens is far greater than the amount of crystallin degraded.</b> Therefore, a change in the amount of crystallin does not impact crystallin damage, as H2O2 only degrades a small portion of crystallin that causes blurred lens.</li> | + | <li>We assume that the <b>amount of crystallin in the lens is far greater than the amount of crystallin degraded.</b> Therefore, a change in the amount of crystallin does not impact crystallin damage, as H2O2 only degrades a small portion of crystallin that causes blurred lens. (Cul XL)</li> |
<li>The <b>crystallin in humans is similar in function as crystallin in fish.</b> This allows us to use experimental data on fish into this model.</li> | <li>The <b>crystallin in humans is similar in function as crystallin in fish.</b> This allows us to use experimental data on fish into this model.</li> | ||
<li>When the experiments diluted the cataract lens protein, the amount of crystallin is diluted. However, the final absorbance of degraded crystallin is also diluted, so we assume <b>any errors in absorbance is canceled out.</b></li> | <li>When the experiments diluted the cataract lens protein, the amount of crystallin is diluted. However, the final absorbance of degraded crystallin is also diluted, so we assume <b>any errors in absorbance is canceled out.</b></li> | ||
| Line 487: | Line 487: | ||
<h3>LOCS to Absorbance: Literature Data</h3> | <h3>LOCS to Absorbance: Literature Data</h3> | ||
<p> | <p> | ||
| − | Numerous studies show how absorbance measurements can be converted to the LOC scale that physicians use. With the results of | + | Numerous studies show how absorbance measurements can be converted to the LOC scale that physicians use. With the results of Chyluck, we construct the first two columns in Table 1. |
</p> | </p> | ||
<br><br> | <br><br> | ||
| Line 499: | Line 499: | ||
<div class="col-sm-4"> | <div class="col-sm-4"> | ||
<table class="table table-bordered" style='width: 90%;margin-left:0%;'> | <table class="table table-bordered" style='width: 90%;margin-left:0%;'> | ||
| − | + | <caption style='caption-side:top;'><b>Table 1: Results of Model 1 – Equivalent values for LOCS, Absorbance, and Crystallin Damage. First two columns come from <i>Chyluck</i>, the third column uses data from our team's Lens Model experiment (see collapsible)</caption> | |
<thead> | <thead> | ||
<tr> | <tr> | ||
| Line 585: | Line 585: | ||
<div class="col-sm-12"> | <div class="col-sm-12"> | ||
<p> | <p> | ||
| − | By various enzyme kinetics laws, fully documented in the collapsible, we build a system of 10 differential equations based on 6 chemical reactions. All parameters, constants, and initial conditions are based off literature data. Estimates made are also shown with assumptions and reasoning. The details are shown in the collapsible for interested readers. | + | By various enzyme kinetics laws, fully documented in the collapsible, we build a system of 10 differential equations based on 6 chemical reactions. All parameters, constants, and initial conditions are based off literature data (Ng, Melissa, Saravanakumar, Salvador, Adimora, Jones, Martinovich). Estimates made are also shown with assumptions and reasoning. The details are shown in the collapsible for interested readers. |
</p> | </p> | ||
</div> | </div> | ||
| Line 617: | Line 617: | ||
<h3>Crystallin Damage vs. GSR Level</h3> | <h3>Crystallin Damage vs. GSR Level</h3> | ||
<p> | <p> | ||
| − | According to literature data and our model, the naturally occurring GSR concentration is 10 uM. All curves show crystallin damage decreasing as GSR levels are increased, which supports both research and experimental data, and suggests that this prototype is effective in preventing crystallin damage. <b>However, GSR levels need to be raised significantly, up to 40+ uM from the natural 10 uM of GSR in order to show long-term protection. </b> | + | According to literature data and our model, the naturally occurring GSR concentration is 10 uM (Clinical Ocular Toxicology). All curves show crystallin damage decreasing as GSR levels are increased, which supports both research and experimental data, and suggests that this prototype is effective in preventing crystallin damage. <b>However, GSR levels need to be raised significantly, up to 40+ uM from the natural 10 uM of GSR in order to show long-term protection. </b> |
</p> | </p> | ||
| Line 816: | Line 816: | ||
<h3>Confirmation of Initial Value of GSR</h3> | <h3>Confirmation of Initial Value of GSR</h3> | ||
<p>We expect the lens to have some GSR in the lens naturally as part of the antioxidizing system. There will not be enough GSR to fully prevent cataract damage, however. Based on research, if H2O2 levels remain at 10 uM for 1 year, which is common after traumatic accidents affecting the eye, a moderately severe cataract will develop, expected at around the LOCS 4-4.5 level.</p> | <p>We expect the lens to have some GSR in the lens naturally as part of the antioxidizing system. There will not be enough GSR to fully prevent cataract damage, however. Based on research, if H2O2 levels remain at 10 uM for 1 year, which is common after traumatic accidents affecting the eye, a moderately severe cataract will develop, expected at around the LOCS 4-4.5 level.</p> | ||
| − | <p>Literature data estimates that the natural concentration is around 10uM. This corresponds to roughly a LOCS 4 cataract after a year, which confirms that our initial value of GSR in the cortex before any treatment. We will consider this as our starting point, and add GSR to reach this point.</p> | + | <p>Literature data estimates that the natural concentration is around 10uM (Clinical Ocular Toxicology). This corresponds to roughly a LOCS 4 cataract after a year, which confirms that our initial value of GSR in the cortex before any treatment. We will consider this as our starting point, and add GSR to reach this point.</p> |
</div> | </div> | ||
</div> | </div> | ||
| Line 842: | Line 842: | ||
<div class="col-sm-12"> | <div class="col-sm-12"> | ||
<p> | <p> | ||
| − | To maximize delivery efficiency to the lens, we encapsulate GSR in chitosan nanoparticles. From Models 1-2, we have found the necessary concentration of GSR that needs to be maintained in the lens. Now we design nanoparticles that will maintain those amounts. <b>We build a model find how nanoparticles release GSR at appropriate rates to control the amount of GSR in the lens, and find the best engineered design for nanoparticles.</b> | + | To maximize delivery efficiency to the lens, we encapsulate GSR in chitosan nanoparticles (Wang, Tajmir-Riahi). From Models 1-2, we have found the necessary concentration of GSR that needs to be maintained in the lens. Now we design nanoparticles that will maintain those amounts. <b>We build a model find how nanoparticles release GSR at appropriate rates to control the amount of GSR in the lens, and find the best engineered design for nanoparticles.</b> |
</p> | </p> | ||
</div> | </div> | ||
| Line 881: | Line 881: | ||
<br><br><br> | <br><br><br> | ||
<img src="https://static.igem.org/mediawiki/2016/5/5e/T--TAS_Taipei--Nanoparticle_Release_Model_final.png"> | <img src="https://static.igem.org/mediawiki/2016/5/5e/T--TAS_Taipei--Nanoparticle_Release_Model_final.png"> | ||
| − | <figcaption class='darkblue'><b>Figure 4.5: Nanoparticle Release - Experiments vs. Model.</b>This is a graph of the amount of GSR left in nanoparticles as a function of time when placed in 37 degrees | + | <figcaption class='darkblue'><b>Figure 4.5: Nanoparticle Release - Experiments vs. Model.</b>This is a graph of the amount of GSR left in nanoparticles as a function of time when placed in 37 degrees Celsius. As GSR is released, the amount of GSR in the nanoparticle falls as a decay exponential. We create a model to guide our experiments, and then use experimental data to refine our model. </figcaption> |
</figure> | </figure> | ||
<div class="col-sm-1"></div> | <div class="col-sm-1"></div> | ||
| Line 983: | Line 983: | ||
<h3>A Two Stage Eyedrop Approach</h3> | <h3>A Two Stage Eyedrop Approach</h3> | ||
<p> | <p> | ||
| − | As shown in Table 2, we cannot alter the time to reach equilibrium, or reach full prevention. As supported by | + | As shown in Table 2, we cannot alter the time to reach equilibrium, or reach full prevention. As supported by Clinical Ocular Toxicology, the time to reach equilibrium is a property of the lens that we cannot change. However, we propose a <b>two-step eyedrop approach, of two differing nanoparticle concentrations</b>, to decrease the time needed for full prevention. A full explanation is found in the collapsible. |
</p> | </p> | ||
</div> | </div> | ||
| Line 1,023: | Line 1,023: | ||
<h3>Bioavailability of GSR Delivery</h3> | <h3>Bioavailability of GSR Delivery</h3> | ||
<p> | <p> | ||
| − | The eye is well protected from foreign material attempting to enter the eye. The corneal epithelium is the most essential barrier against topical drugs in eyedrops, and as a result, much of drugs in eyedrops are lost in tear drainage. | + | The eye is well protected from foreign material attempting to enter the eye. The corneal epithelium is the most essential barrier against topical drugs in eyedrops, and as a result, much of drugs in eyedrops are lost in tear drainage (Lux). |
</p> | </p> | ||
<p> | <p> | ||
| − | Bioavailability describes the proportion of the drug that reaches the site of action, regardless of the route of administration. For example, it is estimated that only 1-5% of an active drug with small solutes in an eyedrop penetrates the cornea ( | + | Bioavailability describes the proportion of the drug that reaches the site of action, regardless of the route of administration. For example, it is estimated that only 1-5% of an active drug with small solutes in an eyedrop penetrates the cornea (Bonate). In the case of nanoparticles, which are much larger than chemical molecules, more is lost (Clinical Ocular Toxicology). |
</p> | </p> | ||
<p> | <p> | ||
| Line 1,051: | Line 1,051: | ||
<p>[Calculations]</p> | <p>[Calculations]</p> | ||
<p> | <p> | ||
| − | We conclude that we need 5.48 mM of GSR in nanoparticles to maintain 43.5 uM GSR and thus 2.5 LOCS. | + | We conclude that we need 5.48 mM of GSR in nanoparticles in our final eyedrop to maintain 43.5 uM GSR and thus 2.5 LOCS. |
</p> | </p> | ||
</div> | </div> | ||
| Line 1,060: | Line 1,060: | ||
<h3>Sensitivity Analysis: Revisiting Nanoparticles Model</h3> | <h3>Sensitivity Analysis: Revisiting Nanoparticles Model</h3> | ||
<p> | <p> | ||
| − | The mechanism for eyedrop delivery is complex, and there are variances in the bioavailability depending on the conditions of the eye. The thickness of the cornea, lens, other eye diseases, age, and even time of day may impact the bioavailability of the drug. We use a stochastic model to simulate Model 3 again, but this time, add a degree of variance. The result is shown in Figure 4.10. | + | The mechanism for eyedrop delivery is complex, and there are variances in the bioavailability depending on the conditions of the eye (Clinical Ocular Toxicology). The thickness of the cornea, lens, other eye diseases, age, and even time of day may impact the bioavailability of the drug (Gaudana). We use a stochastic model to simulate Model 3 again, but this time, add a degree of variance. The result is shown in Figure 4.10. |
</p> | </p> | ||
<p> | <p> | ||
| Line 1,095: | Line 1,095: | ||
<div class="col-sm-12"> | <div class="col-sm-12"> | ||
<p> | <p> | ||
| − | We use the results from our previous models, and apply them to treatment. The only difference is that our treatment protein, CH25H, reverses cataract damage. We find the exact concentration of CH25H to reverse a cataract of a given LOCS score. The delivery models are unchanged, with the exception that the concentration of protein delivery will be different. </p> | + | We use the results from our previous models, and apply them to treatment. The only difference is that our treatment protein, CH25H, reverses cataract damage (Griffiths. We find the exact concentration of CH25H to reverse a cataract of a given LOCS score. The delivery models are unchanged, with the exception that the concentration of protein delivery will be different. </p> |
<p>We use the results of Model 1 to calculate the LOCS equivalent crystallin damage we need to reverse (“negative crystallin damage”). Then we use experimental results to calculate the concentration of CH25H needed to reverse the cataract. We do not use Model 3, as this is a one-time treatment. After applying the results of Model 4, we can find the final concentration needed in CH25H eyedrops.</p> | <p>We use the results of Model 1 to calculate the LOCS equivalent crystallin damage we need to reverse (“negative crystallin damage”). Then we use experimental results to calculate the concentration of CH25H needed to reverse the cataract. We do not use Model 3, as this is a one-time treatment. After applying the results of Model 4, we can find the final concentration needed in CH25H eyedrops.</p> | ||
<p>We propose eyedrops with 0.8 mg/mL CH25H. The number of drops needed for treatment is calculated in the software below.</p> | <p>We propose eyedrops with 0.8 mg/mL CH25H. The number of drops needed for treatment is calculated in the software below.</p> | ||
Revision as of 01:39, 19 October 2016
Model
Cataract prevention occurs over 50 years, so we cannot perform experiments directly on the long-term impact of adding GSR or CH25H. Computational biology allows us to predict cataract development in the long-term. These models allow our team to: (1) understand the impact of adding GSR-loaded nanoparticles into the lens over a 50 year period and (2) design a full treatment plan on how to prevent and treat cataracts with our project. Therefore, the results of our model are essential in developing a functional prototype.
For sake of clarity, we will discuss each model in detail with respect to prevention (using GSR) only. At the end, we extend these results to treatment. In addition, we include collapsibles for interested readers and judges, in order to fully document our modeling work (eg. assumptions, mathematics, and full analysis) while keeping the main page clear with basic points only.
Introduction
Guiding Questions
How much GSR to maintain in the lens? (GSR Function)
How to maintain that amount of GSR using nanoparticles and eyedrops? (Delivery Prototype)
Focus of Models
Since our construct is not directly placed into the eyes, how our synthesized protein impacts the eye after it is separately transported into the lens is of greater importance. As a result, we create models with the intent on understanding how GSR and CH25H impacts the eye, and how we can control its impact with a well-designed delivery prototype.
Prevention: GSR Function
Model 1: Crystallin Damage
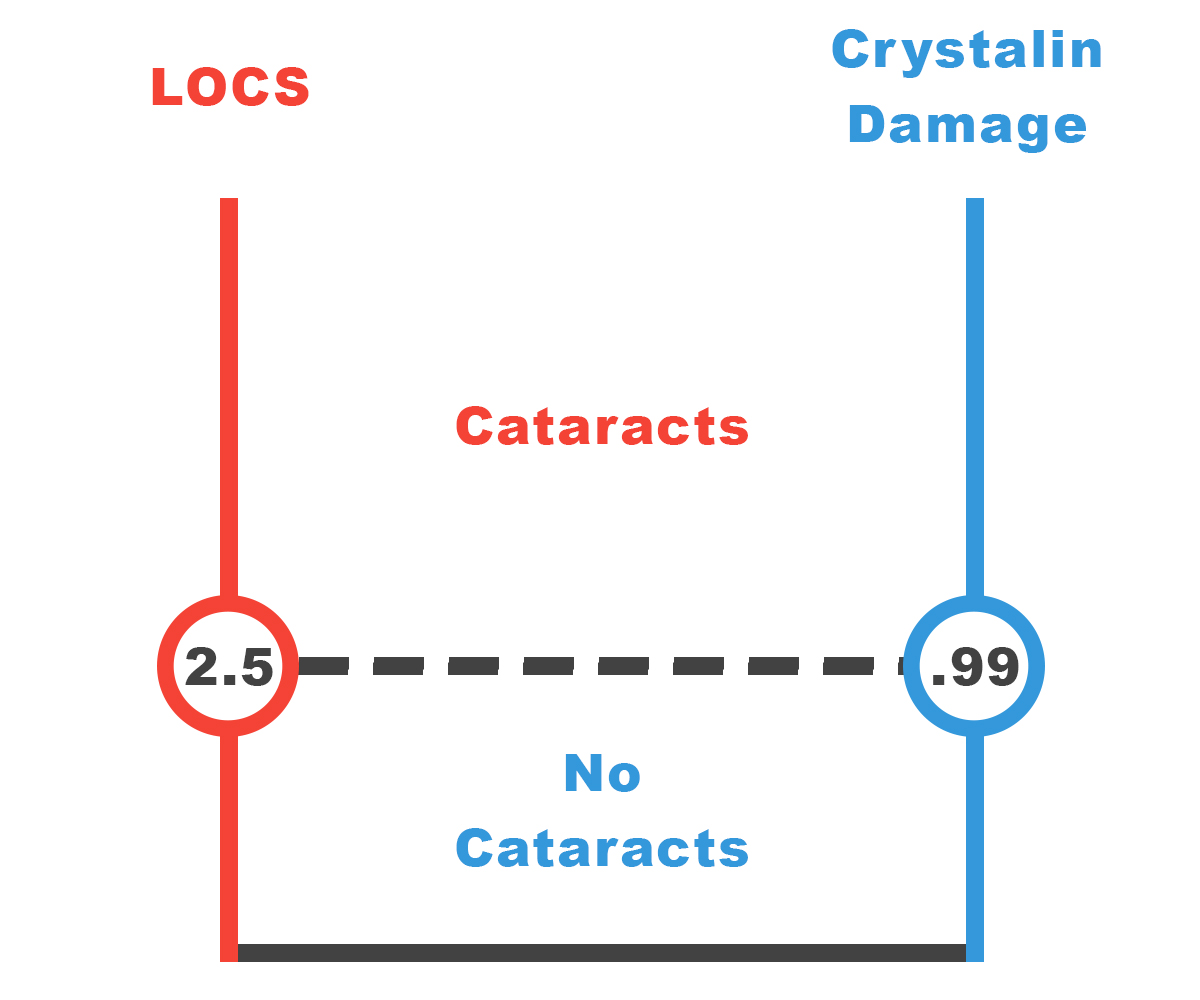
The amount of damage to crystallin by H2O2 determines the severity of a cataract (Spector). We relate the amount of crystallin damage to the corresponding rating on the LOCS scale, used by physicians to rate cataract severity. Our goal is to lower LOCS to below 2.5, the threshold for surgery. Through literature research as well as our own experimental data, we find the maximum allowable crystallin damage to prevent a LOCS 2.5 cataract from developing.
Measurement of Cataract Severity
There are three ways of measuring cataract severity, each used for a different purpose.
- Lens Optical Cataract Scale (LOCS)>: Physicians use this scale, from 0 – 6, to grade the severity of cataracts (Domínguez-Vicent).
- Absorbance at 397.5 nm: This is the experimental method, used by our team in the lab (c.d.)
- Crystallin Damage: This is a chemical definition. We quantify cataract severity as a function of how much oxidizing agents there are, as well as how long crystallin is exposed to oxidizing agents. (Cul XL)
LOCS to Absorbance: Literature Data
Numerous studies show how absorbance measurements can be converted to the LOC scale that physicians use. With the results of Chyluck, we construct the first two columns in Table 1.
Absorbance Equivalence to Crystallin Damage: Experimental Data
We use experimental measurements from our team’s Cataract Lens Model (link). They induced an amount of crystallin damage, and measured the resulting absorbance. With this relation graphed in Figure 2, we calculate the equivalent crystallin damage of each LOCS rating and absorbance, and create the third column of Table 1.
| LOCS | Absorbance (@397.5 nm abs units) |
Crystallin Damage (M-h) |
|---|---|---|
| 0.0 | 0.0000 | 0.0000 |
| 0.5 | 0.0143 | 0.1243 |
| 1.0 | 0.0299 | 0.2878 |
| 1.5 | 0.0497 | 0.4697 |
| 2.0 | 0.0751 | 0.6949 |
| 2.5 | 0.1076 | 0.9883 |
| 3.0 | 0.1492 | 1.3747 |
| 4.0 | 0.2706 | 2.5259 |
| 5.0 | 0.4691 | 4.3472 |
Conclusion
To guarantee that surgery is not needed for 50 years, we need to limit crystallin damage to 0.9883 units. If crystallin damage goes above this threshold, then surgery is needed. This is the crystallin damage threshold for a LOCS 2.5 cataract.
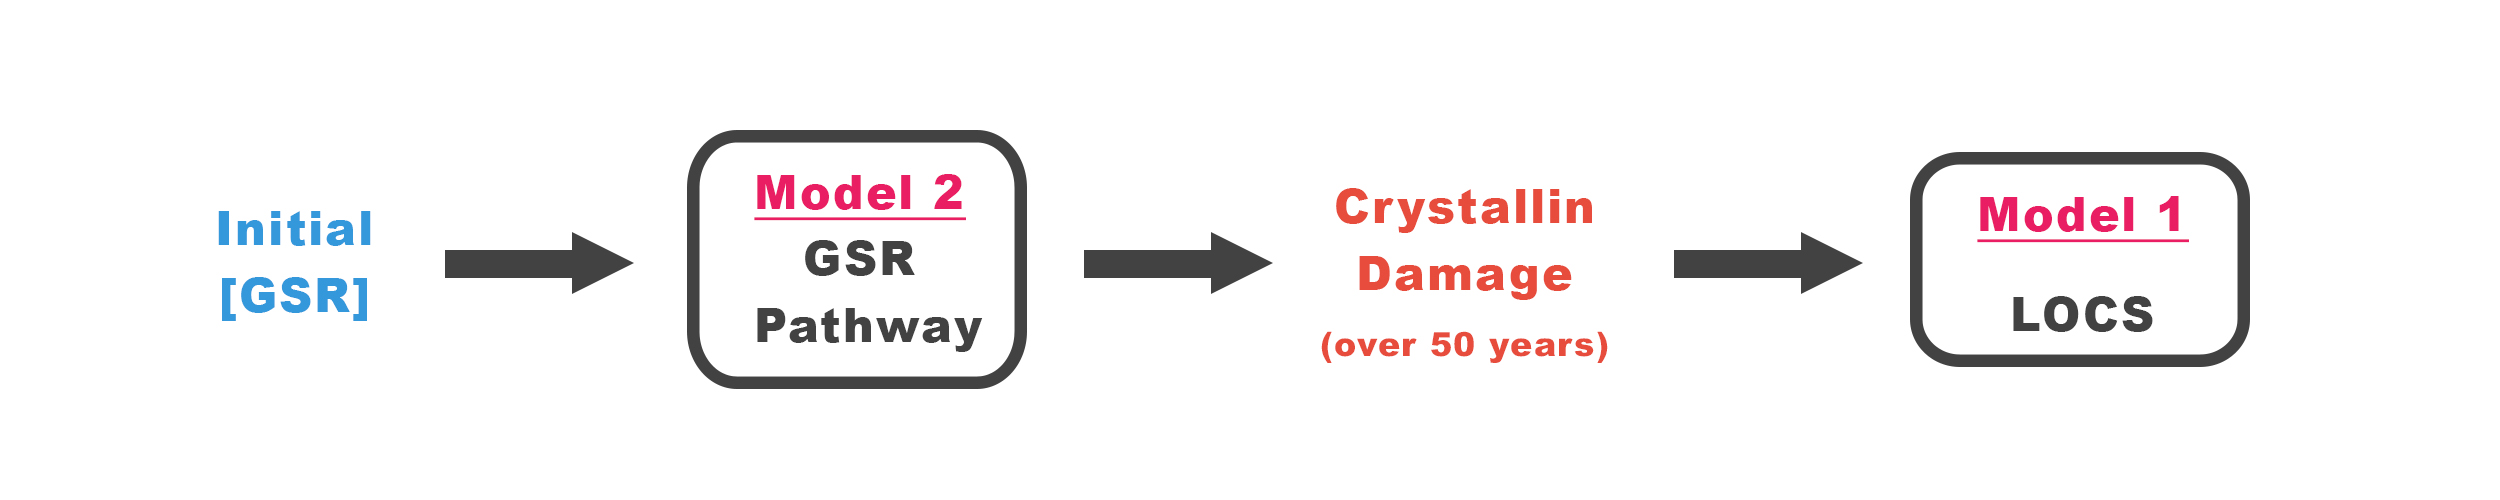
Model 2: GSR Pathway
Now that we know how much we need to limit crystallin damage to LOCS 2.5, we model the naturally occurring GSR Pathway in the lens of a human eye. We calculate the necessary GSR concentration to be maintained over 50 years so that the resulting cataract is below LOCS 2.5.
Chemical Kinetics Model: Differential Equations
By various enzyme kinetics laws, fully documented in the collapsible, we build a system of 10 differential equations based on 6 chemical reactions. All parameters, constants, and initial conditions are based off literature data (Ng, Melissa, Saravanakumar, Salvador, Adimora, Jones, Martinovich). Estimates made are also shown with assumptions and reasoning. The details are shown in the collapsible for interested readers.
Blackbox Approach: Testing GSR Impact
We vary the input, Initial GSR concentration, holding all other variables constant, and numerically solve for the amount of hydrogen peroxide over time. We can find the amount of crystallin damage accumulated over 50 years if different levels of GSR is maintained, which we graph in Figure 2.
From this graph, we can find the GSR concentration needed for the LOCS 2.5 threshold.
Crystallin Damage vs. GSR Level
According to literature data and our model, the naturally occurring GSR concentration is 10 uM (Clinical Ocular Toxicology). All curves show crystallin damage decreasing as GSR levels are increased, which supports both research and experimental data, and suggests that this prototype is effective in preventing crystallin damage. However, GSR levels need to be raised significantly, up to 40+ uM from the natural 10 uM of GSR in order to show long-term protection.
Figure 4.2 shows the amount of GSR we need to maintain for 50 years in order to prevent a LOCS cataract of a certain severity. The row of interest is LOCS 2.5, the threshold for surgery. Notice that we say “maintain” the level of GSR. This level needs to be constant at all times for 50 years for full prevention. The delivery of GSR to maintain this level is discussed in Model 3.
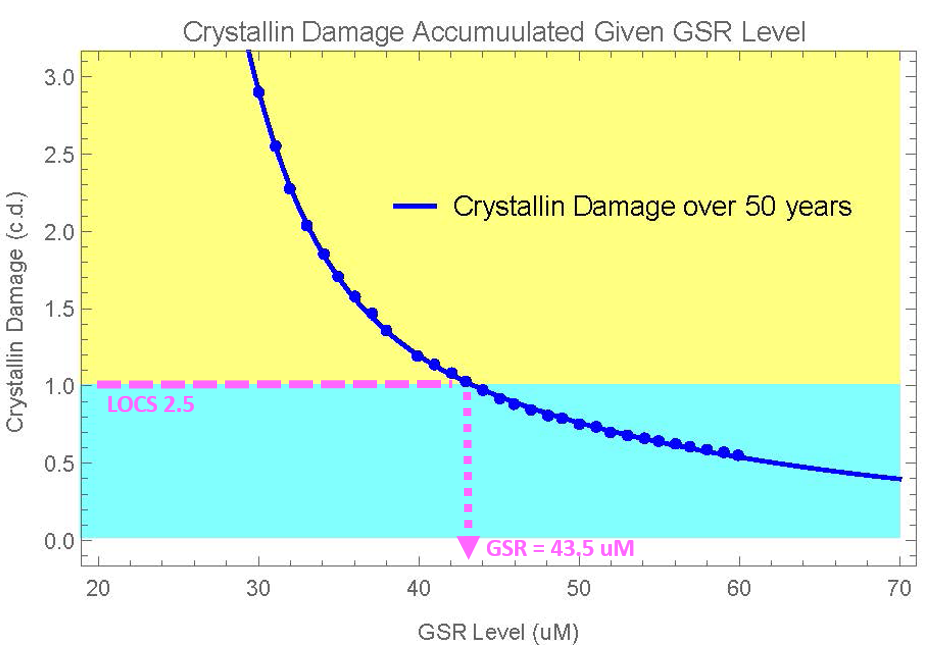
Conclusion
We need to maintain (NOT add) 43.5 uM of GSR in the lens so that the crystallin damage recorded over 50 years is below the LOCS 2.5 threshold.
Prevention: Prototype Function
Model 3: Nanoparticle Protein Delivery
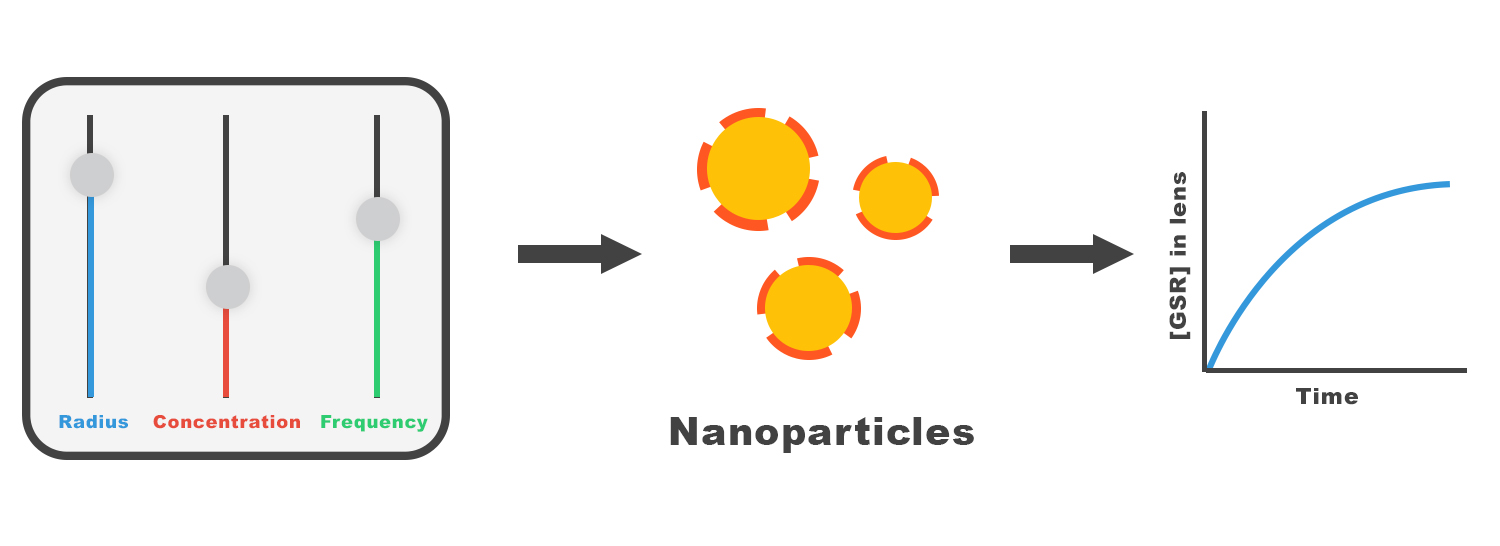
To maximize delivery efficiency to the lens, we encapsulate GSR in chitosan nanoparticles (Wang, Tajmir-Riahi). From Models 1-2, we have found the necessary concentration of GSR that needs to be maintained in the lens. Now we design nanoparticles that will maintain those amounts. We build a model find how nanoparticles release GSR at appropriate rates to control the amount of GSR in the lens, and find the best engineered design for nanoparticles.
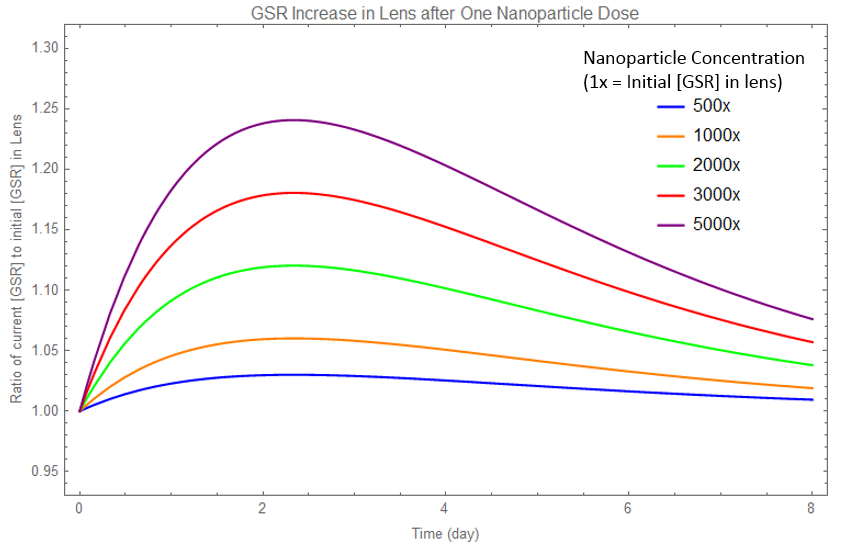
Single Dose: Change in GSR Concentration
In finding the best engineered design, we take into account variables such as nanoparticle radius and concentration. We build a differential equation model for the impact of a single dose of nanoparticles over time. To generalize the model, instead of using absolute concentrations, we use relative concentration, with respect to the natural amount, or initial amount of GSR in the lens. The full mathematics and details can be found in the collapsible.
We get two curves, concentration of GSR in the nanoparticles, and GSR release from nanoparticles, over time. This allows us to predict nanoparticle delivery rates before we perform the actual experiments.
Comparison with Experimental Data
Yet in our model, we do not know the thickness of the nanoparticle diffusion layer. After performing experiments, we can use measurements of our prototype device to find this thickness, and refine our model. A direct comparison of our model with our experiment data is shown in Figure ___.

Multiple Dose: Change in GSR Concentration
Each dose of nanoparticles, represented in the Single Dose model, can be repeated to create the Multiple Dose model. Below is a graph of GSR concentration over time when multiple doses of nanoparticles are added.
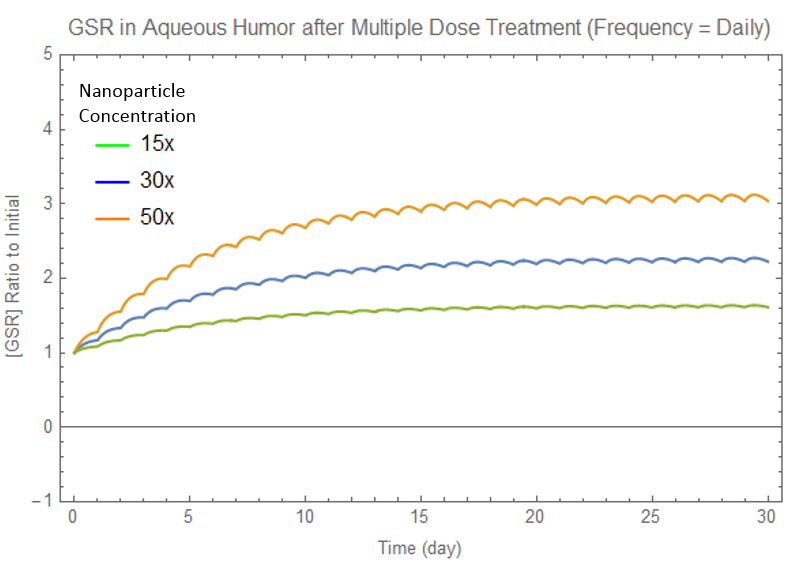
In Figure 4.6, all curves approach equilibrium, after which the concentration oscillates about equilibrium. We have three goals, in order of importance for best nanoparticle design:
- GSR equilibrium concentration equal to amount we desire (i.e. 43.5 uM from Model 2)
- Stability of concentration at equilibrium (Model 4 goes into deeper depth regarding sensitivity)
- Time to reach equilibrium (time for full prevention to come into effect)
To do so, we can alter different variables: GSR concentration in nanoparticles, nanoparticle radius, and dose frequency. For a full analysis of how each variable impacts the concentration function, see the collapsible. Below is a summary of the results:
| Independent Variable | Time to Reach Equilibrium | Equilibrium Concentration | Stability |
|---|---|---|---|
| Concentration | No impact | Proportional Increase | Slight Increase |
| Radius | No impact | Slight Decrease | No impact |
| Dose Frequency | No impact | No impact | Increase |
We find the optimal combination of parameters is daily doses (high frequency) of 200 nm nanoparticles (small), with a concentration of 76.88 uM of GSR in the nanoparticles (concentration).
The calculator at the end of the page can be altered, so if the LOCS threshold is not 2.5, a new concentration can be calculated.
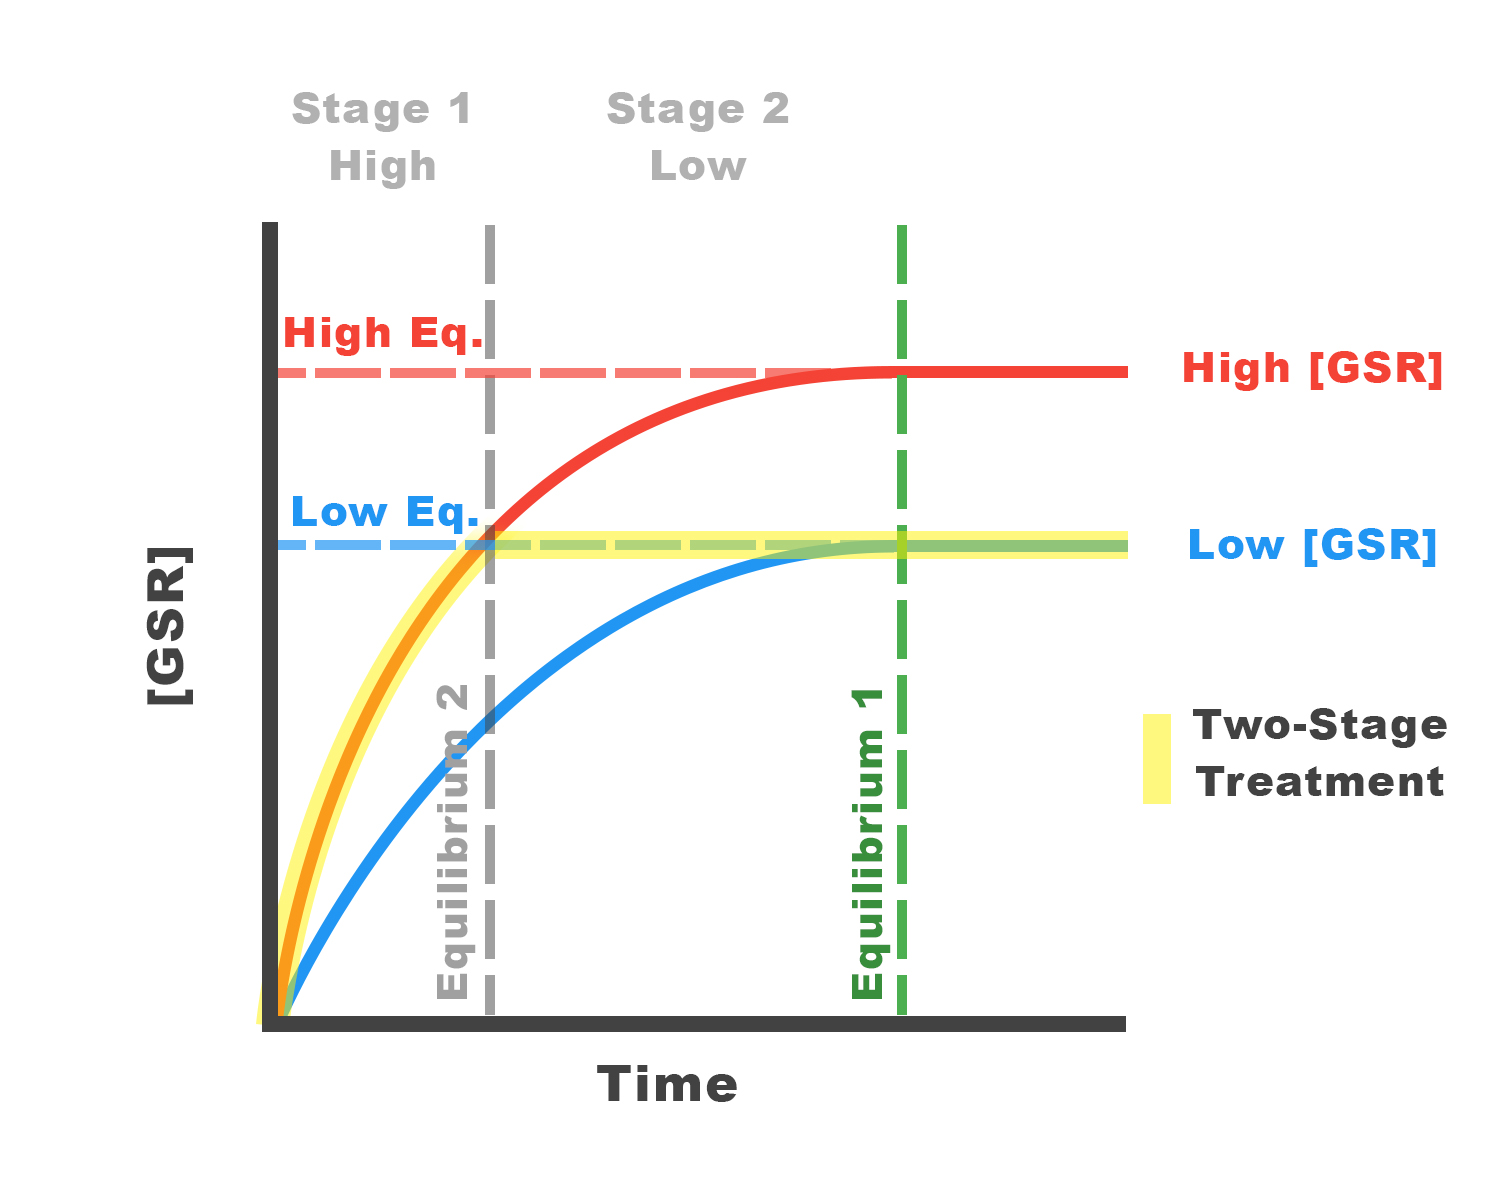
A Two Stage Eyedrop Approach
As shown in Table 2, we cannot alter the time to reach equilibrium, or reach full prevention. As supported by Clinical Ocular Toxicology, the time to reach equilibrium is a property of the lens that we cannot change. However, we propose a two-step eyedrop approach, of two differing nanoparticle concentrations, to decrease the time needed for full prevention. A full explanation is found in the collapsible.
Generalized Nanoparticles: Customizer
We built a full nanoparticle customizer, which generalizes the model to beyond delivery into the eye, found at the end of the page (Software). We hope that other iGEM teams who are interested in nanoparticle drug delivery can utilize this customizer to help them develop their own prototype.
Conclusion
We find the optimal combination of parameters is daily doses (high frequency) of 200 nm nanoparticles (small), with a concentration of 76.88 uM of GSR in the nanoparticles (concentration).
Model 4: Eyedrop Prototype
We have found a nanoparticle design to deliver GSR. We also need to model the function of eyedrops, to determine the concentration of GSR-loaded nanoparticles to put in eyedrops, and analyze how sensitive the resulting system is.
Bioavailability of GSR Delivery
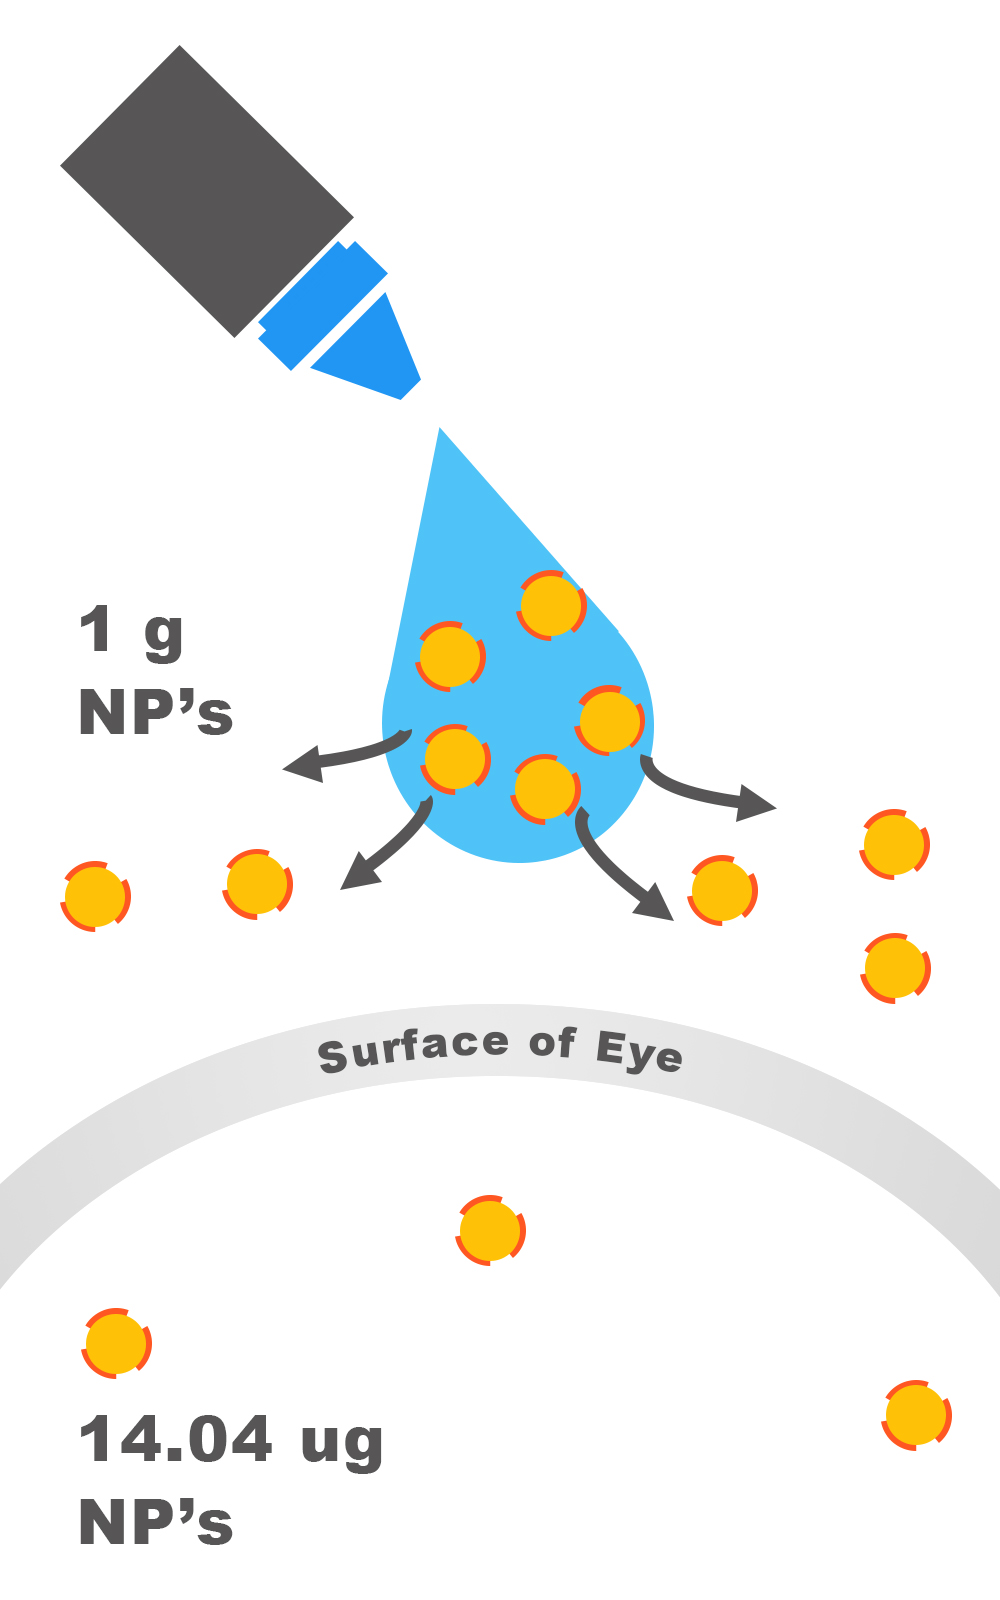
The eye is well protected from foreign material attempting to enter the eye. The corneal epithelium is the most essential barrier against topical drugs in eyedrops, and as a result, much of drugs in eyedrops are lost in tear drainage (Lux).
Bioavailability describes the proportion of the drug that reaches the site of action, regardless of the route of administration. For example, it is estimated that only 1-5% of an active drug with small solutes in an eyedrop penetrates the cornea (Bonate). In the case of nanoparticles, which are much larger than chemical molecules, more is lost (Clinical Ocular Toxicology).
The results show that the bioavailability of nanoparticles is about 1.404 x 10⁻³%, which means that for every gram of GSR (or any drug) we place into nanoparticles, approximately 14.04 ug of the drug reach the aqueous humor. The variance is 2.34 ug/g. (Calvo)
Necessary Adjustments in Eyedrops
To ensure that sufficient concentrations of GSR are delivered, we must place an excess of GSR. To determine how much, we simply divide the concentration of GSR in nanoparticles we found in Model 3 by the fraction of GSR that reaches the aqueous humor.
[Calculations]
We conclude that we need 5.48 mM of GSR in nanoparticles in our final eyedrop to maintain 43.5 uM GSR and thus 2.5 LOCS.
Sensitivity Analysis: Revisiting Nanoparticles Model
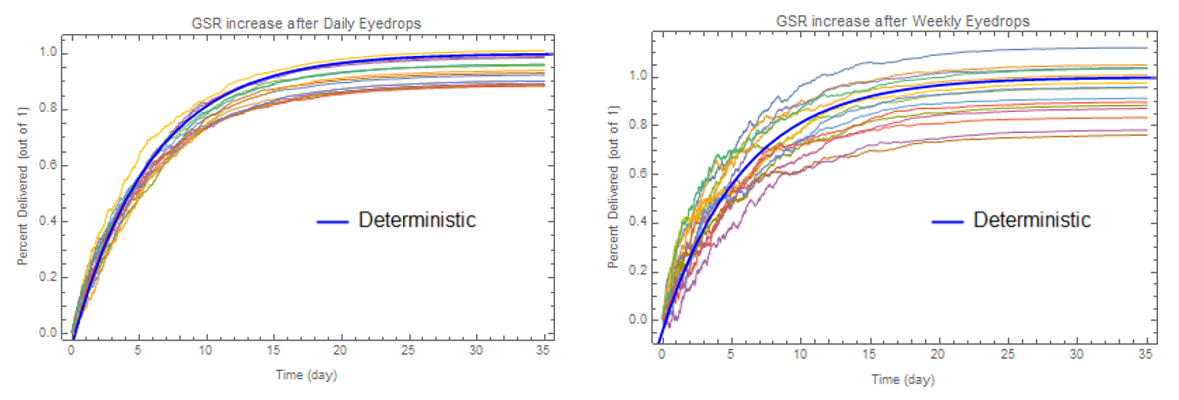
The mechanism for eyedrop delivery is complex, and there are variances in the bioavailability depending on the conditions of the eye (Clinical Ocular Toxicology). The thickness of the cornea, lens, other eye diseases, age, and even time of day may impact the bioavailability of the drug (Gaudana). We use a stochastic model to simulate Model 3 again, but this time, add a degree of variance. The result is shown in Figure 4.10.
The variance is impacted by the frequency of eyedrops. By giving eyedrops more frequently with less amounts given each time, the variance is decreased.
Ideally, we wish to deliver 100% of the GSR concentration of the amount found in Model 2 (43.5 uM). Because of variance, the actual amount maintained in the lens is different, shown in Figure 5. The full details and mathematics of the stochastic model can be found in the collapsible.
Insights into Manufacturing & Clinical Use
Treatment
We use the results from our previous models, and apply them to treatment. The only difference is that our treatment protein, CH25H, reverses cataract damage (Griffiths. We find the exact concentration of CH25H to reverse a cataract of a given LOCS score. The delivery models are unchanged, with the exception that the concentration of protein delivery will be different.
We use the results of Model 1 to calculate the LOCS equivalent crystallin damage we need to reverse (“negative crystallin damage”). Then we use experimental results to calculate the concentration of CH25H needed to reverse the cataract. We do not use Model 3, as this is a one-time treatment. After applying the results of Model 4, we can find the final concentration needed in CH25H eyedrops.
We propose eyedrops with 0.8 mg/mL CH25H. The number of drops needed for treatment is calculated in the software below.
CALCULATOR
Prevention
LOCS Score Threshold:We guarentee that by applying this prevention eyedrop daily, your LOCS score will remain below your threshold for 50 years.
Prevention Results
| Variable | Value | Source |
|---|---|---|
| Allowable LOCS | ||
| Crystallin Damage | c.d. | Model 1 |
| GSR Maintained | uM | Model 2 |
| Nanoparticle Conc. | uM | Model 3 |
| Eyedrop Conc. | mM | Model 4 |
| Eyedrop Result | mg/mL |
Treatment
LOCS Score Threshold:By applying the following treatment, leaving an hour before each dose of eyedrops, we guarentee that it will lower your LOCS score to essentially 0.
Treatment Results
| Variable | Value | Source |
|---|---|---|
| Allowable LOCS | ||
| Crystallin Damage | c.d. | Model 2 |
| Absorbance | a.u. | Model 1 |
| CH25H | uM | Model 5 |
| Eyedrop Conc. | uM | Model 4 |
| Eyedrop Result | mg/mL | Model 4 |
| # of Eyedrops | drops | (of 0.8 mg/mL eyedrop) |
Conclusion

×
Zoom out to see animation.
Your screen resolution is too low unless you zoom out