Gracetexana (Talk | contribs) |
|||
| Line 158: | Line 158: | ||
<h2>Conjugation</h2> | <h2>Conjugation</h2> | ||
| − | <p>We have attempted to conjugate GFP into both <i>G. oxydans</i> and <i>G. hansenii</i> with a Diaminopimelic Acid (DAP) auxotrophic strain of <i> E. coli</i>. | + | <p>We have attempted to conjugate GFP into both <i>G. oxydans</i> and <i>G. hansenii</i> with a Diaminopimelic Acid (DAP) auxotrophic strain of <i> E. coli</i> (The Barrick Lab). The plasmid contains the vector pMMB67EH, the promoter PA-1, GFP and a spectinomycin resistance gene. </p> |
<p>The first conjugation was done with two of our isolated <i>G. oxydans</i> strains, in case the strains might behave differently. First, a mixture between our recipient strain and the DAP auxotroph strain were plated on an LB+DAP agar plate to allow for conjugation to occur. After 24 hours of incubation, we scraped up the growth and plated each conjugation mixture onto a LB+Spec plate. 24-48 hours later, we viewed the potential transconjugants using a fluorescence microscope. We then picked these glowing colonies and streaked them out onto another LB+Spec plate. We then followed our protocol for genome DNA isolation and 16S sequencing, as described above, to confirm successful conjugation of <i>G. oxydans</i>. After troubleshooting our 16s procedure, we were finally able to obtain a viable sequencing result. However, all of the glowing colonies were identified as <i>E. coli</i>.</p> | <p>The first conjugation was done with two of our isolated <i>G. oxydans</i> strains, in case the strains might behave differently. First, a mixture between our recipient strain and the DAP auxotroph strain were plated on an LB+DAP agar plate to allow for conjugation to occur. After 24 hours of incubation, we scraped up the growth and plated each conjugation mixture onto a LB+Spec plate. 24-48 hours later, we viewed the potential transconjugants using a fluorescence microscope. We then picked these glowing colonies and streaked them out onto another LB+Spec plate. We then followed our protocol for genome DNA isolation and 16S sequencing, as described above, to confirm successful conjugation of <i>G. oxydans</i>. After troubleshooting our 16s procedure, we were finally able to obtain a viable sequencing result. However, all of the glowing colonies were identified as <i>E. coli</i>.</p> | ||
| Line 214: | Line 214: | ||
<html> | <html> | ||
<u>Approach</u> | <u>Approach</u> | ||
| − | <p>Two potential ways to reduce ethanol content over the course of the fermentation are to reduce the rate at which yeast produce ethanol or increase the rate at which acetic acid bacteria convert the ethanol to acetic acid. The first of these methods is the most direct approach, and was the first method considered. We considered UV mutagenizing <i>Lachancea fermentati</i>, a yeast our lab has isolated from kombucha, and then screening for ethanol production using a pH indicator, bromothymol blue, in media (<b>Figure 1</b>). Bromothymol blue is blue at basic pH, turns green around pH 7, and turns yellow around pH 6, and has been used previously to screen for fermentation rate among <i>Saccharomyces cerevisiae</i> colonies. | + | <p>Two potential ways to reduce ethanol content over the course of the fermentation are to reduce the rate at which yeast produce ethanol or increase the rate at which acetic acid bacteria convert the ethanol to acetic acid. The first of these methods is the most direct approach, and was the first method considered. We considered UV mutagenizing <i>Lachancea fermentati</i>, a yeast our lab has isolated from kombucha, and then screening for ethanol production using a pH indicator, bromothymol blue, in media (<b>Figure 1</b>). Bromothymol blue is blue at basic pH, turns green around pH 7, and turns yellow around pH 6, and has been used previously to screen for fermentation rate among <i>Saccharomyces cerevisiae</i> colonies (Robillard, 2007). During anaerobic respiration, both ethanol and CO2 are produced, and CO2 reacts with water to form carbonic acid, lowering the pH of the plate and changing the color of the indicator. A variety of problems with this approach led us to abandon it. It is likely that <i>L. fermentati</i> produce other acidic metabolic products, so pH would not necessarily correspond to amount of ethanol produced. This assay also relies on distinguishing differences in color in the agar to tell the difference in ethanol production between two colonies, a process that would be somewhat subjective. Additionally, the ethanol produced is necessary for the production of acetic acid, so slowing the rate of ethanol production would likely have slowed the production of the beverage and could have thrown off the flavor. For all these reasons, attempting to decrease the rate of ethanol production by <i>L. fermentati</i> does not seem like a good approach to lowering the ethanol content during the fermentation.</p> |
| − | <p>We next considered increasing the rate at which acetic acid bacteria in kombucha convert ethanol to acetic acid. Increasing this rate would utilize more ethanol as it is produced, ideally lowering the ethanol content throughout the course of the fermentation. Two enzymes facilitate steps in this pathway. | + | <p>We next considered increasing the rate at which acetic acid bacteria in kombucha convert ethanol to acetic acid. Increasing this rate would utilize more ethanol as it is produced, ideally lowering the ethanol content throughout the course of the fermentation. Two enzymes facilitate steps in this pathway (Mamlouk and Gullo, 2013). An alcohol dehydrogenase (PQQ-ADH) enzyme facilitates the conversion of ethanol to acetaldehyde, and a membrane-bound aldehyde dehydrogenase (ALDH) facilitates the conversion of acetaldehyde to acetic acid. In order to increase the rate at which ethanol is converted into acetic acid, we propose using Golden Gate Assembly to create a genetic construct in which expression of PQQ-ADH and ALDH is governed by a Tac-promoter (pTac), a hybrid promoter which is inhibited except in the presence of allolactose. The construct would be transformed into electrocompetent <i>Escherichia coli</i> and transferred to <i>Gluconacetobacter hansenii</i> via conjugation.</p> |
<p> | <p> | ||
<u>Identifying genes of interest</u> | <u>Identifying genes of interest</u> | ||
<p> | <p> | ||
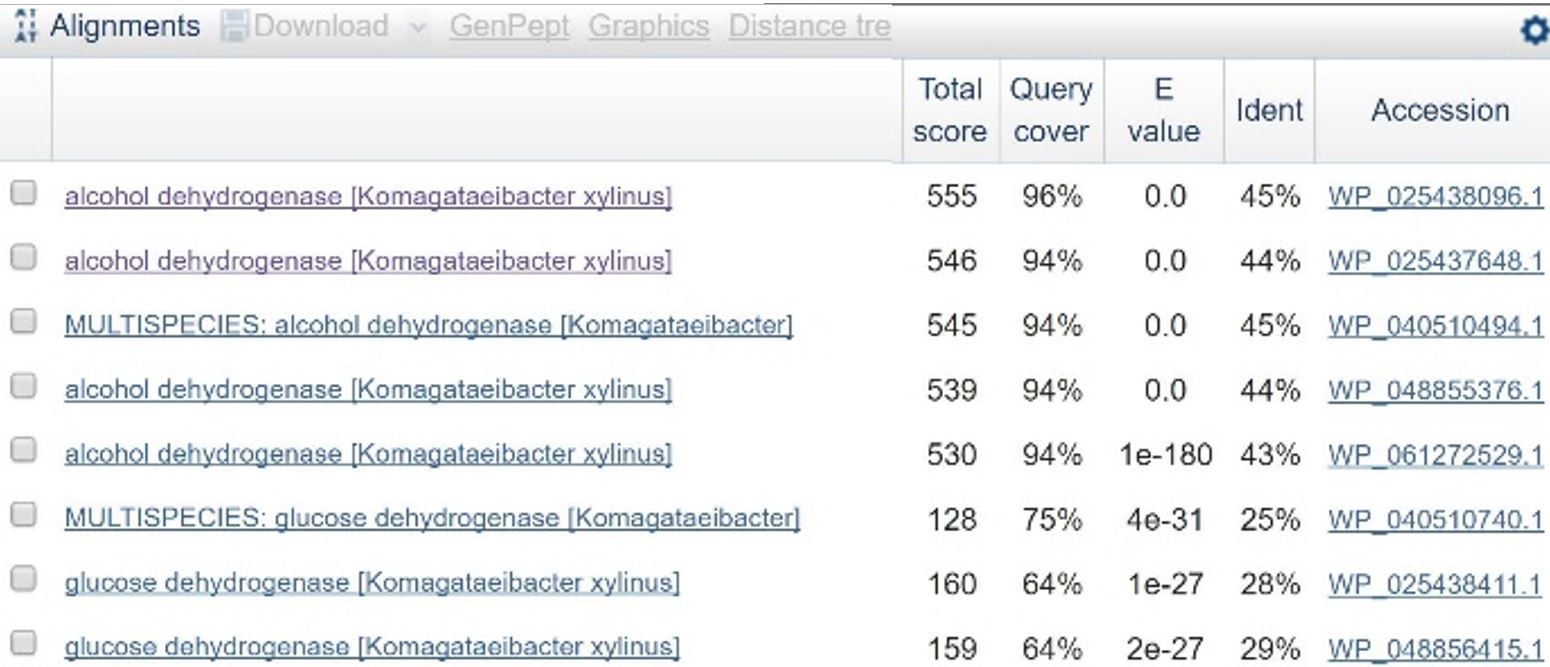
| − | In order to design a construct increasing expression of PQQ-ADH and ALDH in <i>Ga. hansenii</i>, it was necessary to find the genome of the ATCC strain and identify the coding sequences for these genes. The whole genome shotgun sequence for our organism, ATCC 53582, is published on NCBI | + | In order to design a construct increasing expression of PQQ-ADH and ALDH in <i>Ga. hansenii</i>, it was necessary to find the genome of the ATCC strain and identify the coding sequences for these genes. The whole genome shotgun sequence for our organism, ATCC 53582, is published on NCBI (Abbot, 2015) with annotations regarding the functions of specific sequences. Coding sequences are annotated with proposed gene products. Though there are several aldehyde dehydrogenase genes annotated in the genome, there is only one which is described as membrane-bound, matching the description from Mamlouk and Gullo (Mamlouk and Gullo, 2013). There are additionally multiple alcohol dehydrogenases. A known amino acid sequence for a homologous PQQ-ADH in <i>Comamonas testosteroni</i> was compared against sequences in the <i>Ga. hansenii</i> genome using BLAST (<b>Table 1</b>). One ADH enzyme found in the <i>Ga. hansenii</i> genome sequence matches the <i>C. testosteroni</i> sequence with a query cover value of 94% and an E value of 0 (third line of <b>Table 1</b>).</p> |
<p><u>Creation of Golden Gate parts</u> | <p><u>Creation of Golden Gate parts</u> | ||
</html> | </html> | ||
| Line 243: | Line 243: | ||
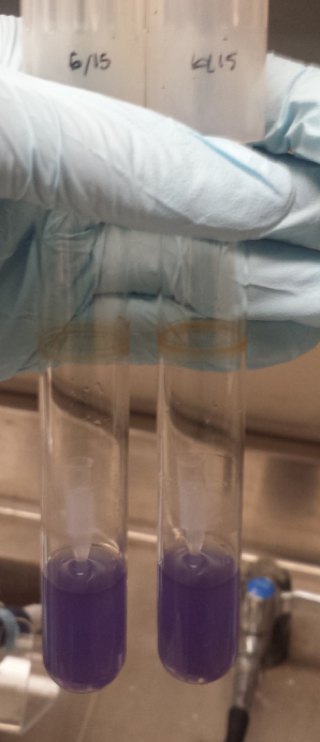
[[File:T--Austin_UTexas--Cpx_pH_Culture_Tubes_2.png|thumb|right|549px| Figure 1. Testing the CpxR Construct in pH 6-9. From left to right is control pH 6-9 and then experimental pH 6-9. These are showing the gradient change in expression accordingly with the change of pH due to a pH-dependent promotor compared to consistent expression accordingly with a promoter that is always "on". Credit: Sofia Chinea]] | [[File:T--Austin_UTexas--Cpx_pH_Culture_Tubes_2.png|thumb|right|549px| Figure 1. Testing the CpxR Construct in pH 6-9. From left to right is control pH 6-9 and then experimental pH 6-9. These are showing the gradient change in expression accordingly with the change of pH due to a pH-dependent promotor compared to consistent expression accordingly with a promoter that is always "on". Credit: Sofia Chinea]] | ||
<html> | <html> | ||
| − | <p>CpxA-CpxR is a two-component mechanism that is activated at pH 7.4 and repressed at pH 6.0. CpxA is an intermembrane protein that autophosphorylates at a certain external pH, CpxR (a kinase) then gets phosphorylated by CpxA and acts as a transcription factor. This system originally is a transcription factor for the virF gene, but virF was replaced with a reporter. The original sequence was found in <i>Shigella sonnei</i>, but <i>E. coli</i> has a homolog of these proteins so all that is required on the construct is the appropriate prefix/suffix and CpxR binding site | + | <p>CpxA-CpxR is a two-component mechanism that is activated at pH 7.4 and repressed at pH 6.0. CpxA is an intermembrane protein that autophosphorylates at a certain external pH, CpxR (a kinase) then gets phosphorylated by CpxA and acts as a transcription factor. This system originally is a transcription factor for the virF gene, but virF was replaced with a reporter. The original sequence was found in <i>Shigella sonnei</i>, but <i>E. coli</i> has a homolog of these proteins so all that is required on the construct is the appropriate prefix/suffix and CpxR binding site (Nakayama and Watanabe, 1995; Nakayama and Watanabe, 1998). |
</html> | </html> | ||
[[File:T--Austin_UTexas--YGCPtube.png|thumb|left|275px|Figure 3. amajLime expressed in <i>E. coli</i> in liquid LB. Credit: Sofia Chinea]] | [[File:T--Austin_UTexas--YGCPtube.png|thumb|left|275px|Figure 3. amajLime expressed in <i>E. coli</i> in liquid LB. Credit: Sofia Chinea]] | ||
| Line 252: | Line 252: | ||
<h4>CadC</h4> | <h4>CadC</h4> | ||
| − | <p>The CadC operon is a native pathway in <i>E. coli</i>, involved in the cadaverine synthesis pathway. The protein CadC protein on the operon is produced and activates segments downstream of the operon on the CadBA receptors. The CadC protein is pH sensitive to an external pH 5.5 and below, as well as lysine dependent. A point mutation on codon 265, in which argenine is converted to cystine, causes the CadC protein to become lysine independent. | + | <p>The CadC operon is a native pathway in <i>E. coli</i>, involved in the cadaverine synthesis pathway. The protein CadC protein on the operon is produced and activates segments downstream of the operon on the CadBA receptors. The CadC protein is pH sensitive to an external pH 5.5 and below, as well as lysine dependent. A point mutation on codon 265, in which argenine is converted to cystine, causes the CadC protein to become lysine independent (Kuper and Jung, 2005).</p> |
<p>Despite several attempts, we have been unable to grow the modified CadC operon on pSB1C3 in <i>E. coli</i> suggesting some form of cell toxicity. Specifically, all plasmids isolated have contained additional point mutations that appear to inactivate the expression of CadC. Due to this apparent toxicity, no data regarding the lysine-independent CadC could be collected. Alternative acidic range pH sensor candidates have been identified and are discussed below.</p> | <p>Despite several attempts, we have been unable to grow the modified CadC operon on pSB1C3 in <i>E. coli</i> suggesting some form of cell toxicity. Specifically, all plasmids isolated have contained additional point mutations that appear to inactivate the expression of CadC. Due to this apparent toxicity, no data regarding the lysine-independent CadC could be collected. Alternative acidic range pH sensor candidates have been identified and are discussed below.</p> | ||
| Line 258: | Line 258: | ||
<h4>P-atp2</h4> | <h4>P-atp2</h4> | ||
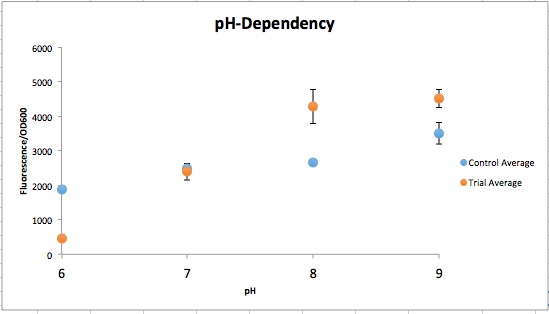
| − | <p>The P-atp2 promoter, native to the bacterium <i>Corynebacterium glutamicum</i> is reportedly induced at pH 7, to pH 9 (<a href="https://2015.igem.org/Team:BIT-China/Parts">BIT-China-2015</a> and <a href="http://parts.igem.org/Part:BBa_K1675021">BBa_K1675021</a>). | + | <p>The P-atp2 promoter, native to the bacterium <i>Corynebacterium glutamicum</i> is reportedly induced at pH 7, to pH 9 (<a href="https://2015.igem.org/Team:BIT-China/Parts">BIT-China-2015</a> and <a href="http://parts.igem.org/Part:BBa_K1675021">BBa_K1675021</a>). Utilizing the blue chromoprotein (<a href="http://partsregistry.org/Part:BBa_K592009">BBa_K592009</a>), a test was designed in which a plasmid containing the P-atp2 promoter with the blue chromoprotein was grown alongside an <i>E. coli</i> line that contained a plasmid with just the blue chromoprotein. We expected to see constant blue chromoprotein production in the control series (those that lacked P-atp2) and a visual increase in blue chromoprotein as the pH was raised from 6 to 9 in the cells that contained the P-atp2 construct. The construct utilized as a control can be found on the iGEM registry <a href="http://parts.igem.org/Part:BBa_2097001">BBa_K2097001</a> as as in figure 5.</p> |
<p>However, as seen in figure 4, no clear change in color expression appears in the experimental trials, suggesting a lack of sensitivity of the P-atp2 promoter.</p> | <p>However, as seen in figure 4, no clear change in color expression appears in the experimental trials, suggesting a lack of sensitivity of the P-atp2 promoter.</p> | ||
</html> | </html> | ||
| Line 268: | Line 268: | ||
<h4>GOX Sequences as Putative Promoters</h4> | <h4>GOX Sequences as Putative Promoters</h4> | ||
| − | <p>Three endogenous upstream regions of loci on the <i>Gluconobacter oxydans</i> chromosome were reported to show increased mRNA synthesis as pH decreased, were isolated and obtained, as seen in table 1. | + | <p>Three endogenous upstream regions of loci on the <i>Gluconobacter oxydans</i> chromosome were reported to show increased mRNA synthesis as pH decreased, were isolated and obtained, as seen in table 1 (Hanke, et al., 2012). Using Golden Gate assembly, these putative promoters have been placed on the Golden Gate entry vector pYTK001 for later use. By utilizing these pH-sensitive promoters with different reporters and transforming them into multiple organisms in kombucha, the visualization of the microbes and their location in kombucha would be possible (Lee, et al., 2015). This will serve as a stepping stone into further understanding how the microbiome of kombucha changes as it brews as well as determining organism concentration specific times during the brewing process.</p> |
<center> | <center> | ||
Revision as of 18:40, 19 October 2016
Results

Click on one of the images below to learn more about our results!


