Background
In the kinetic experiment, the fluorescence signal of the proteins CsgA and CsgA-GFPmut3 (I13504) proteins expressed by our constructs was recorded in time. Besides fluorescence, we measured the OD600 of our cultures in order to normalize the fluorescence signal per cell. The main goal of this experiment was to see, if different induction levels with increasing rhamnose concentrations would lead to a higher production of CsgA. If this was true, the quantity of produced CsgA present in the medium could be controlled. This degree of control is key to achieving our main goal; making a biofilm with reproducible strength.
The obtained results can be used to calculate the promoter strength at different induction levels of rhamnose in our model. In order to use the mathematical model previously constructed in the modeling section, it has to be fitted to GFPmut3 units/cell/second. Therefore, we set up a calibration curve with exactly the same settings as the fluorescent experiment in order to correlate fluorescence signal to units of GFPmut3 per cell.
Methodology
In this experiment, the strains ∆csgA – csgA- I13504 and ∆csgA – csgA strain were both induced with rhamnose at different concentrations. The different induction levels can be found in Table 1.

All conditions (ID 1 – 6) were carried out in triplicates for accurate statistical analysis of the data. The different cultures were grown and induced in a 96-well plate. The OD600 and the fluorescence signal was recorded with a plate reader during an 18-hour period at 30°C.
Results and discussion
In Figure 5, the fluorescent signal was normalized with the number of cells and plotted as a function of time. The red bars denote the error within each ID.
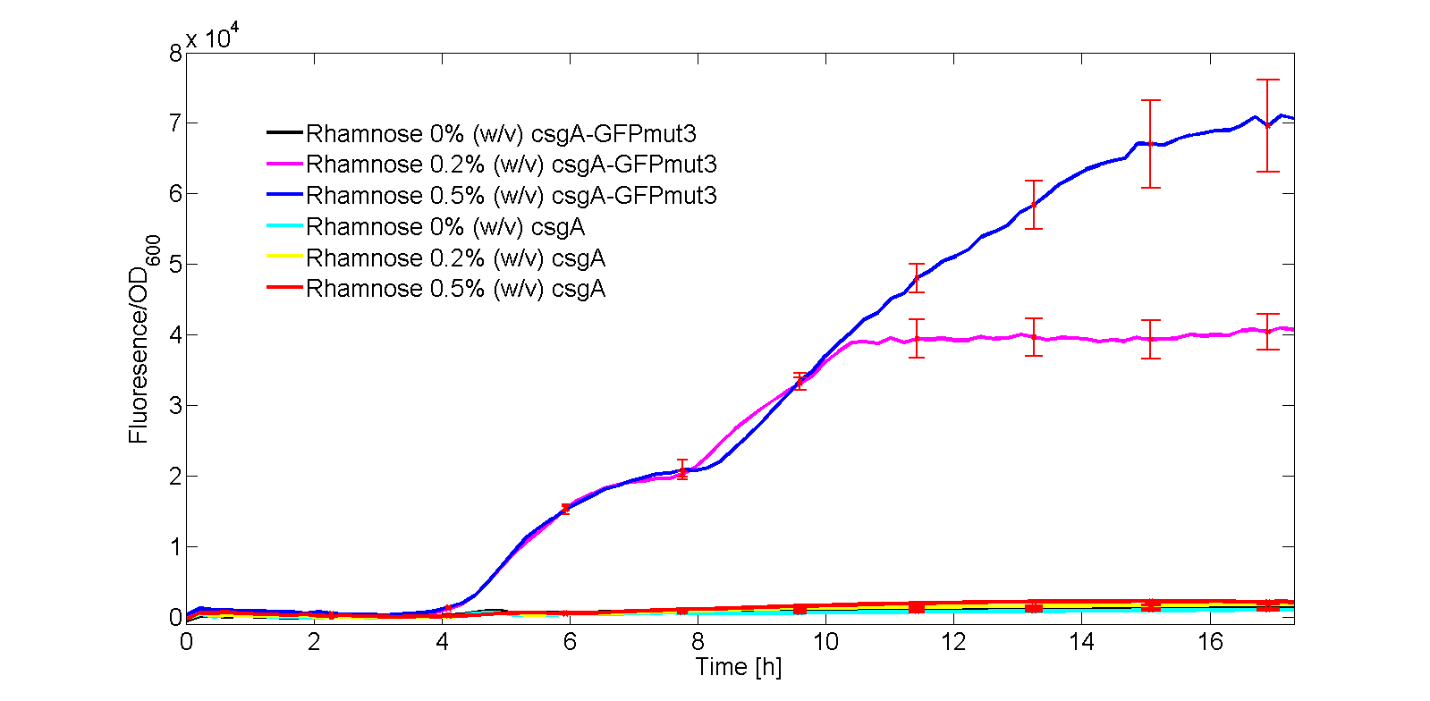
As observed in Figure 5, only the strains carrying the csgA-GFPmut3 construct induced with 0.2% (w/v) and 0.5% (w/v) showed a clear increase in fluorescence signal over time. The rest of the cultures, didn’t show significant fluorescence over time.
Furthermore, we have showed that increasing concentrations of rhamnose lead to increasing amounts of produced csgA-GFPmut3 and thus fluorescence. Finally, as the fluorescence signal is normalized by the cell density, one can make statements about the activity of the rhamnose promoter. The promoter seems to not be active directly after induction, but activity is observed after a time period of 3 to 4 hours. This is in accordance with data from literature (Wegerer et. Al, 2008), in which low fluorescence levels were observed after 2 hours of induction of the rhamnose promoter.
The calibration line of fluorescence versus mass amount GFPmut3 is given in Figure 6.

The corresponding function of the GFPmut3 calibration line is:

With massGFP in ng.
In the modelling, the fluorescent data in Figure 5 will be further converted to molecules GFPmut3/cell and the promoter activity will be calculated for both the 0.2% (w/v) and 0.5% (w/v) level of rhamnose induction. With this kinetic experiment, we have proven that our csgA-GFPmut3 construct is able to produce different levels of GFPmut3 by varying the rhamnose concentration.
- Parts Construction:
- 3SpyTag (A) assemble
- SUP PCR
- pET28a backbone PCR
- SpyCatcher (B) PCR
- Monomeric Streptavidin (mSA) PCR