| Line 151: | Line 151: | ||
<li><a href="/Team:NAWI-Graz/Human_Practices">Human Practices</a></li> | <li><a href="/Team:NAWI-Graz/Human_Practices">Human Practices</a></li> | ||
<li><a href="/Team:NAWI-Graz/Silver">Silver</a></li> | <li><a href="/Team:NAWI-Graz/Silver">Silver</a></li> | ||
| − | + | ||
| − | + | ||
</ul> | </ul> | ||
</li> | </li> | ||
Revision as of 13:39, 19 October 2016
Navigation
Week 0
Before the actual lab work was started the whole in silico had to be planed. Therefore 10 different parts were designed. Each of them contains a biobrick suffix and a biobrick prefix, a promoter and ribosome binding sites. To this special bricks, unique restriction sites (XbaI, SpeI, EcoRI and PstI) are added for control digestion and directed ligation of the different parts. The toxin parts (Fig.1, Fig.3, Fig.5 and Fig.7) contain the tac-promotor because the toxin and the DAM methylase should be expressed after induction with IPTG. With the Dam methylase a 50% higher mutation rate is obtained. The chromoprotein part (Fig.2, Fig.4, Fig.6 and Fig.8) possesses a constitutive promoter for the reason that the chromoprotein and the antitoxin should be expressed the whole time. Other parts are the vector (Fig.10) and the lacI part (Fig.9).
Fig. 1: ccdB toxin and the DAM methylase
Fig. 2: chromoprotein blue and the antitoxin ccdA

Fig. 3 mazF toxin and DAM methylase

Fig. 4 chromoprotein red and the antitoxin MazE

Fig. 5: yafO toxin and DAM methylase

Fig. 6: chromoprotein yellow and the antitoxin yafN

Fig. 7: kid toxin and DAM methylase

Fig. 8: chromoprotein green and the antitoxin kis

Fig. 9: lacI gene

Fig. 10: the vector, which consists an ampicillin resistence gene for selection
For the following ligation the different parts are cut with different restriction enzymes. The first step is to cut the chromoprotein-parts with EcoRI and SpeI, the toxin parts with PstI and XbaI, and the vector with EcoRI and PstI (Fig.11).

Fig. 11: The chromoprotein/antitoxin part and the toxin/DAM-methylase part are ligated into the vector
The second step is that the lacI-gene is cloned into this construct for selectable reasons. Therefore the cloned vector and the lacI-gene are cut with PstI (Fig.12).

Fig. 12: The finished vector
Week 1 (11.07 – 15.07)
Preparing media & Electrocompetent E. coli cells
At the beginning, we had to prepare LB medium including 5g/L yeast extract, 10g/L trypton and 10g/L sodium chloride, as well as, agar plates using a premixed agar from Invitrogen. Ampicillin was added in a concentration of 10mg/ml for selective reasons.
During the first week we were also preparing electrocompetent Escherichia coli XL1-Blue MR Rec A+ cells for further transformations. First of all, the strain was provided by our department at TU Graz. After doing ONCs by picking a single colony, we prepared a so called “main culture” and let the cells grow up to an OD600 of 0.8. The rest of the proceduce was done using the general protocol for electrocompetent cells.
Week 2 (18.07 – 22.07)
Test-Transformation & pJET cloning of gBlocks
To test our electrocompetent cells we performed a transformation using a provided vector. In the first attempt 40 µl of ECC (electro competent cells) and 2 µl of vector DNA were used. The results showed, as we excepted, a non-countable number of cells on the plate.
The gBlocks from IDT were resolved in 50 µl ddH2O. After that, every single gBlock was cloned into a pJET-Vector and transformed into ECC using the „CloneJET PCR Cloning Kit: Blunt-End Cloning Protocol“. The transformants were plated on LB–Amp plates and incubated over night at 37 C°. Our further plan was to isolate the plasmid–DNA from the obtained transformants for sequencing. This was not possible because nothing was grown on our plates. After a few days we found out that the recommended incubation-time of 5 min at 22 °C for the ligation-mixture was too short. We extended the incubation time to 40 minutes. Furthermore we stopped the ligation at 70 °C for 5 minutes and also different to the protocol we de-salted the ligation-mixture (20 µl for 20 minutes), as well as, used 150-200 ng of DNA, instead of the recommended 100 ng. For transformation of our optimized ligation we used 2 µl of ligation-mixture and 80 µl of electrocompetent cells.
Week 3 (25.07 – 29.07)
Preparing gBlocks for sequencing
By using the optimized blunt-end cloning protocol we finally received first positive transformation results, more specifically colonies. After doing dilution plating (5 of each strand) (Fig. 13 and Fig. 14) we also prepared ONCs out of the colonies for plasmid isolation.
Another task of the week was to prepare glucose medium, by adding glucose to our LB medium, for repression of the promotors to keep the toxin down. Otherwise they would kill themselves already in the first step of cloning.
Furthermore, at the end of the week, new diluting plating was done because the first ones did not grow in a proper way.

Fig 13: pJET Blue diluting plate (before sequencing)

Fig 14: on the left side you can see the blue and the red diluting plates, which also were working, not all of the other diluting plating were working well, just mazE.
Week 4 (1.08 - 5.08)
Sequencing results and PCR
New ONCs of all 10 cloned gBlocks (in pJETs) were done from our diluting plating. To isolate the plasmid–DNA we used the GeneJET Plasmid Miniprep Kit. To get the concentration of the extracted DNA NanoDrop was used and showed results from 22 ng/µl up to 224 ng/µl.
We sent 60 – 80 ng of each gBlock–pJET DNA with the proper primers for sequencing to Microsynth Austria GmbH. The following day, we analyzed the sequencing results and saw that the gBlock red, blue, lacI and mazF had the correct DNA–sequence (Fig. 15). The other gBlocks showed no matches (Fig. 16). Because of the fact that the other gBlocks didn`t show the expected results, we changed our plan and started to use pUC19 (Fig. 17) instead of our own designed vector and our lacI part. Unfortunately, we didn’t have enough gBlocks left for further experiments. So we decided to run a PCR, followed by a gel electrophoresis.
The gel didn’t show clear bands at the appropriate size.

Fig 15: The sequencing results of the red part. the third clone showed the best results, so subsequent works were done with clone 3.

Fig 16: This is an example how bad our sequencing results were. In the case of the vector we could work together.
Week 5 (08.08 – 12.08)
PCR of gBlocks for directed cloning into pUC19
To see the quality of our delivered gBlock–DNA, we ran a gel electrophoresis using pure gBlock-DNA. The surprising results have shown that there were some samples with very less DNA and even some with no DNA at the appropriate size. The samples that have shown a band were cut out at the correct length and resolved, followed by a PCR reaction:
98 °C 30 sec
98 °C 10 sec I
68 °C 20 sec I 30 x
72 °C 30 sec I
72 °C 7 min
4 °C ∞
Because of the fact that some gBlocks didn’t show results at all, we asked IDT for new samples and they sent ccdB toxin & our designed vector again.
Moreover, a new attempt of cloning ccdB into a pJET vector was performed with the last few µl of the original sample. After transformation colonies were detected and used for a raster-screening, to double-check the size of our gBlock DNA. The correct ones were used for a colony PCR as following:
98 °C 5 min
98 °C 10 sec I
68 °C 20 sec I 36 x
72 °C 30 sec I
72 °C 7 min
4 °C ∞

Fig 17: The pUC19 vector we choose to work together, it has the restriction sites and the characteristics we need.
Week 6 (16.08 – 19.08)
Miniprep & Sequencing of pUC19
As described above, the pUC19 vector was used and provided on plates, by our department. To get the DNA of pUC19 miniprep was done. Also, a miniprep of the apparently correct ccdB from the raster-screening was done. After that, the DNA was sent to sequencing and the results have shown that the toxin (ccdB) was not in the sequence anymore (Fig. 18). It was probably looped out by the cells because of its toxicity as a result of the leaky tac-promotor. It was possible because two identical ribosome binding sites at the beginning and at the end of the sequence were designed.

Fig 18: In this figure is shown that the toxin was looped out.
Therefore, a new primer was designed to modify one of the binding sites, as well as, removing the tac-promotor. The tac-promotor could be removed because since we used pUC19 there was no need for it anymore. pUC19 already includes a lac-promotor.
Week 7 (22.08 – 26.08)
Restriction & Ligation of the parts
After deciding to work on with red + mazF and blue + ccdB only, we did a PCR of the two gBlocks red and mazF, followed by a PCR product clean-up (using the protocol: PCR product clean-up kit from Thermo Fisher). The next step was to digest the fragments: red with the restriction enzymes EcoRI + Spe, mazF: XbaI + PstI and pUC19: EcoRI + PstI. Amounts of DNA were as following: pUC 1000ng, PCR-Products (red and mazF) 1000 ng; filled up with buffer and 1 µl restriction enzyme each to 20 µl. The digestion was performed at 37°C for 40 min, as well as, stopped at 80°C for 5 min.
Furthermore, the restricted parts were put together in a 2-step ligation reaction: red + mazF followed by Red_mazF + pUC19.
After ligation an aliquot of the plasmid was cut again by PstI to get a linear fragment and to check the size.
X-Gal plates were prepared for blue-white screening, by adding X-Gal to the premixed agar.
With the rest of the ligation sample a transformation was performed and plated on the X-Gal plates. The next day when checking the plates, there were no blue colonies but also no red colonies (our transformants should be red because of the chromoprotein “red”). Still some single colonies were picked to perform a colony PCR. The next day some red colonies were found, though. So new diluting plating was done. The cells didn’t show colour the next day again.
For this reason, new restriction and ligation attempts were performed. To get a greater chance of correct colonies 3-point-ligation was done additionally. Another try was to use less PCR product. Still no result was as expected.
Week 8 (29.08 – 02.09)
Restriction & Ligation, new ccdB & BioBricks
Over the weekend the diluting plating plates from the week before surprisingly got red. For this reason, we performed a colony PCR, followed by gel electrophoresis, to check the size of the bands. A ONC was also done to do a miniprep and a aliquote was plated (Fig. 19). After measuring the amount of DNA the plasmids were cut by PstI and Xbal. To check if both inserts and the vector were present in the plasmid a gel electrophoresis was done. Only one sample showed the expected results.

Fig 19: Red colonies
As it seemed that the fourth sample was correct, it was sent to sequencing.
The new ccdB from IDT finally arrived and was used for PCR to get a higher amount of the correct fragments and to change the RBS with our new primers. After gel electrophoresis the bands were cut out and the DNA was extracted with GeneJet Gel Extraction Kit from Thermo Fisher. Afterwards pJET cloning was performed as the weeks before. Afterwards the pJET fragment was cut and a gel electrophoresis was run to check if ccdb had the correct size. Sample 1, 5 and 6 showed good results and were sent to sequencing. Meanwhile, for the ccdB_blue clone, a new restriction was performed (directly from PCR product, without waiting for any sequencing results), including ethanol precipitation and blunting, followed by a 3-point-ligation. Afterwards the plasmid was transformed into ECC.
Furthermore, our team started to particularly working on the BioBricks. It started with pJET-cloning and -transformation.
Week 9 (05.09 – 09.09)
Restriction & Ligation, pJET & Sequencing of new ccdB
A new transformation of the correct Red_mazF cell line was done to get more and fresh clones. The colour of the newly transformed cells was not as deeply red as expected.
Blue_ccdB of the week before also didn’t show a satisfying colour. ONC was done of the diluting plating from the ligation the week before. The next day the ONC could not be used because of contamination. To be sure, a new LB media was made.
Sequencing of the ccdB-pJET cells showed the correct results for sample 5. Therefore, PCR was made for sample 5 the same way as before. PCR product was cleaned up and restriction digestion of ccdB was performed. Afterwards, the new ccdB fragment was ligated with a blue fragment from the week before and pUC19, of course. The next step was transformation and plating, followed by diluting plating and ONCs of 5 random colonies for miniprep.
Week 10 (12.09 – 16.09)
Miniprep & Protein Expression Control
Minipreps of week 9 were digested with PstI and XbaI but rejected for the following reason: Blue colonies were all of a sudden spotted on the plates of the transformation of week 9 (Fig. 20). For this reason, new diluting plating was done with 8 blue colonies (Fig. 21). ONCs were made by inoculating the same colonies. The next day miniprep was performed. After measuring nanodrop a restriction digestion for controlling the presence of all three inserts was done (Fig. 22). The last three of the 8 bands showed the correct size and were sent to sequencing. Band number 7 was correct (Fig. 23.

Fig 20: Some blue colonies were detected

Fig 21: The correct blue one

Fig 22: E.Coli XL1/pUC19_blue_ccdB

Fig 23: Sequencing results of the correct blue one
In the meanwhile, the same procedure was done in a parallel way for our correct red clone and also sent to sequencing together with the blue ones. Unfortunately, the red clone did all of a sudden not show the correct sequence anymore. Therefore, new ONC, miniprep, gel electrophoresis and diluting plating were performed.
Moreover, protein expression control was started for the correct blue bacteria and the supposedly correct red bacteria. ONCs were made, followed by a main culture, which was growing to an OD600 of approximately 0,4. It was inoculated at OD600 of 0,05 and was altogether growing for 7 hours to reach the right OD600. Afterwards the red and blue probes were each separated into two probes and one of each was induced by IPTG at 15°C for 18 hours. The following day, the cells were centrifuged for 10 min at 5000 rpm and 10 °C, resuspended in 1 ml of Lysis-buffer (Potassiumphosphatebuffer pH 7,5) and sonicated with ultrasound (4x 20 sec, amplitude 5). After that, the probes were centrifuged for 20 min at 16000 g and 4 °C. The supernatant was transferred to a new Eppendorf vessel and the pellet was resuspended in 100 µl of Lysis buffer. Furthermore, the reaction approach for SDS-Page was premixed (for blue-supernatant, blue-pellet, red-supernatant and red pellet) and stored in a fridge over the weekend.
Week 11 (19.09 – 23.09)
Red_mazF & Protein Expression Control
SDS-Gel was run with MOPS at 200 V for 50 min. Afterwards, the gel was colored by coloring solution. After approximately one hour bands could be seen on the gel, but no bands for proteins under 10 kDa. To see also these proteins, we did the SDS-Gel again, shortened the runtime of the SDS and used MES-buffer instead of MOPS-buffer (Fig. 24).

Figure 24: SDS-Gel of proteins that were isolated with sonication followed by centrifugation. Standard: PageRuler Prestained Protein Ladder. Protein size of chromoprotein blue: 24,5 kDa; Chromoprotein red: 25,6 kDa; Toxin ccdB: 11,7 kDa, Antitoxin ccdA: 8,3 kDa; Toxin mazF: 7,7 kDa; Antitoxin mazE: 9,4 kDa; DAM methylase: 32 kDa.
One can see a light band at 10 kDa in the slope Red ind. and Red ind. > 10 kDa, which could be the antitoxin mazE. Slope Blue ind. and Blue >10 kDa also show a light band at 10 kDa, this could be the toxin ccdB. At ~25 kDa there should be chromoprotein red and chromoprotein blue, but there´s not a clearly band to see. This is curious because cells that were used for protein isolation were very red and blue. There´s a dark band at ~30 kDa in the slope Blue ind. and Blue ind. >10 which could be DAM methylase. MazF and ccdA had to be under 10 kDa, but there was no band to see. In slope Red ind. < 10 kDa and Blue ind. < 10 kDa there´s no band to see. Reason for that could be the method we tried to isolate proteins that were smaller than 10 kDa. Therefore we used Sarsted centrifugal concentrators to get proteins smaller than 10 kDa, like ccdA or mazF. Unfortunately, it didn´t work.
Because of the fact, that we got in the tenth week Red_mazF with the right insert in our transformants, we decided to control the transformants of this week again. So we looked up for the right plates, picked eight red colonies, streaked them out, made an ONC and cut it with EcoRI. Then we performed a agrose-gel electrophoresis and surprisingly some of these colonies showed the right band size (Fig. 25).

Figure 25: Agarose Gel of eight different Red_mazF colonies from plate X, cut with EcorI. Standard: GeneRulerTM 1 kb DNA Ladder.
Six out of eight colonies showed the right bands (~4000 bp and ~1000 bp). Clone 6 and clone 7 only show one band at ~4000 bp. Seems like there was no insert in these clones. The correct red one was streaked out again (Fig. 26).

Fig 26: The correct red one
Comparing the results from the gelelectrophoresis with the streaked colonies (fig. 27), one can see that mostly light-red colonies showed the right plasmid-size. Maybe this was the reason why we didn´t find Red_mazF with the proper plasmid in the tenth week anymore, because we always analyzed colonies that grew dark-red.

Fig. 27: Eight re-streaked colonies (LB-amp plates) from a plate with Red_mazF transformants from week 10.
Week 12 (26.09 – 30.09)
Protein expression control in culture media
Because the SDS-Gel of the proteins wasn´t that clear, so we couldn´t say if the toxins were produced or not. We analyzed the protein expression in flasks with LB-media. Therefore we prepared an ONC of Blue_ccdB and Red_mazF and let the ONC's grow to OD600 ~0,1. Four main cultures were made: two with Blue_ccdB and two with Red_mazF. We let them grow to OD600 ~0,5. When the OD600 was reached we induced one main culture from Blue_ccdB and one from Red_mazF with IPTG (1 mM). We took a sample of our main cultures every 30 minutes over several hours and measured the OD600. Additionally we plated 100 µl of each culture on a LB-Agar plate (dilution 1:100; Amp 50µg/ml). The plates were incubated over night at 37°C.
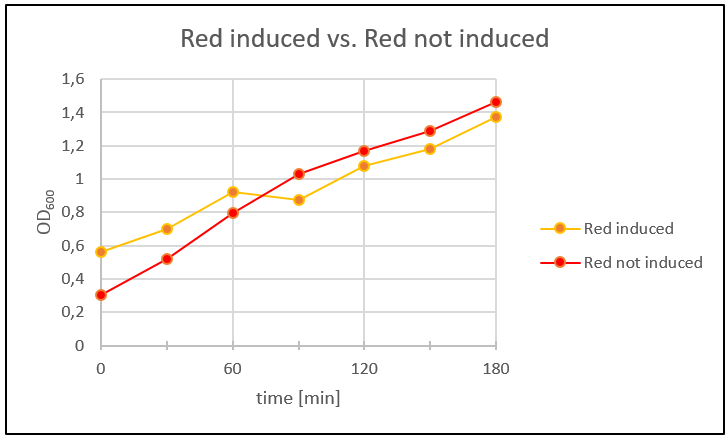
Figure 28: One Red_mazF main culture was induced with IPTG (1 mM).To compaire the results the other main culture wasn’t induced with IPTG. The OD600 was measured every 30 minutes over 3 hours.

Figure 29: One Blue_ccdB main culture was induced with IPTG (1 mM). To compare the results the other main culture wasn’t induced with IPTG. The OD600 was measured every 30 minutes over 2.5 hours.
In figure 4 and figure 5 the time was plotted against the measured OD600 to get a growth curve of the cells. The Blue_ccdb induced curve is lower than the not induced Blue_ccdB curve. Therefore we can say that the toxin in Blue_ccdB induced was produced. Additionally we can see that our cells in the not induced culture grew better than the induced culture. Red_mazF didn´t show the same result. Red_mazF induced was growing better than Red_mazF not induced. After 60 minutes Red_mazF induced grew slower than Red_mazF not induced but figure 4 doesn’t show the expected result. Maybe that’s because our cells didn’t express the toxin. This could be mostly the reason, because we used a red colony for this experiment that came from the plate with re-streaked transformants from week 10. The colonies on this plate only showed the right plasmid-size in the beginning but not later on. Next day we counted the colonies on the LB-amp plates and got following results:
Table 1: Number of colonies. Over 3 hours samples were taken every 30 minutes from our main cultures Blue_ccdB induced, Blue_ccdB not induced, Red_mazF induced and Red_mazF not induced. 100 µl of the cultures were plated on LB-Agar plates (50 µg/ml Amp; 1:100 dilution).
| Time[min] | Blue_ccdB ind. | Blue_ccdB not ind. | Red_mazF ind. | Red_mazF not ind. |
|---|---|---|---|---|
| 30 | 105 | - | 5 | 17 |
| 60 | 120 | - | 23 | 51 |
| 90 | 120 | - | 11 | 43 |
| 120 | 120 | - | 17 | 50 |
| 150 | 90 | - | -6 | 30 |
| 180 | 130 | - | 5 | 42 |
| 210 | - | - | 0 | 41 |
Looking at the numbers from table 1, we can see that Blue_ccdB and Red_mazF not induced got a lot more colonies than Blue_ccdB and Red_mazF induced. Hence the induced cultures were able to produce the protein and were growing slower because of that, while the not induced cultures continued growing. But the results of our red cultures were not comparable with the results we got in figure 4. We decided to repeat the same experiment with our red cultures.
We started a new protein expression experiment in culture media, with Red_mazF (2.4 see figure 2) that showed the right plasmid-size on the gel. We prepared ONC´s and the next day we made two main cultures out of the ONC. In this experiment the main culture was already at the beginning induced with IPTG (1mM). Over several hours the OD600 was measured.

Figure 30: One Red_mazF main culture was induced with IPTG (1mM) the other one not. Over 3.5 hourss the OD600 was measured.
Figure 6 shows that the not induced culture (orange line) grew better than the induced culture (red line). Therefore it's possible to say that the induced culture expressed the toxin and so the cells were inhibited in growth. At the beginning both cultures had nearly the same growth. After 2.5 hours it´s possible to see the difference between the induced and not induced culture. Figure 6 shows that after a while it's clear that the induced culture didn´t grow in the same way like the not induced culture. We can say that was because of the toxin expression in the induced culture. It inhibited the growth of the cells. Hence we have cloned the right gene and also the right protein was expressed compared to our previous results.
Week 13 (03.10 – 07.10)
Red_mazF vs. Blue_ccdB on LB-amp plates
Our last week in the lab we started with our bacteria fight and got some interesting results.

Figure 31: LB-amp plate 1 and 2: Six (1,2,3,4,5 and 8) colonies with proven positiv insert (see fig. 2 and 3). LB-amp plate 3 (plated with 20 µl IPTG (1 M)): 1.1 Red_mazF and 1.1 Blue_ccdB (also with proven positiv insert) were streaked one upon the other. LB-amp plate 4: 1.1 Red_mazF and 1.1 Blue_ccdB. LB-amp plate 5: 2.4 Red_mazF and 1.1 Blue_ccdB. LB-amp plate 6: 1.1 Red_mazF, 2.4 Red_mazF and 1.1 Blue_ccdB.
1.1 Red_mazF was used in plate 3,4 and 6 and watching these plates one can see that 1.1 Blue_ccdB is replaced by 1.1 Red_mazF. 1.1 Red_mazF was definitely growing stronger and eliminated Blue_ccdB. Maybe 1.1 Red_mazF had a leakier promotor than 1.1 Blue_ccdB and because of this more toxin was produced than in 1.1 Blue_ccdB. This was our thought, because 1.1 Red_mazF was also able to kill 1.1 Blue_ccdB even when they were not induced with IPTG. But our thought was disproved, because 1.1 Red_mazF was also able to kill 2.4 Red_mazF (see plate 6), so maybe 1.1 Red_mazF already mutated. 2.4 Red_mazF was even not able to eliminate 1.1 Blue_ccdB (see plate 5). Another reason why 1.1 Red_mazF is stronger than its fellow 2.4 Red_mazF could be the fact, that 1.1 Red_mazF didn´t produce as much chromoprotein red than 2.4 Red_mazF. Because of that 1.1 Red_mazF had less to do and thus more time for other methabolic reactions, what made Red_mazF stronger.
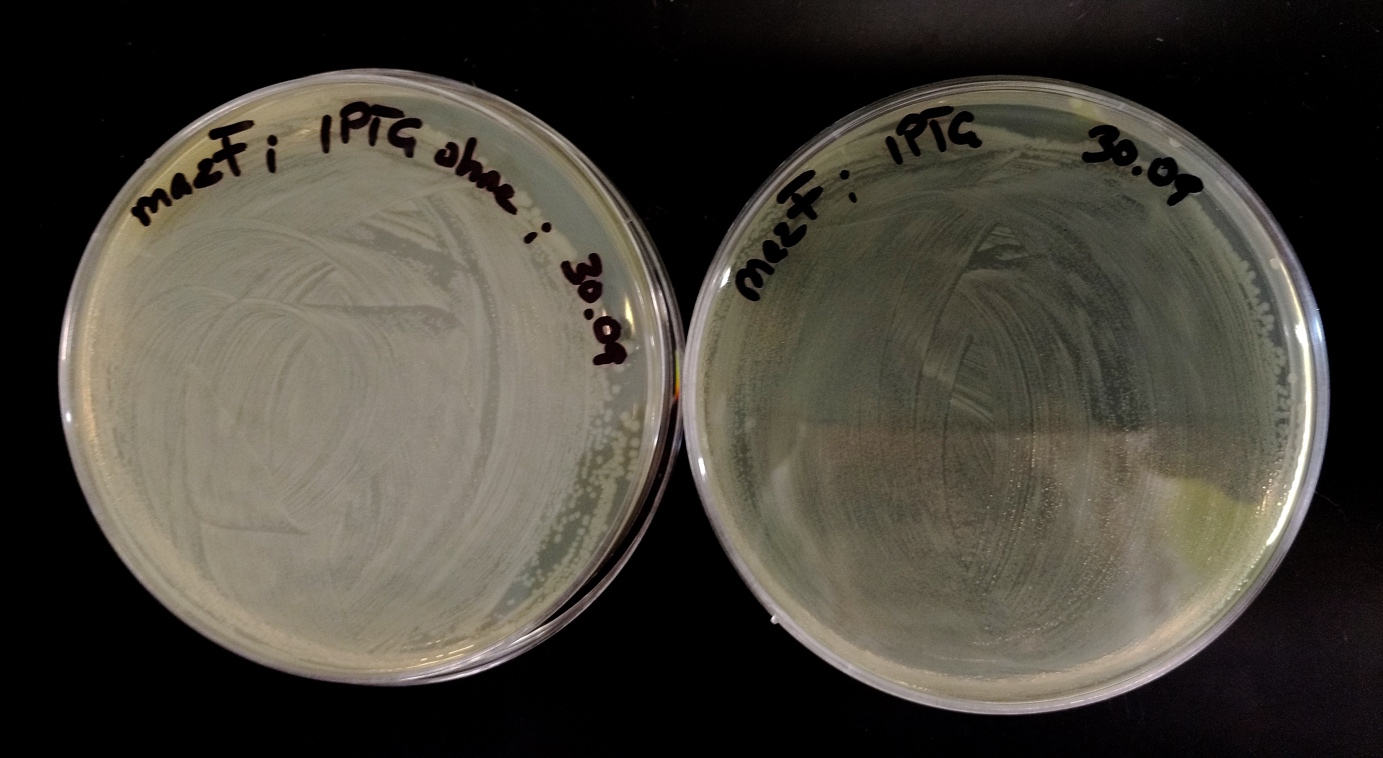
Fig. 32
Sponsoring


