Team:Technion Israel/Model

Model - Introduction
Introduction
The goal of this model is to describe the processes inside the Flash Lab system:
- Change in the concentration of chemo-repellent.
- Change in the concentration of bacteria.
This model is based on the Keller – Segal equation of chemotaxis (1) in a one dimensional problem (Thin channel).
It's importent to notice that this model can show the overall behavior and not exact values. The final system is supposed
to detect a variety of materials in many different unknown solvents, each of which has its own diffusion properties. Also,
some aspects of the working conditions might change in wide range commercial use (if, for example, someone will use this
system in a hot environment) and affect the results. Taking those into account, this model can accurately predict only
controlled and known problems.
Chemo-Repellent Concentration
Model:
The basic assumptions of the model for the chemo-repellent are:
- There are no forces except diffusion:
> Chemo-repellent concentration in the sample is relatively low and does not cause osmotic pressure.
> The changes in pressure due to loading the sample is negligible.
> No other significant external forces (for example, moving the chip while in use).
- The bacteria do not consume the chemo-repellent and its concentration does not change in time. This is not case with chemo-attractants.
- We expect to detect small proteins and molecules (those are the materials bacterial receptors bind to). The diffusion coefficient for such
materials is about 10-9 [m2/s].
- Because of the geometric properties of the channel and the expected diffusion coefficient, this is approximately a half-infinite one dimensional problem.
- The starting conditions: no chemo-repellent in present (a) and in all times, at infinite distance the concentration is also 0 (b).
We modelled the change in concentration of chemo-repellent based on "Top Hat Function" for a diffusion problem:

Equation 1: "Top Hat"" diffusion problem.
v[M] is the chemo-repellent concentration, D[m2/s] is the chemo-repellent diffusion coefficient,
N[mol] is the number of repellent atoms,
A[m2] is the cut section of the channel,
x[m] is the distance on the channel,
t[s] is time.
The solution for this problem is:

Equation 2: General solution for chemo-repellent diffusion problem.

Graph 1: Chemo-repellent concentration: top hat diffusion.
In our problem, we want the diffusion to start from . Also, we take into account only the positive distance:

Equation 3: Chemo-repellent concentration.
Model Predictions:
We ran the chemo-repellent concentration equation in matlab (The code is in ap-pendix). The parameters used:

Table 1: Parameters for diffusion model.
The output for different times:

Graph 2: Model for repellent concentration.
The change in value of the diffusion limit between times 0 to 15 minutes, is relatively big. As the time passes the change lowers.
* This is the diffusion coefficient for potassium permanganate (see "Comparison to Experiment").
** h = (Sample_volume)/(Reservoir_cut_section).
Comparison to Experiment
Most diffusion experiments need a dedicated system that is based on the diffusion of an isotope or a fluorescent
material that can be detected easily and very pre-cisely. In this case, as explained in the opening, our goal is
showing that the overall system behaves as we expect.
The experiment ran as shown in the "Introduction" section where we replaced the bacterial medium with water and
the repellent with potassium permanganate in the following amounts:

Table 2: Substance for diffusion experiment.
Motility buffer is mostly water (98%) and can be modelled by it. Potassium perman-ganate is a salt with a known diffusion
limit and acts as most of the materials we want detect using our system. Also, it has a very distinct pink color in low
concentra-tion, so the diffusion limit can be seen easily.
We ran the experiment 4 times, with a standard roller to measure the distance of the diffusion limit.
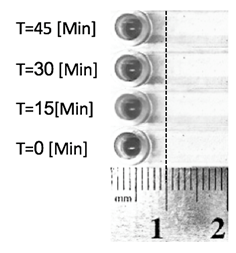
Figure 1: Diffusion of potassium permanganate in water in different times (enhanced picture).
As expected by the mathematical model, the diffusion limit starts moving relatively fast and its speed decreases rapidly.
The difference in distance between the model to the experiment (average of 2.5[mm] fro, T=0) can be explained by:
- The actual diffusion limit is in too low concentration of potassium permanganate to be seen in the naked eye.
If the visible con-centration is about 0.000015 [M] the experiments results lines up with the model (Graph 2.2).
- The roller is a crude measuring tool. Its mistake is +/- 0.5 [mm].
- Difficulties loading the sample in a uniform way, especially in low volumes. Mistakes in loading the sample inside the bacterial fluid and not on, or sticking the
drop of sample to one of the entry slot walls will cause uneven diffusion.

Graph 2.3: Comparison of diffusion model to experiment.
Results
Intein-gBlock was failed to inserted into Tar via Gibson assembly. Only short part of the intein succeeded to be assemble. Since we assumed the intein might be too long (1575 bp) - new intein-gBlocks were generated, by splitting the original-intein-gBlock into two parts. An attempt to insert these two parts into Tar by Gibson assembly has failed as well. In our third and final attempt, different cloning method was used- blunt ligation. In this attempt, the original-intein-gBlock (one part) was used. This method did not work as well.
Outlook
Long fragment cloning is often challenging due to the fact that cloning efficiency is reduced with fragment size.
Using optimized cloning products might be essential.
As cloning methods did not work well, next stage is to assemble the two-parts of intein gBlocks via Gibson assembly,
in order to test whether it can be assembling to form the one intein segment. Following that, cloning intein segment
into Tar using blunt ligation method. Following that, perform estrogen-induction and swarming assay, to indicate
whether the intein indeed spliced out.
We believe this novel approach can be successful to construct new E.coli strains, contain Tar-switch according to various materials.
Except for one material detection - this approach can be used as an AND biological gate -
where we could verify if two specific materials are found in a sample.
1. KELLER, Evelyn F.; SEGEL, Lee A. Model for chemotaxis. Journal of theoretical biology, 1971, 30.2: 225-234.


