Contents
Overview
Our project involves working with Streptococcus thermophilus, a yogurt bacterium commonly used in yogurt manufacturing [1]. One of our overarching aims was to further characterise the strain LMD-9 to benefit future iGEM teams that may want to explore working with yogurt as a vector for nutrition (Chassis). To this end, we decided to look into the reactions of S. thermophilus to milk. We were curious to see which genes were upregulated in milk, and if any of those genes shared a common promoter. If so, we thought this promoter could play the role of a natural switch for our (SIM Device). We contacted Professor Mike Barrett and he generously agreed to fund ten RNA-seq experiments, allowing us to investigate S. thermophilus from a transcriptomics angle. We had the pleasure of working with Glasgow Polyomics, who organised rRNA depletion, RNA-seq, and bioinformatic analysis of our data.
In order to reduce the number of variables in our experiment, we decided to select one component of milk to test against a control. Our chosen molecule was casein – a protein found in abundance in milk [2]. We chose casein over other molecules because S. thermophilus has been shown to begin degrading this protein after lactose digestion has been exhausted [3]. We hypothesised that there must be some genetic regulation preventing constitutive digestion of casein and therefore we would be able to observe differential expression when comparing the S. thermophilus transcriptome in the presence and absence of casein.
Materials and Methods
Condition set up
- Media (control): 20ml M17L + 80µl 50mM PBS
- Media + casein: 20ml M17L + 80µl 50mM PBS + 0.26% casein (final concentration of casein = 0.0026%)
The media M17 is commonly used for growing S. thermophilus, we used a variant with added lactose as indicated by L. The concentration of lactose in this case was 5gL-1. The stock of M17 used was kindly sent from the lab of Pascal Hols and details were provided by Maud Flechard.
Sample preparation
- We prepared a overnight culture of S. thermophilus incubated at 37 degrees Celsius in 20ml of M17L media
- From the overnight culture, 10 aliquots were extracted and pipetted into 1.5ml Eppendorf tubes
- Tubes were centrifugated for 1 minute at 8000rpm at room temperature and supernatant was discarded
- Each pellet was resuspended in 1ml PBS
- Tubes were centrifugated for 1 minute at 8000rpm at room temperature and supernatant was discarded
- Each pellet was resuspended in 1ml PBS again
- Following these steps, the cells were washed and overnight media had been removed
- 1ml of washed cells was added to 19ml of fresh condition media for the expression stage
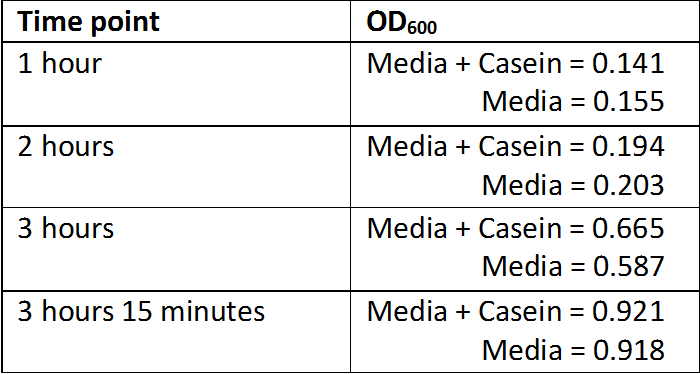
These steps were repeated five times for each media condition, ending up with five 20ml cultures of S. thermophilus growing in M17L/Casein; and five cultures of S. thermophilus growing in M17L. Essentially, five replicates were set up for each condition and the S. thermophilus cultures were exposed to each condition for a duration of 3 hours and 15 minutes, during which time optical density was checked at regular intervals (Table 1). Incubation temperature was kept at 37 degrees Celsius throughout. Upon completion of the incubation, each 1ml of sample was split into two tubes, yielding two replicates for each sample.
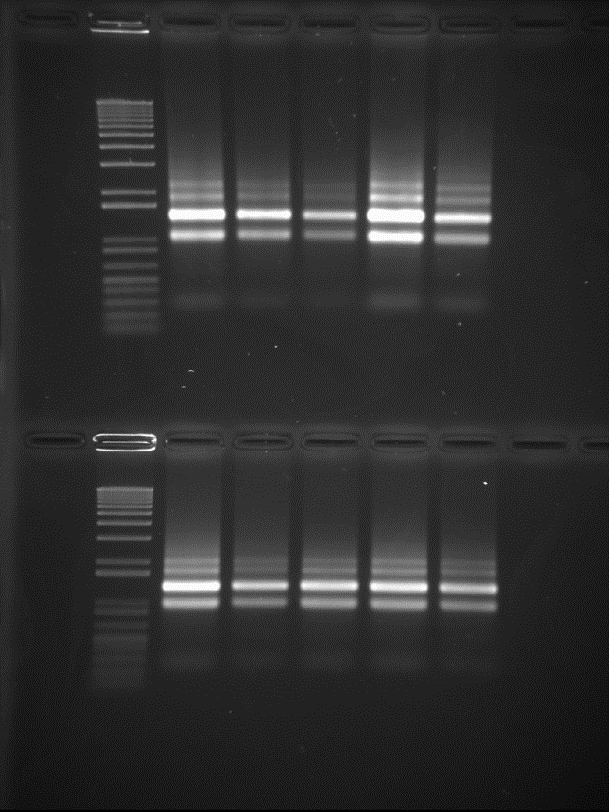
We then followed the Qiagen RNAprotect protocol. This stalls cell growth, and inhibits the action of cellular RNAses to protect against RNA degradation. Consequently, we extracted RNA using the Qiagen RNeasy kit designed for use with bacteria. Specifically, we followed the enzymatic lysis protocol which, for S. thermophilus, involved using 30mg/ml of lysozyme lysis in an Eppendorf ThermoMixer desktop shaker. We shook the samples for 30 minutes at 1000rpm at 37 degrees Celsius. We removed residual genomic DNA by performing the optional stage of on-column DNAse digestion. For the final elution step of the protocol, the RNA was spun twice with 30μl Nuclease-free water to maximise yield. This resulted in 60μl for each of the samples. The two replicates of each sample were then combined into a single tube – so the final samples were 120μl x 10. In order to send adequate samples to Glasgow Polyomics, we assessed our RNA quality. Initially we checked RNA on a “Bleach gel” – an agarose gel that protects against RNA degradation [4]. To make a 70ml 1.2% agarose gel, we added 1.4ml of additive-free 1.5% hypochlorite bleach to the melted agarose. We loaded 2μl of each RNA sample, 3.3μl of NEB 6x purple loading dye and 14.7μl RNAse free water. In total this equated to a 20μl loading solution. An Invitrogen 1kb+ DNA ladder was loaded in the first wells as a reference. Electrophoresis was performed at 70V for 40 minutes. The gel was then post-stained with Ethidium bromide and imaged on a Bio-rad Gel Doc (Figure 1).
The gel picture shows a well-defined RNA profile for all 10 samples (tRNAs at the very bottom, 16s and 23s rRNAs at correct ratios, no genomic DNA stuck at the top of the wells), with no visible degradation.
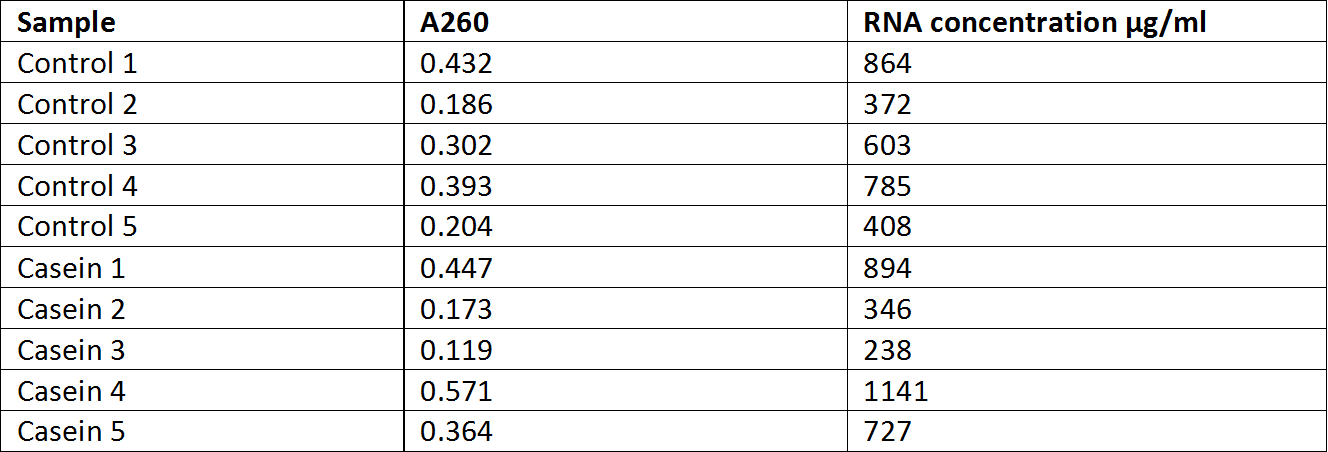
We then quantified each sample to ensure we were sending adequate concentrations of RNA (Table 2). The 10 RNA samples were quantified at A260 in a spectrophotometer. Samples were diluted 1/50 (8μl into 392μl RNase free water, for 400μl quartz cuvette).
Satisfactory replicates were sent to Glasgow Polyomics for processing.
Results and Discussion
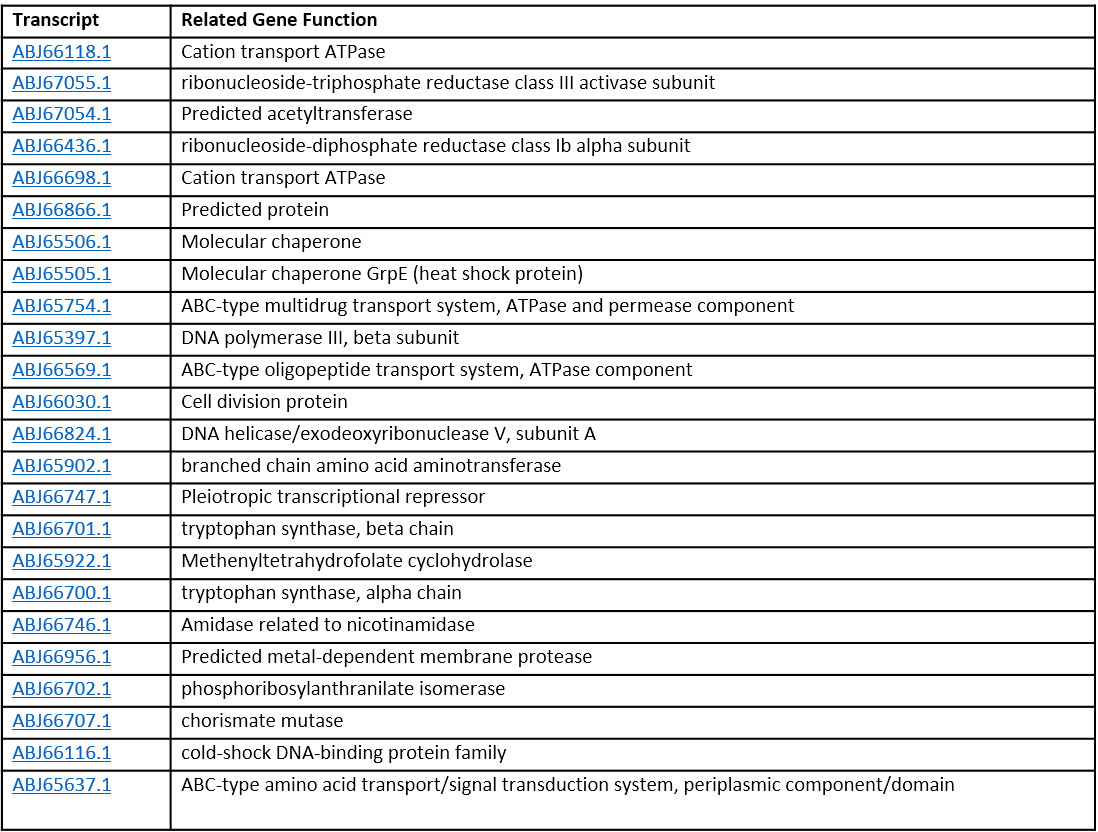
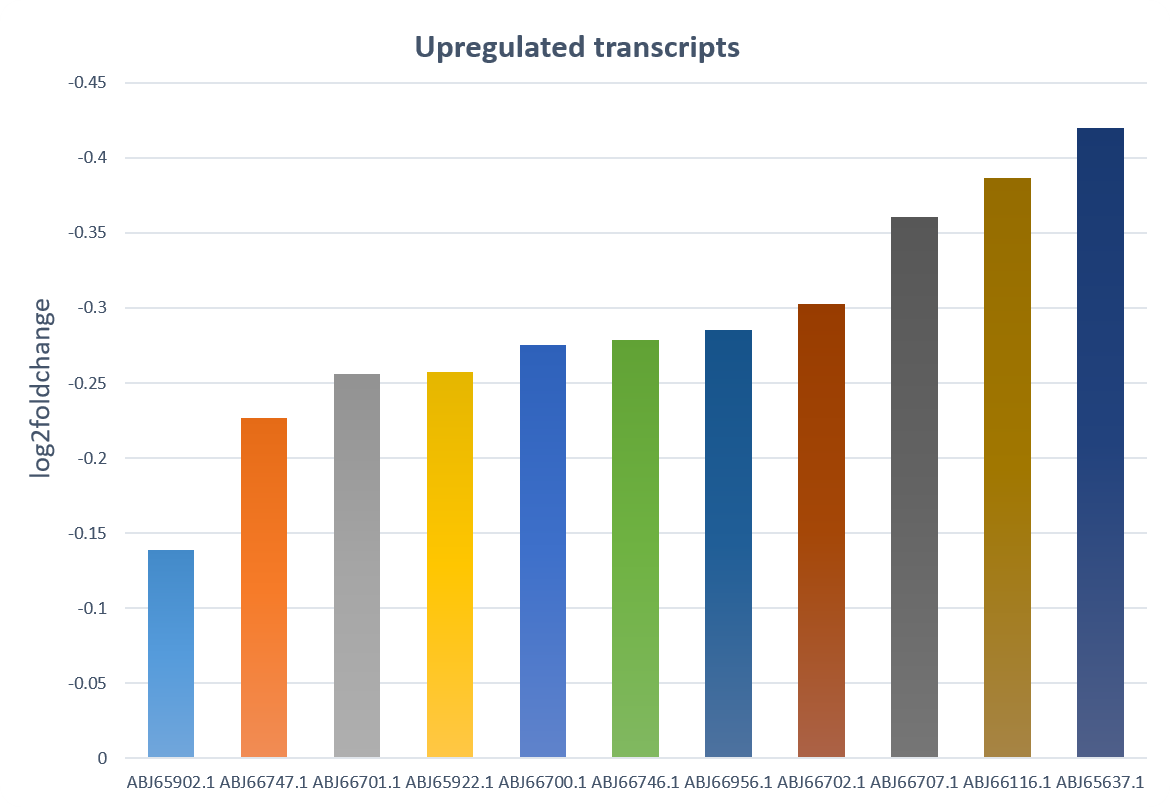
Bioinformatic analysis of our results revealed that we had uncovered 24 differentially expressed genes, 11 of which were upregulated in the presence of casein (Table 3). In terms of gene function, we expected to see links to protein degradation. Based on the upregulated genes observed, we suspect that we may have missed the window for isolating these transcripts, as the upregulation here seems to be related to amino acid transportation rather than the degradation of proteins.
Upon analysis of the differentially expressed transcripts, we observed that the most upregulated variant had a 0.419 log2 fold change i.e. just under 1.5x the expression relative to the control (Figure 2). We concluded that the lack of distinct disparity in expression deems this set of genes unsuitable with regards to our SIM device. To switch the SIM device on, we would need to find a promoter common to genes that are highly expressed in milk. No set of genes in this experiment jumps out and so we would need to investigate expression patterns in milk further.
Outlook
Had we the time and funding, we would have liked to have repeated these experiments in slightly different conditions. We would have decreased the time interval of exposure, changed the media so that there were fewer confounding variables e.g. trying to reduce amino acid presence in the base media as far as possible, and performed more detailed growth curve analyses prior to sending our samples.
References
- ↑ Kiliç, A. O., Pavlova, S. I., Ma, W. G. & Tao, L. 1996. Analysis of Lactobacillus phages and bacteriocins in American dairy products and characterization of a phage isolated from yogurt. Appl Environ Microbiol, 62, 2111-6.
- ↑ Fox, P. F. & Mcsweeney, P. L. H. 1998. Dairy Chemistry and Biochemistry, London, Blackie Academic and Professional
- ↑ Atanasova, J., Moncheva, P. & Ivanova, I. 2014. Proteolytic and antimicrobial activity of lactic acid bacteria grown in goat milk. Biotechnol Biotechnol Equip, 28, 1073-1078
- ↑ Aranda, P. S., Lajoie, D. M. & Jorcyk, C. L. 2012. Bleach gel: a simple agarose gel for analyzing RNA quality. Electrophoresis, 33, 366-9


