Contents
Overview
iGEM Glasgow 2016 is proud to have taken part in this year's iGEM Interlab Study, which aimed to improve the process of measuring and comparing fluorescence, which is used as a proxy for promoter strength, for example here by expressing GFP. Currently, most fluorescence measurements are either relative (i.e. only helpful when compared to other promoters measured in the same study) or in arbitrary units that cannot be applied to measurements made using a different instrument or different cells.
The 2016 Interlab study attempted to widen the usefulness of fluorescence measurements by providing a method for converting all cell fluorescence measurements into an absolute measurement: the number of GFP molecules per cell. Doing this requires 3 measurements: cell fluorescence measurements, a standard curve using known concentrations of FITC and measurements of known concentrations of GFP.
Protocol
FITC Standard Curve
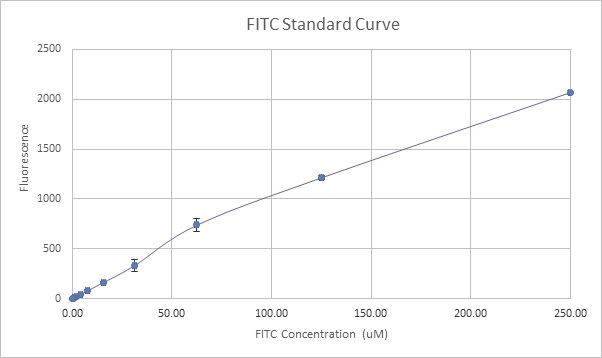
The first step was to obtain a standard curve of fluorescence values specific to our machine using known quantities of FITC, which can then be directly related to measurements made on another machine.
We suspended the provided FITC powder in 1mL PBS and incubated at 42°C for 4 hours as instructed. The solution was then diluted in half and used to prepare serial dilutions across 11 wells on a 96-well plate: 100µl FITC was added to 100µl PBS in the first well, mixed, and then used as a source for the next well, etc.
This serial dilution created a linear decrease in fluorescence values per well which was measured using a Bio-Tek Synergy HTX plate reader and used to plot out the following standard curve (Figure 1).
OD600 Calibration using LUDOX
In order to account for slight variations in OD600 measurements between different instruments, iGEM recommended the use of a calibration protocol involving LUDOX beads. By comparing LUDOX OD600 measurements made by our machine to those made by a reference spectrophotometer, a ratiometric conversion factor can be obtained to ensure that all OD600 measurements are representative of roughly the same bacterial population.
We applied 400µl of the provided LUDOX solution to 4 wells on a 96-well plate alongside distilled water and measured OD600 using a Bio-Tek Synergy HTX plate reader. Subtracting the H2O OD600 measurement from the LUDOX OD600 yielded a corrected measurement which could be compared to reference LUDOX OD600 to obtain a conversion factor (1.5128).
Cell Fluorescence Measurement
Finally, we transformed and measured the five devices provided in the iGEM Interlab measurement kit:
- Test Device 1: [http://parts.igem.org/Part:BBa_J23101 J23101].B0034.E0040.B0015 in pSB1C3 (Strong promoter)
- Test Device 2: [http://parts.igem.org/Part:BBa_J23106 J23106].B0034.E0040.B0015 in pSB1C3 (Medium promoter)
- Test Device 3: [http://parts.igem.org/Part:BBa_J231117 J23117].B0034.E0040.B0015 in pSB1C3 (Weak promoter)
- Positive Control Device: [http://parts.igem.org/Part:BBa_I20270 I20270] in pSB1C3
- Negative Control Device: [http://parts.igem.org/Part:BBa_R0040 R0040] in pSB1C3
The 5 DNA constructs were resuspended in 100µl of double distilled water as the original buffer had evaporated during shipping. 10µl of each construct was used to transform E. coli TOP10 cells which were subsequently plated out on L-agar containing chloramphenicol. The transformants were grown overnight and subsequently restreaked on chloramphenicol agar to rule out false positives and set up a ready source of colonies.
Two colonies from each plate were picked and cultured overnight in 12cm x 2.5cm tubes containing L broth+chloramphenicol at 37°C and 220rpm. The next day, overnight cultures were diluted to an OD600 of 0.02 at a volume of 10mL and then returned to the shaking rack. 100µl samples were taken hourly from each culture and stored on ice to slow growth. At the end of the 6 hour sampling period, the samples were applied to a 96-well plate and fluorescence and OD600 were measured using a Bio-Tek Synergy HTX plate reader. L-broth with chloramphenicol was used as a blank fluorescence measurement.
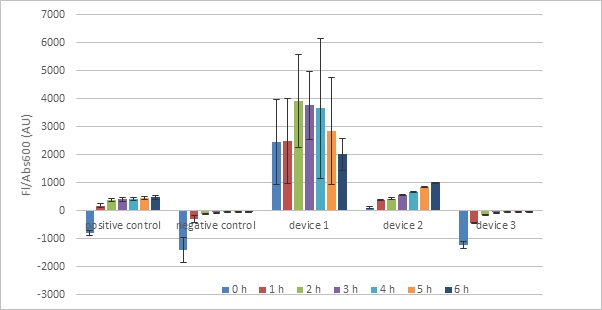
Blank fluorescence was subtracted from cell measurements which were then divided by OD600 to give standardized data.
Results
Both controls gave expected fluorescence values. However, the test devices gave more variable measurements. While cells transformed with test device 2 gave expected fluorescence values that clearly rose over time, test device 1 cells exhibited fluorescence seemingly unrelated to the sampling time: there is no clear relationship between growth time and fluorescence. In addition, test device 1 samples featured very large standard deviations, indicating pronounced differences in the biological replicates used. This could possibly be explained by DNA damage incurred when the original buffer evaporated. Another possible explanation is that the promoter used in TD1 (J23101) was too strong and killed the cells. However, our own experiments using an even stronger promoter ([http://parts.igem.org/Part:BBa_J23100 J23100]) revealed stable growth and fluorescence (see Measurement).
In contrast, test device 3 showed fluorescence values similar to that of the negative control (negative after subtracting blank fluorescence), indicating that the construct created little to no GFP.
Possible Improvements to the Protocol
As with any protocol, there is room for improvement. We identified two possible points on which the current protocol could be improved to ensure more accurate and comparable results:
Halting growth using Kanamycin
In order to track GFP production over time, the protocol we followed called for putting 100µl samples of E. coli on ice at 0, 1 , 2, 3, 4, 5 and 6 hours after inoculation to stop growth. While low temperatures will slow down E. coli growth, they will not halt it completely. As such, samples will not be entirely indicative of GFP concentrations at the time point they represent. We suggest that kanamycin or another bacteriostatic antibiotic be added to the samples as they are removed from incubation and put on ice. This would halt protein production in the bacteria and ensure that any fluorescence the samples exhibit is accurate with respect to the time point they represent.
Washing cells with phosphate buffered saline (PBS)
The given protocol measures the fluorescence of cells while they are still suspended in chloramphenicol-containing broth. While this ensures a simple procedure as there is no need to manipulate samples further after putting them on ice, the broth and chloramphenicol are themselves fluorescent and can interfere with fluorescence measurements of cells, particularly those containing a weak Anderson promoter which leads to minimal GFP synthesis (e.g. Test Device 3). For example, when our measurements were adjusted using the broth+chloramphenicol blanks, Test Device 3 was shown to have negative (but increasing) fluorescence values.
Furthermore, the FITC used to create a standard curve was not suspended in broth but in PBS, creating a possible disparity in the different measurements. We suggest an additional step between obtaining bacterial samples and measuring fluorescence: The removal of broth+chloramphenicol from samples by spinning down the eppendorf and discarding supernatant, followed by resuspending/washing the pellet in PBS. In order to make this feasible, more than 100µl of sample (e.g. 500µl) may have to be removed from the culture for each time-point.


