Team:SYSU-Software/Model


OVERVIEW
The whole model is comprised of 4 parts.
PATH SEARCHER: a large-scale chemicals network and a tool to find the path to generate the target product.
COMMUNITY SIMULATOR: a comprehensive static and dynamic mathematical model for analyzing microbial communities.
RBS DESIGNER: a predictive model for designing a ribosome binding site sequence according to a specific translation initiation rate.
PROMOTER PREDICTOR: a model to predict the strength of a full-length bacterial promoter.

Data sources
The raw data used in this model come from MetaCyc, Rhea, and iGEM Registry. We eliminate the microorganisms that
belong to risk group 3 or a higher one and chemicals that are controlled for security. After preprocessing, the data
cover more than 7,000 species, nearly 10,000 kinds of chemicals, more than 3,660,000 biochemical reactions and more
than 10 GB of protein coding sequence.

PATH SEARCHER
Find appropriate reaction paths based on graph theory.
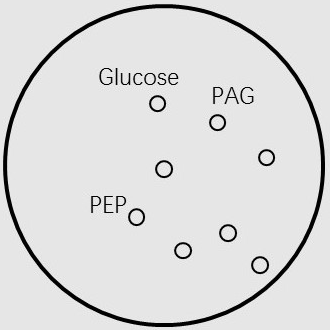
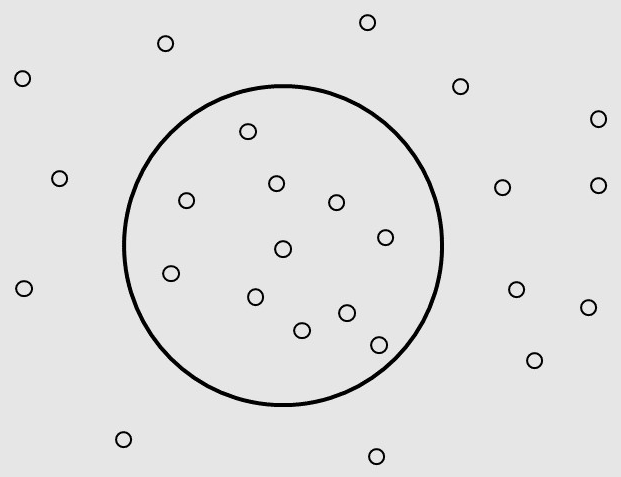
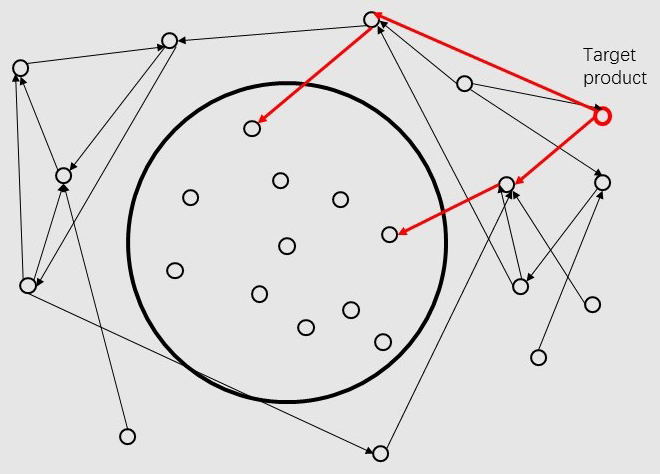
To find appropriate pathways to generate the target products, we develop a model based on the graph theory.We
considered metabolites as vertexes on a 2-dimensions plane. We firstly built a circle, which contains the conserved
compounds in most of microorganisms and the basic compounds that lives need (such as Glucose,PEP,PAG,etc.).
We then add other chemicals outside the circle to the graph.
Example:
Given the vertices of the graph, we should define the edges of the graph as reactions. To find the resultant
corresponding to a specific reactant in a reaction, we developed a creative model based on an existing concept
“reaction pair” to distinguish which product is corresponding to which reactant in the sake of carbon skeleton changing.

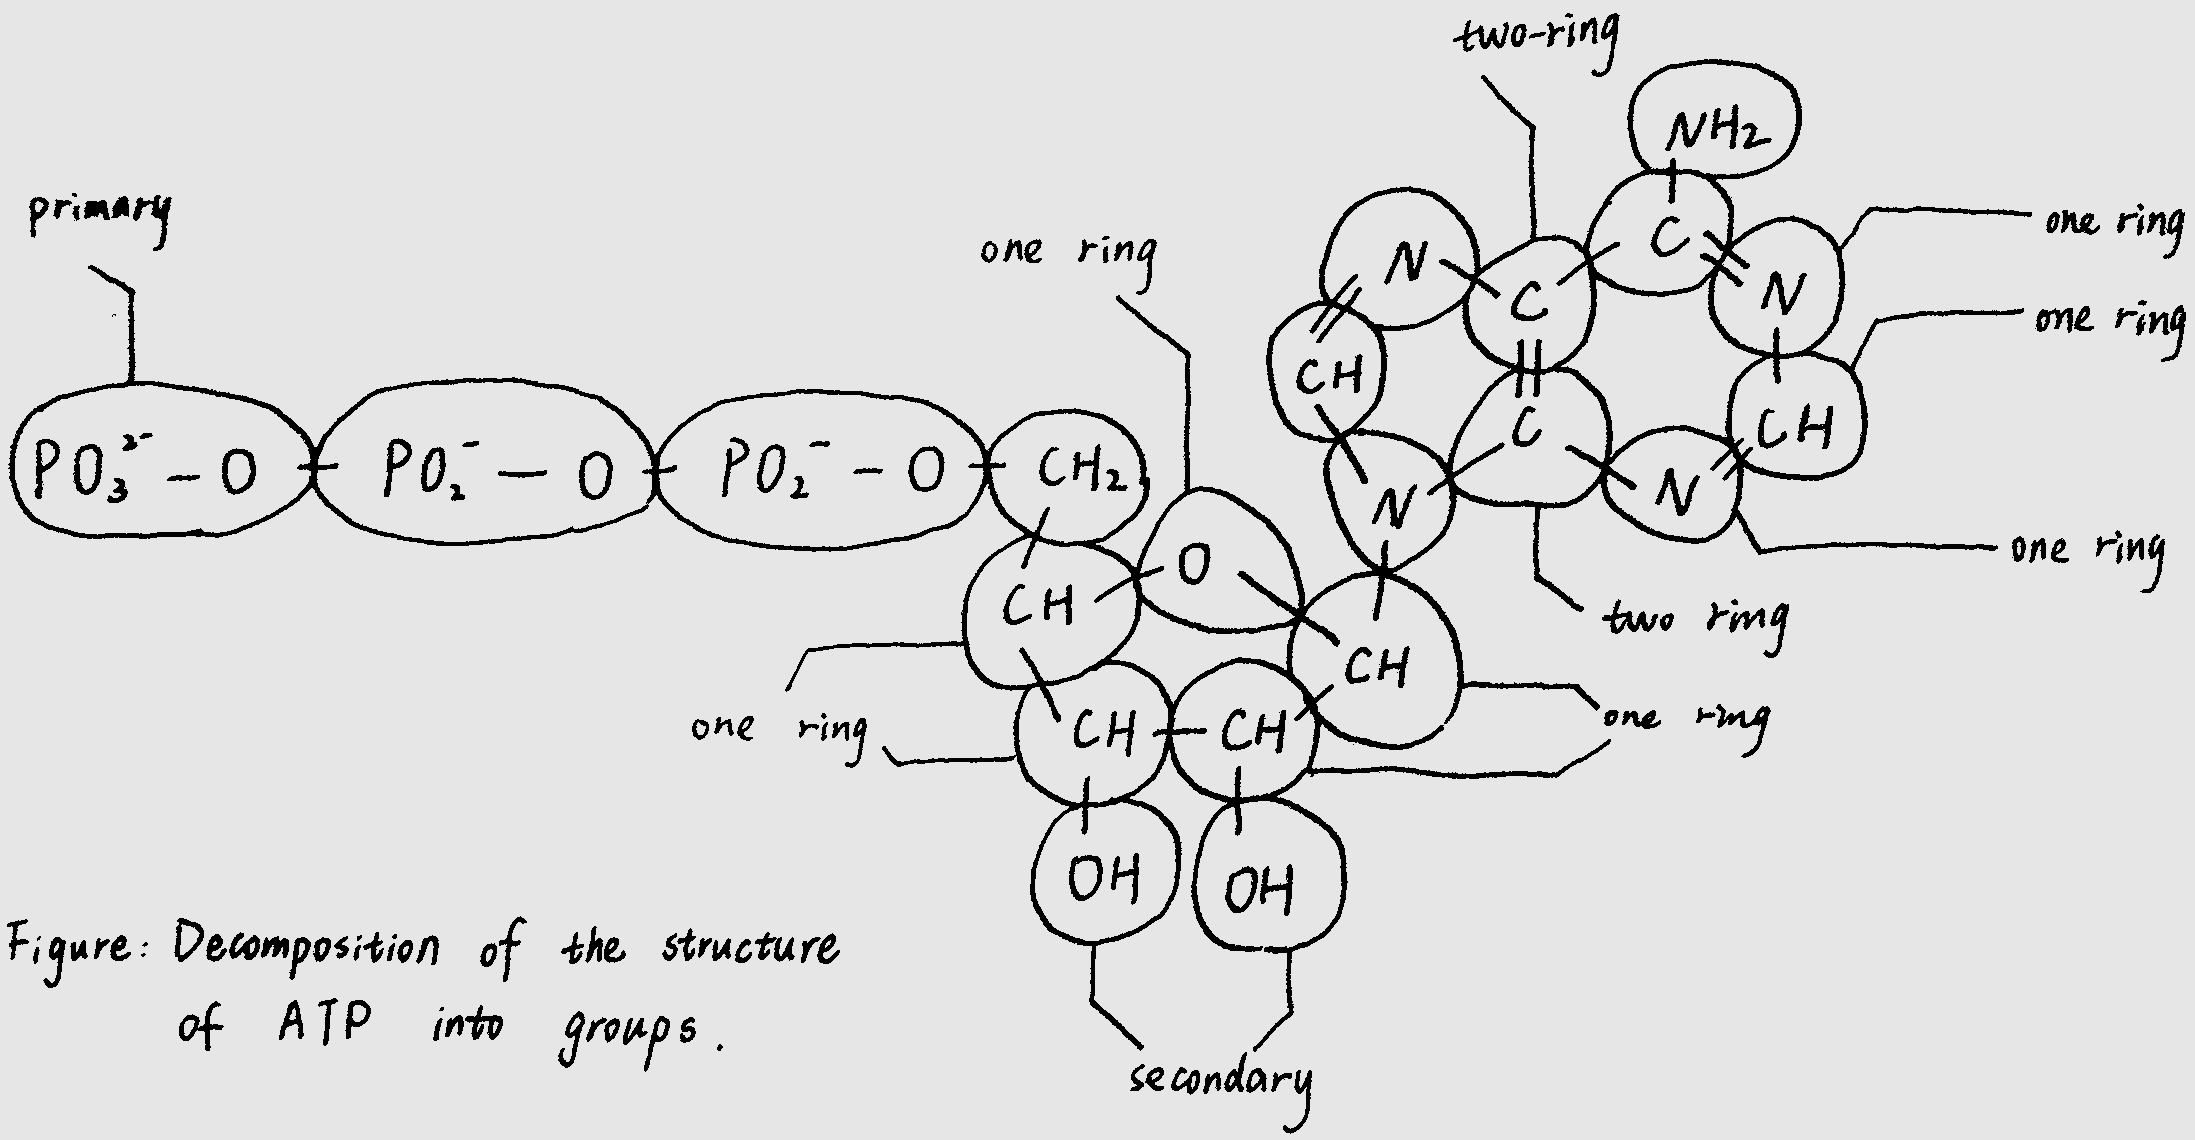
Group contribution model
We introduce a method to estimate the standard Gibbs energies of biochemical compounds and of biochemical reactions
by adding up the energy contributions of groups.
For most biochemical reactions, experimental data on equilibrium constants or Gibbs energies are not available.
However, the standard Gibbs energy of reaction is related to the standard Gibbs energies of formation of its reactants
and products. And the difference of the standard Gibbs energies between the reactants and products represent the
total energy absorb(or release)while the reaction occurs.

STEPS
The thermodynamic analysis can be carried out using the standard Gibbs energy of reaction, -ΔG0. which is closely
related to the equilibrium constant, K :

where R is the ideal-gas constant and T is the temperature. The standard state for -ΔG0 is a dilute aqueous solution
at T = 25°C, pH 7, and concentrations of compounds (other than H+, OH-, and H20) equal 1M.
Letting Vi be the stoichiometric coefficient of compound Si, we can write a reaction (or any transformation with
known stoichiometry) as:

Where Vi> 0 for products and Vi< 0 for reactants. Let -ΔG0 be the Gibbs energy of formation of Si.
The Gibbs energy of reaction, -ΔG0, is then given by the equation mentioned above.
The contribution of each group to the thermodynamic must also be provided, along with the origin, a
starting value that is used in the estimation (and is constant for all compounds).
Let C0 be the origin for the property C, and let Ci be the contribution of group gi,which is used Ni times in the
compound. The property C for the whole compound is calculated as:

Within this method, we view the compound as composed of functional groups and sums amounts contributed by
each group to the overall value of the property, or a suitable mathematical function of the property.
Each group corresponding to a standard initial Gibbs energy. By adding the group contributions of a set of
compounds, one can calculate the standard Gibbs energies for any chemical or biochemical transformation in aqueous
solution.
The contributions were estimated via multiple linear regression, using screened and weighted literature data. For
most of the data employed, the error is less than 2 kcal/mol.
According to the standard data, the error is less than 5 kcal/mol. Thus, the method provides an acceptable first
approximation to Gibbs energies and equilibrium constants in biochemical systems.
Reaction Pair
As we have processes of filtering the candidate pathways, which require evaluating the Gibbs Energies of the
chemical reaction. Yet, the change of Gibbs energy within a certain reaction (ΔG) is nearly impossible to be estimated
directly. In this part, we introduce a new concept “reaction pair” to distinguish which product is corresponding to which
reactant in the sake of carbon skeleton.
In this way, we make it clear to identify the corresponding reaction pair in a certain chemical reaction equation, while
adding the group contributions for standard Gibbs Energies of biochemical compounds in aqueous solution, we are able
to get the standard Gibbs Energy of the whole reaction.
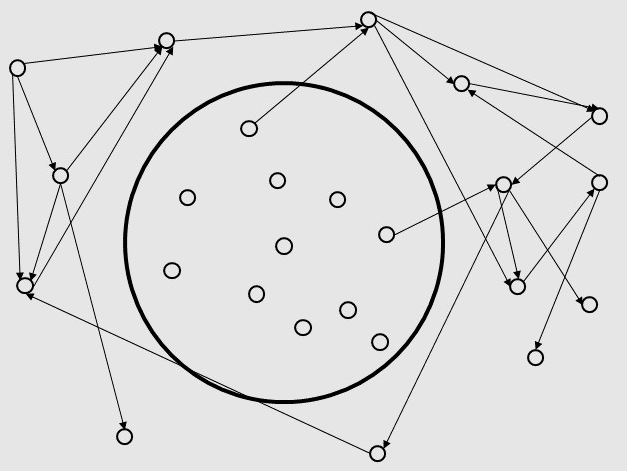
When given the name of the target product, we construct a converse graph of our directed graph and find paths
from the target product to the circle. If more than one paths are found, the software will choose an appropriate path
for the user.

COMMUNITY SIMULATOR
Metabolic Modeling and Analysis of Microbial Communities based on linear bi-level programming.
The original FBA model (Flux Balance Analysis) simulates the reactions in an individual microorganism. The flux of re-
actions is used as variables,and the steady-state mass balance and a lower and upper bound for each flux are used as
constraint condition. The model is built based on linear programming.


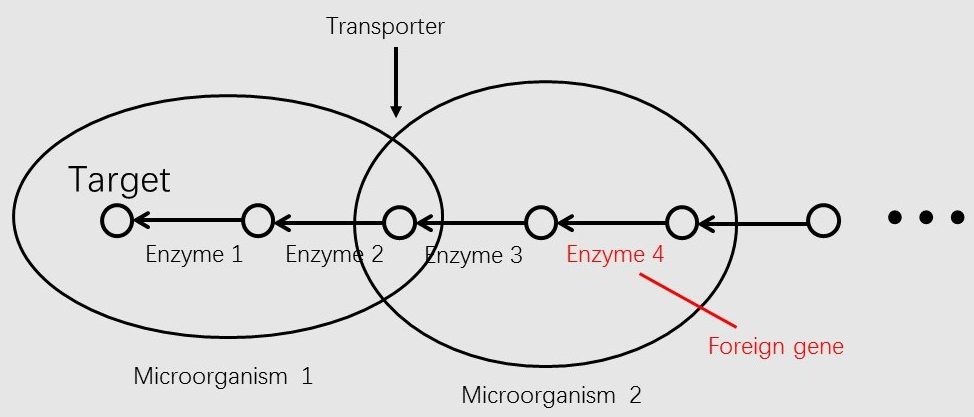
To simulate the flux balance of a community, we improved the original FBA model. Based on linear bi-level
programming, we developed a new model for the metabolic modeling and analysis of microbial communities[6]. In the
new model, we consider the transport process of a metabolite as a reaction.

Where ui is the uptake or export flux of the metabolite in the microorganism,trani is the uptake or export flux
of the metabolite outside the microorganism.


According to the dual theory of linear programming, the dual gaps of the inner problems are added to the outer
objective function. The model is then transformed into a nonlinear programming. We use OpenBLAS, an open
source implementation of the BLAS (Basic Linear Algebra Subprograms) API, and IPOPT, a software library for large
scale nonlinear optimization of continuous systems, to solved the non-linear programming.

The dual gap:

The non-linear programming:

d-COMMUNITY SIMULATOR: A dynamic multi-level and multi-objective metabolic modeling of microbial
communities based on COMMUNITY SIMULATOR.
d-COMMUNITY SIMULATOR is a dynamic multi-level and multi-objective metabolic modeling of microbial
communities. Based on COMMUNITY SIMULATOR, d-COMMUNITY SIMULATOR formulation has its unique features,
which enables not only capturing the dynamic behavior of microbial communities, but also taking both biomass and
shared metabolite into account.
Symbol:

Unique features and accompanying shortcomings
To improve COMMUNITY SIMULATOR, d-COMMUNITY SIMULATOR uses two ordinary differential equations to
precisely calculate varieties of concentrations, so we can capture the dynamic behavior of microbial communities.
Thanks to this, our software can display concentration-time graph to help users catch information in a second and
hence, be more user-friendly. Unavoidably, the ODEs have its side effect. That is, this advanced model is difficult to
solve due to the presence of ODEs. Luckily, by applying Backward Euler method, it is converted to a linear bi-level opti-
mization problem.
RBS DESIGNER
Automatic design of synthetic ribosome binding sites based on dynamic programming.
The equilibrium statistical thermodynamic model quantifies the strengths of the molecular interactions between an
mRNA transcript and the 30S ribosome complex—which includes the 16S rRNA and the tRNA—to predict the result-
ing translation initiation rate:

where is Boltzmann constant, is the difference in Gibbs free energy between the initial state, the folded mRNA
transcript and the free 30S complex, and the final state, the assembled 30S pre-initiation complex bound on an mRNA
transcript.

Symbol
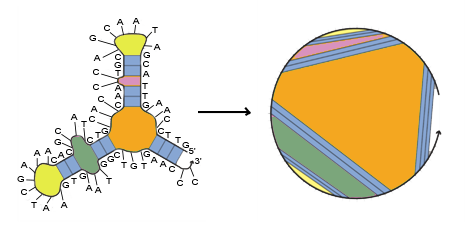
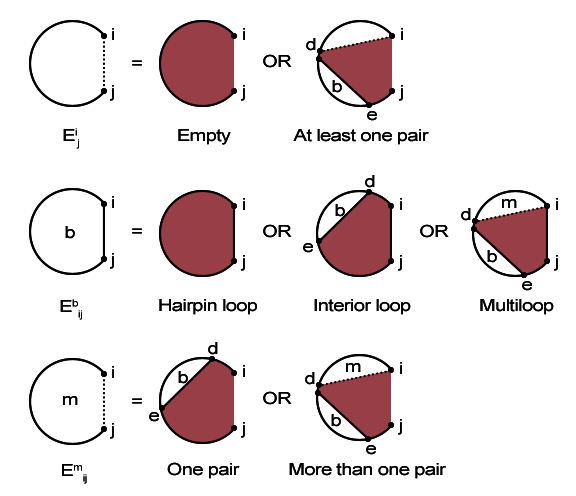
Starting from 3’ and 5’ of a mRNA strand, and is calculated by using dynamic
programming recursions to evaluate the most stable secondary structure (minimum free energy structure) of the
mRNA sub-sequence as shown in the following figures. [9]

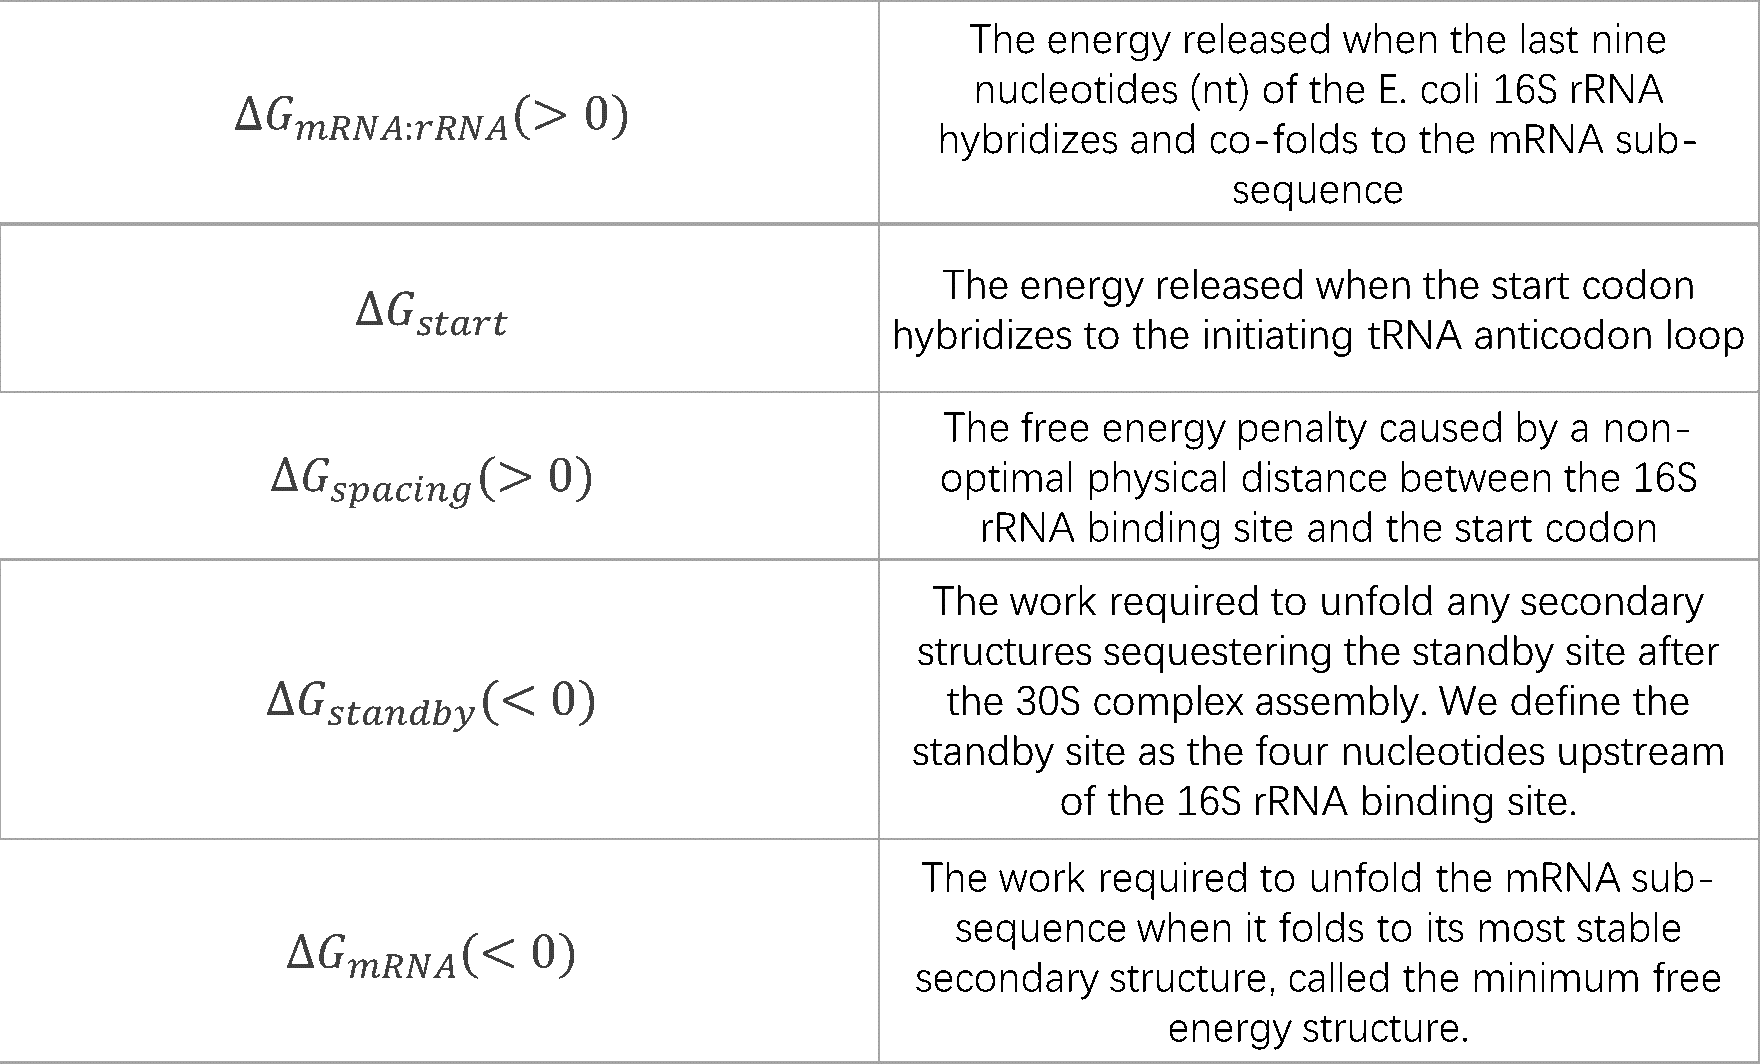
Other parts of are shown in the form below: [8,10,11]

According to the formulations and model mentioned above, we can design a target sequence by traversal algorithm when
given a target translation initiation rate, selecting the optimal solution according to some biological standard and the deviation
between the target rate and the real one. [8]
PROMOTER PREDICTOR
Predicting promoters strength based on regression analysis
To evaluate the contribution of sequence to promoter strength and function, we used modular position weight
matrix models comprised of each promoter motif and a penalty score for suboptimal motif location. The scores of the
promoter sequences are used to predict the promoter strength. We choose a set of promoters of which the
promoter strength is known to fit a promoter strength predicting model. [1,2]
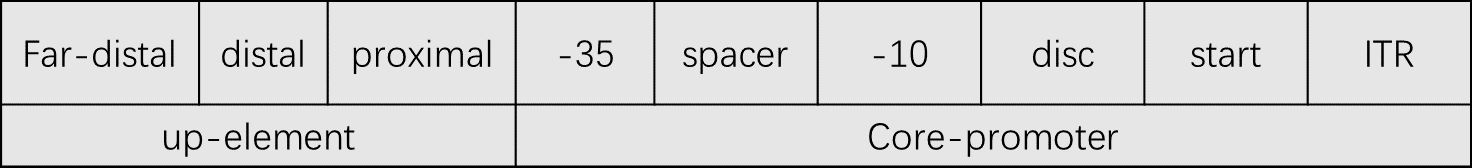
PROMOTER PREDICTOR were constructed for each core-promoter motif with a penalty term applied for non-op-
timal spacer and discriminator lengths. The up-element is also scored.
For the core promoter [1]

where


The spacer and discriminator length penalty scores (S + D) were applied to promoters with suboptimal spacing be-
tween the +1, −10, and −35 motifs based on the observed spacing frequency for promoters.


For the up-element [2]

For the accuracy of the prediction, a total score was calculated for each promoter based on six modules by sum-
ming the scores that have a positive correlation with the logarithm of promoter strength: [1,2]

For the score of the promoter , we have known that: [1,2]

Thus, the function between PWM score and log2(promoter strength) was then fitted by using least square regression.
Problem rises concerning the prediction of the strength of the promoter, that is, promoters contenting in registry of
iGEM have no annotations, yet we need to distinguish -35box、spacer、-10box、disc、and up-element intervals for the
calculation of the strength prediction. Therefore, we built a tool to identify the specific intervals in unaligned sequences
by identifying the consensus pattern based on weight matrix too. [4,12]

Given a set of sequences that have annotations of the specific intervals (-35, -10, discriminator, up-element,spacer), we
constructed weight matrices of every intervals.
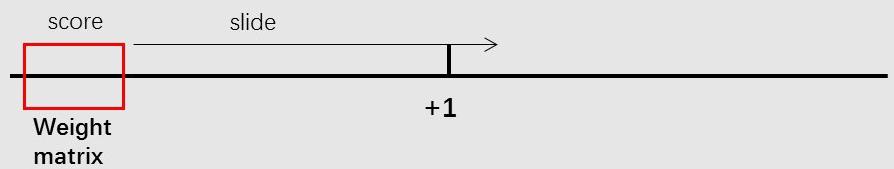
Example weight matrix: [13]

The score of a new sequence is given by the weight matrices by summing the number of every positions of the sequence.

The positions of the intervals are determined by finding the highest score when the weight matrices are sliding on the
sequences and the order of determining the intervals is “-10”, “-35”, “far-proximal”, “proximal”, “distal”. “spacer” is between “-10” and “-35”. “disc” is between
“-10” and “-1”. “-1” and “+1” is “start”
REFERENCE
1. Rhodius VA, Mutalik VK. Predicting strength and function for promoters of the Escherichia coli alternative sigma factor,
sigmaE. Proc Natl Acad Sci U S A. 2010;107(7):2854-2859. doi:10.1073/pnas.0915066107.
2. Rhodius VA, Mutalik VK, Gross CA. Predicting the strength of UP-elements and full-length E. coli sigmaE promoters.
Nucleic Acids Res. 2012;40(7):2907-2924. doi:10.1093/nar/gkr1190.
3. Berg OG, von Hippel PH. Selection of DNA binding sites by regulatory proteins. Trends Biochem Sci.
1988;13(6):207-211. doi:10.1016/0968-0004(88)90085-0.
4. Hertz GZ, Stormo GD. Identifying DNA and protein patterns with statistically significant alignments of multiple
sequences. Bioinformatics. 1999;15(7-8):563-577. doi:10.1093/bioinformatics/15.7.563.
5. Estrem ST, Gaal T, Ross W, Gourse RL. Identification of an UP element consensus sequence for bacterial promoters.
Proc Natl Acad Sci. 1998;95(17):9761-9766. doi:10.1073/pnas.95.17.9761.
6. Zomorrodi AR, Maranas CD. OptCom: A multi-level optimization framework for the metabolic modeling and analysis of
microbial communities. PLoS Comput Biol. 2012;8(2). doi:10.1371/journal.pcbi.1002363.
7. Zomorrodi AR, Islam MM, Maranas CD. D-OptCom: Dynamic Multi-level and Multi-objective Metabolic Modeling of
Microbial Communities. ACS Synth Biol. 2014;3(4):247-257. doi:10.1021/sb4001307.
8. Salis HM, Mirsky EA, Voigt CA. Automated design of synthetic ribosome binding sites to control protein expression. Nat
Biotechnol. 2009;27(10):946-950. doi:10.1038/nbt.1568.
9. Dirks RM, Bois JS, Schaeffer JM, Winfree E, Pierce NA. Thermodynamic Analysis of Interacting Nucleic Acid Strands. SIAM
Rev. 2007;49(1):65-88. doi:10.1137/060651100.
10. Znosko BM, Silvestri SB, Volkman H, Boswell B, Serra MJ. Thermodynamic parameters for an expanded nearest-neighbor
model for the formation of RNA duplexes with single nucleotide bulges. Biochemistry. 2002;41(33):10406-10417.
doi:10.1021/bi025781q.
11. Mathews DH, Sabina J, Zuker M, Turner DH. Expanded sequence dependence of thermodynamic parameters improves
prediction of RNA secondary structure. J Mol Biol. 1999;288(5):911-940. doi:10.1006/jmbi.1999.2700.
12. Huerta AM, Collado-Vides J. Sigma70 promoters in Escherichia coli: Specific transcription in dense regions of overlapping
promoter-like signals. J Mol Biol. 2003;333(2):261-278. doi:10.1016/j.jmb.2003.07.017.
13. Huerta AM, Francino MP, Morett E, Collado-Vides J. Selection for unequal densities of sigma70 promoter-like signals in
different regions of large bacterial genomes. PLoS Genet. 2006;2(11):1740-1750. doi:10.1371/journal.pgen.0020185.
14. Mavrovouniotis ML. Group contributions for estimating standard Gibbs energies of formation of biochemical compounds
in aqueous solution. Biotechnol Bioeng. 1990;36(10):1070-1082. doi:10.1002/bit.260361013.
15. Henry CS, Broadbelt LJ, Hatzimanikatis V. Thermodynamics-Based Metabolic Flux Analysis. Biophys J.
2007;92(5):1792-1805. doi:10.1529/biophysj.106.093138.