Principle and protocol
Fluorescence assays have grown to be some of the most popular readouts in biological experiments. However, representation of optical readouts in fluorescence assays that typically measure OD and fluorescence is non-trivial due to the variations in different instruments used to measure them. The instruments differ in their optical paths, their beam intensities, gains, etc. Hence, data is most research articles are represented in arbitrary units (au), making it very difficult to compare a range of samples, which is what is required out of a measurement system. The idea of the interlab study is to enable a common measurement platform in terms of samples and protocols so as to allow interconversion of data between different devices in the following methods.
- OD: A standard colloidal solution, LUDOX S30 (30% silica colloid in water) was included in the InterLab 2016 kit. i. Assumption: The ratio of OD from two different OD measurement devices for the same sample will be a constant ratio independent of the sample.
- Fluorescence: Dry FITC, 194.7 ug(0.5 umol) was provided in the InterLab kit. A 10x 0.5mM FITC solution was made in PBS and ten-step 2x serial dilutions were set up in quadruplicates. Fluorescence of the same of measured under standard FITC conditions(Ex: 488 nm, Em: 507 nm). i. Assumption: Absolute fluorescence due to given FITC solutions is independent of device parameters.
ii. Implications: If one knows the ratio of OD from two OD measurement devices due to LUDOX and the OD of a different sample is known from the first OD measurement device, the OD from the second OD measurement device can be calculated.
ii. Experimental observations: Under given dilutions, FITC fluorescence is directly proportional to FITC concentration.
iii. Implications: All green fluorescence can be reported in terms of equivalent FITC concentration.
Example of use of standardized measurements:
A growth curve for E coli DH5"/alpha" transformed with the following plasmids was performed
- Negative control - BBa_R0040 (pTetR promoter) pSB1C3
- Positive control - BBa_I20270 (Constitutive GFP generator) pSB1C3
- Test device 1 – BBa_J23101.B0034.E0040.B0015 pSB1C3
- Test device 2 – BBa_J23106.B0034.E0040.B0015 pSB1C3
- Test device 3 – BBa_J23117.B0034.E0040.B0015 pSB1C3
All the growth curves were performed with initial uncorrected OD of 0.02.
Errors
1. The initial plate reader interlab study protocol stated that the FITC tube in the kit had 187 ug of FITC, while the label on the FITC tube stated 197.4 ug of FITC to be present.
2. The plate reader protocol claims the concentration of FITC in the 10x solution to 5 uM. However, that would imply an initial mass of 1.974 ug of FITC in the kit, which is 100 fold lesser than what updated plate reader protocol states (as of 17th October, 2016 IST).
Suggestions
Our suggestion with regard to the OD standard is to use McFarland standards instead of LUDOX solution. This is because McFarland standards can be made by respective teams, and replacing LUDOX with it decrease the InterLab kit expenses.
Results
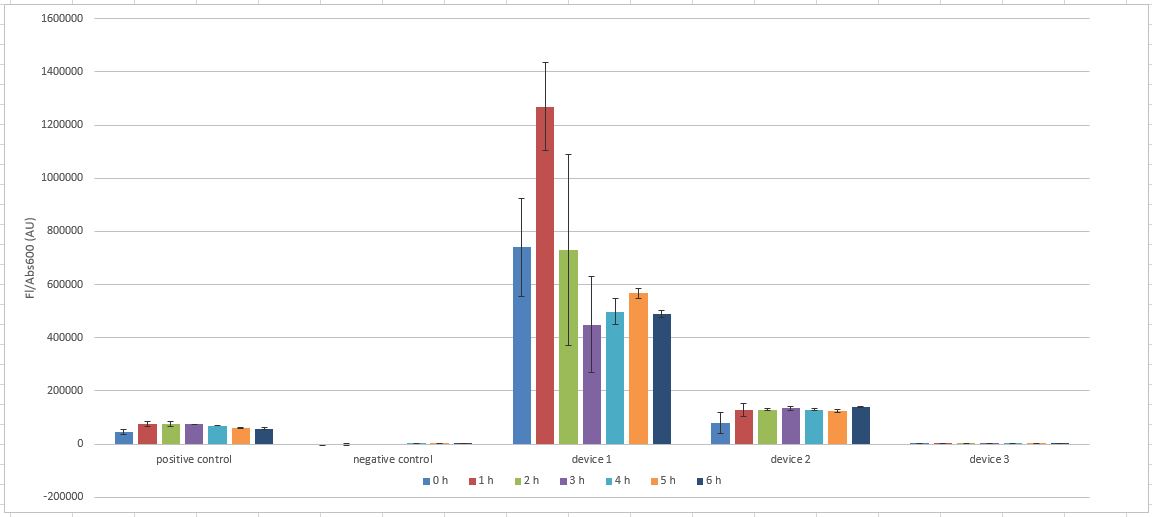
The results from our InterLab experiment are in the following spreadsheet. The Flu/OD for the cultures is as below.
Another interesting observation was the decreasing transformation efficiency of our competent cells (which had efficiency of 5x10⁷ CFU/ng with BBa_J04450 pSB1C3) with test devices conferring the strongest GFP expression.
Discussion
One has the trivial result of the different GFP expression per cell (quantified by Flu/OD), which is representative of the strength of the Anderson promoters in the test devices.
Relevance to our project<For the proof of concept for our idea, measurement of intracellular protein concentrations are of essence. This is primarily possible only via fluorescent proteins, either independently, or by tagging to some other protein of interest.
This is what has driven us to tag Ag43 with sfGFP to estimate its concentration. Hence, the 2016 iGEM interlab study is of special importance to our proof of concept, since it allows for reproducibility of our absolute measurements by any future reviewing iGEM team.


