Team:UBonn HBRS/Description/B Subtilis/Protein Purification
![]()
Protein Purification
Overview
The aim of this project part is to express and secrete our proteins in Bacillus subtilis and purify them. The enzymes used in this project are equipped with a C- terminal polyhistidine-tag (his-tag). A his-tag is a sequence of at least 6 histidine residues, giving the protein of interest an affinity for nickel. Through the complexed nickel ions in Ni-NTA (nitrilotriacetic acid) columns, the proteins containing his-tags can be isolated from other proteins. Specific detection methods via small molecules or antibodies for his-tags also exist, allowing for the simple validation of enzyme expression.
The first step in the protein purification procedure, is to cultivate the bacteria containing the plasmid with the protein to be expressed. Protein expression is then induced through the addition of IPTG (Isopropyl-β-D- thiogalactopyranosid). After further growth for 3-4 hours, the cells are harvested and lysed. The lysed cells are then transferred to Ni-NTA columns, where the his- tagged proteins bind to nickel bearing agarose beads, separating them from the rest of the cellular material. Next the columns are washed to remove all irrelevant material. Lastly the his-tagged proteins are eluted from the beads through the addition of Imidazole (C3N2H4)o. Imidazole, a ring structure also found in the histidine structure, competes with this molecule for binding to the nickel beads thus displacing the his-tagged proteins and eluting them.
Complete Protocol
An overnight culture of 10 mL of medium with antibiotic (1mM, for T7-RNA-Polymerase, Amp) is grown at 37°C and 180 rpm. Inoculate Bacteria in 100ml LB and antibiotic (1mMol). The OD600 is measured every 20 min until an OD600 of 0.5 is reached. Protein expression is then induced through the addition of IPTG (1mMol) and the samples are incubated for another 3-4 h. To control your results it is wise to collect a sample before and after IPTG induction to compare the content of your protein of interest. The bacteria are pelleted at 3000g at 4°C for 30 min. The pellets can either be stored at -20°C or you can immediately proceed with lysing. The bacteria pellets are lysed through the resuspension in 25 mL of lysis buffer prepared according to table 1 and followed by sonification with the settings listed in table 3.
| 50 mM Tris |
| 300 mM NaCL |
| 10% Glycerol |
| 20 mM Imidiazole |
| Ph7.8 |
| 1 min 40%/cont |
| 1 min 70%/cycle 30 |
| 5 min incubation on ice |
| 1 min 70%/ cycle 30 |
The samples are then centrifuged at 3000g at 4°C for
one hour. In this time the agarose beads are prepared.
For each sample you need 1.2 mL Ni-NTA agarose
beads. They are centrifuged for 2 min at 1000rpm and
the supernatant is discarded. The beads are washed
twice with 1.5 mL lysis buffer. After each washing step
the beads are centrifuged again for 2 min at 1000 rpm
and the supernatant is discarded. After washing the
beads are resuspended in 1 mL lysis buffer and stored
on ice. The cleared lysates are distributed into 15 mL
falcons and the Ni-NTA beads are added. The samples
are then incubated at 4°C for 30min to an hour using an
overhead tumbler. The samples are then applied to
large Biorad columns and the flowthrough is
collected. The beads are washed 4x with 5 mL of lysis
buffer each. The wash fractions are collected for later
analysis. Finally, the proteins are eluted through the
addition of 2 x 1.5 mL of elution buffer prepared as
described in table 3. The eluate is collected and kept on
ice. To further purify the protein, the eluate is transferred
to dialysis tubing and dialyzed overnight at 4°C in
dialysis buffer (refer to table 4).
| 50 mM Tris |
| 300 mM NaCl |
| 10% Glycerol |
| 250 mM Imidazole |
| pH 7.8 |
| 500 mM Tris |
| 100 mM NaCl |
| 0.5mM PMSF |
| Ph 8.0 |
All fractions of protein purification, i.e. flowthrough, wash
fraction and eluate are analysed via an SDS page gel.
Visualization
After purification, a SDS page gel is used to analyze the amount of his-tagged proteins in each fraction of the purification procedure, as well as to confirm the expression of the protein. First the bands of the gel are analyzed on a coomassie gel, to confirm the presence of proteins (compare Fig. 3). The his-tagged protein is then specifically visualized via InVisionTM His-Tag In- gel staining. Invision staining results in fluorescent bands that can be detected using UV light (compare Fig. 4). We performed this protocol according to manufacturer's instructions (refer to InVisionTM His-tag In-gel Stain manual, Macherey and Nagel).
Due to the weight variation (22,6 kDA – 107 kDA) of our Enzymes, we used a 12% SDS Page-Gel. The gels were prepared according to table 5. The gels were run at 150V 500mA 30W for 1h.
| Seperating gel 8ml : |
| Aqua dest (ml) 2,64 |
| 30% Acrylamide (ml) 3,2 |
| Tris 1,5 M, pH8,8 (ml) 2 |
| SDS 10% (ul) 80 |
| Aps 10%(ul) 80 |
| TEMED (ul) 8 |
| Stacking gel (5%) 4ml : |
| Aqua dest (ml) 1,36 |
| 30% Acrylamide (ml) 0,34 |
| Tris 1,5 M, pH8,8 (ml) 0,26 |
| SDS 10% (ul) 20 |
| Aps 10%(ul) 20 |
| TEMED (ul) 2 |
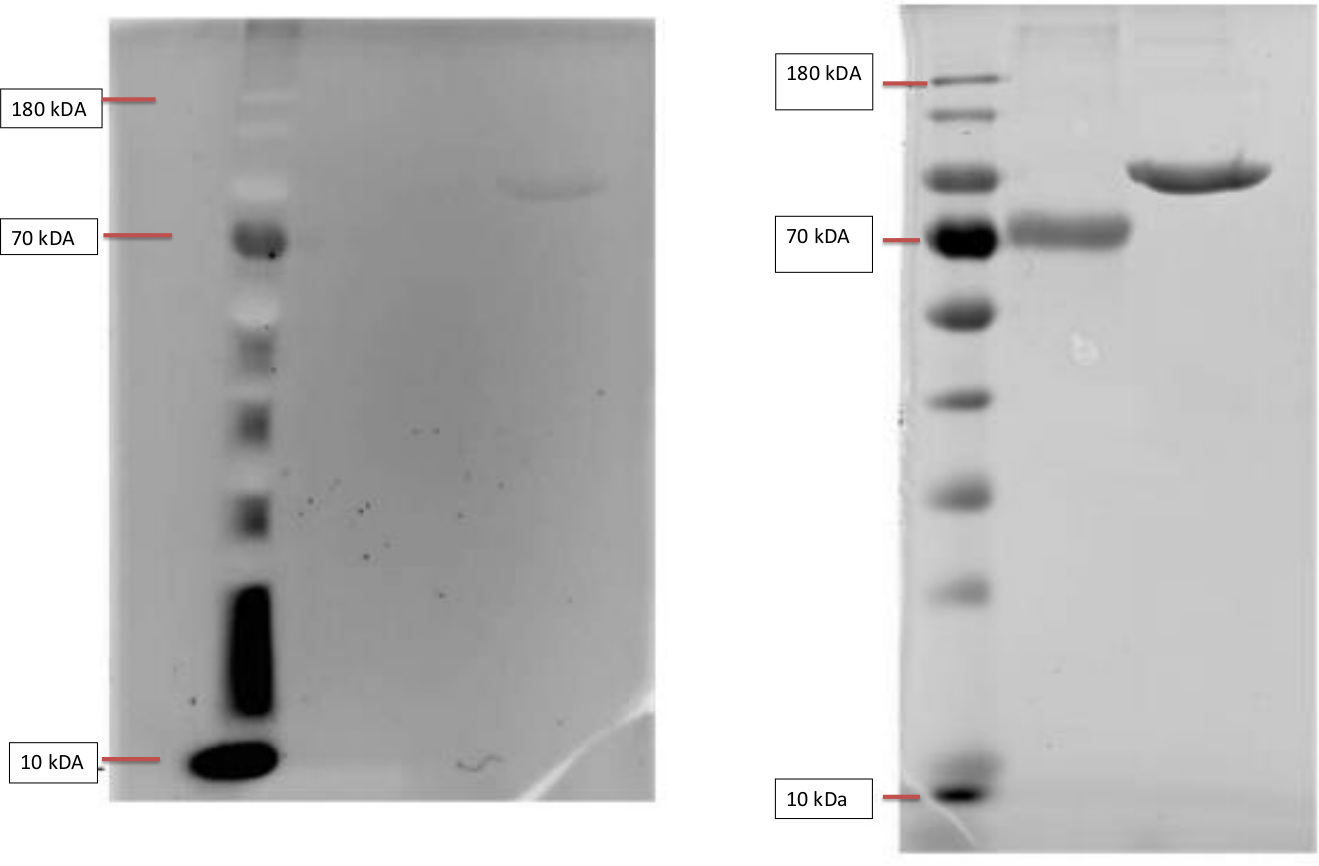
Left: InVisionTM His-tag In-gel Staining of Ladder, BSA and T7-RNA-polymerase.
The Invision Stain was imaged with a Gel doc. The samples were loaded onto the gel in following order, BSA, BSA and T7. The BSA serves as a negative control, as it lacks a his- tag and should not show flourescence. The T7-RNA-Polymerase however contains a his-tag and is thusly visible as a band in the third column.
Right: Coomassiestain of ladder, BSA and T7-RNA-polymerase.
The figure shows a test of our SDS-Protocol and Coomassie staining. The gel shows the bands of our negative control non his-tag protein BSA (Bovine serum albumin) with a weight of 66.5 k in comparison to our positive his-tag protein T7-RNA-Polymerase with a weight of 99kDA.
Due to the lack of time, it was not possible to analyze the
expression of our proteins.