Difference between revisions of "Team:Pretoria UP/Results"
| (20 intermediate revisions by 2 users not shown) | |||
| Line 15: | Line 15: | ||
<div class="title"><br><br><br> | <div class="title"><br><br><br> | ||
<p class = "h2WM">Project Results</p> | <p class = "h2WM">Project Results</p> | ||
| − | <p><b>We divided our synthetic biology work into | + | <p><b>We divided our synthetic biology work into four sub-projects:</b> |
| − | <br><br>1. Development of a | + | <br><br>1. Development of a PSII-binding DNA aptamer (based on in silico prediction) |
| − | + | <br><br>2. Development of a graphene-binding DNA aptamer (using SELEX) | |
| − | <br><br>3. Characterisation of novel laccase enzymes that might be used to reduce oxygen and hydrogen back to water on the cathode electrode of our PBEC. | + | <br><br>3. Characterisation of novel laccase enzymes that might be used to reduce oxygen and hydrogen back to water on the cathode electrode of our PBEC. |
| + | <br><br>4. Expression and characterisation of laccase enzymes that were previously submitted to the Registry. | ||
</p> | </p> | ||
</div> | </div> | ||
| − | + | <center> | |
| + | <img width="300" height="210" src="https://static.igem.org/mediawiki/2016/0/09/T--Pretoria_UP--DecoPlate.jpg"></center> | ||
| + | |||
| + | |||
<div class="section section-we-are-1"> | <div class="section section-we-are-1"> | ||
<div class="text-area"> | <div class="text-area"> | ||
| Line 27: | Line 31: | ||
<div class="row"> | <div class="row"> | ||
<div class="title"> | <div class="title"> | ||
| − | <p class = "h2WM"> | + | <p class = "h2WM">Development of a PSII-binding DNA aptamer</p> |
</div> | </div> | ||
<div class="col-sm-12"> | <div class="col-sm-12"> | ||
<p style="text-align:left;"> | <p style="text-align:left;"> | ||
| − | <b> | + | <b>Designing a DNA aptamer for Photosystem II (PSII)</b> |
| − | <br>We | + | <br>We chose PSII rather than Photosystem I (PSI) as our system of choice as it only requires water for energy generation whereas PSI requires alternative co-factors. We then analysed one dimer of the PSII using Pymol and started off with B-factor analysis. B-factor refers to the displacement of atoms from their mean position in a crystal structure (Trueblood <i>et al.</i>, 1996) . Using this analysis tool, we were able to determine which regions of the PSII complex are the most rigid and structurally stable and hence most suitable for aptamer-mediated targeting. |
| − | + | ||
| + | <br><br><center><img width="600" height="350" src="https://static.igem.org/mediawiki/2016/3/3d/T--Pretoria_UP--Bfactor.png"><center/> | ||
| + | <p style="font-size:14px !important;text-align: center">B-factor testing of Photosystem II (PSII) using Pymol. Red shading indicates higher mobility; blue shading denotes higher rigidity. | ||
| + | </p> | ||
| + | <p style="text-align:left;"> | ||
| + | <br><br>The result of the B-factor analysis revealed two proteins in the complex that were structurally more stable than the rest, namely CP47 and CP43. We decided to target the CP43 and CP47 subunits of the light-harvesting complex (LHC) of PSII to which the one side of the aptamers can bind. This protein is suitable as it is exposed and on the stromal side of the thylakoid membranes (which is important because electrons can more easily be abstracted on the stromal side). These proteins form the core subunits of the PSII complex and we determined them to be the most stable. We used PDF files from a recent crystal structure of the PSII complex (Wei <i>et al.</i>, 2016) as the basis for aptamer design. iGEM team <a href="https://2015.igem.org/Team:Heidelberg">Heidelberg (2015)</a> used their designed MAWS (Making Aptamers Without SELEX) software to design an aptamer sequence which has specifically bind to CP43 and CP47 subunits of PSII. | ||
| + | |||
| + | <br><br>We then removed all non-target proteins and cofactors from the PSII PDB file using Pymol, so that we were left with CP43 and CP47 subunits alone. This file was then sent to Heidelberg 2015 iGEM team who used it as a template for aptamer targeting using their MAWS software. At first the PSII protein complex was too large for the program to compute a prediction, so we reduced the size of the PDB file to target only the stromal side of CP47. This was used as input for which was then ran through the MAWS software to test for the best aptamer oligo sequence. The predicted aptamer candidate had the sequence 5' TACGTTAT 3'. | ||
| + | |||
| + | </p> | ||
| + | <br><br><center><img width="500" height="400" src="https://static.igem.org/mediawiki/parts/c/c6/T-Pretoria_UP--PSII_core.png"></center> | ||
| + | <p style="font-size:14px !important;text-align: center">Figure depicting the core PSII components, with different colours representing distinct subunits of the complex. Pink, CP47; Cyan, CP43; green, D1; yellow, D2. Image drawn in Pymol. | ||
| + | </p> | ||
| + | |||
| + | <br><br><center><img width="500" height="400" src="https://static.igem.org/mediawiki/parts/e/e4/T--Pretoria_UP--aptamer_binding.png"></center> | ||
| + | <p style="font-size:14px !important;text-align: center">Figure depicting the predicted binding of the single stranded DNA aptamer candidate designed by the MAWS software (5' TACGTTAT 3'). The aptamer was predicted to bind to the stromal side of the CP47 subunit. Image drawn in Pymol. | ||
| + | </p> | ||
| + | |||
| + | <div class="col-sm-12"> | ||
| + | <p style="text-align:left;"> | ||
| + | <b>Isolation of thylakoids</b> | ||
| + | <br>Thylakoid extraction was carried out on store-bought spinach, using a protocol designed to extract and isolate intact chloroplasts from leaves, which we derived from Lang <i>et al.</i> (2011), Nagahashi <i>et al.</i> (1985), Rödiger <i>et al.</i> (2010) and Shiraya <i>et al.</i> (2014) as described below . The first protocol used involved grinding frozen tissue with a homogenizer in liquid nitrogen. A volume of 30ml of a “homogenization buffer” was added to 2 - 5 g of tissue, vortexed for 30 seconds and filtered through two layers of 100 µm nylon mesh, followed by two layers of 60 µm mesh. The filtrate was centrifuged at 200 x g for 4 minutes at 4°C, and the supernatant was then centrifuged for 10 minutes at 1500 x g at 4°C. The resulting pellet contained the chloroplasts. The pellet was gently resuspended in 3ml of “resuspension buffer”. Next the plastid suspension was slowly layered onto a discontinuous Percoll density gradient solution, containing equal volumes (9ml) of 85%, 40% and 10% Percoll solutions. The Percoll density gradient solution was then centrifuged at 5000 x g for 45 min at 4°C, after this centrifugation, intact chloroplasts were located on the interface of the 40/85 Percoll and the 10/40 interface contained broken chloroplasts and thylakoid membranes. Both fractions were gently transferred to separate falcon tubes, to which 3 volumes of “wash buffer” was added and then gently washed by centrifugation at 1500 x g for 10 min at 4°C (repeated once). The pellet was then resuspended in wash buffer and 50% glycerol solution for storage. | ||
| + | <br><br>This method extracted extremely pure, intact chloroplasts, but in small yields. Because we only required thylakoid membranes, not intact chloroplasts, separation using a Percoll gradient was not necessary. Furthermore, the protocol used small volumes of material and therefore resulted in a small amount of product. We therefore simplified and scaled up the protocol for crude thylakoid extractions: | ||
| − | <br><br> | + | <br><br>- A larger amount of material (5 - 10 g) was used |
| − | + | <br>- Separation via the percoll density gradient was omitted | |
| + | <br>- The first crude pellet containing the chloroplasts and thylakoids was resuspended in the “wash buffer” and then sonicated to disrupt the chloroplast membrane and therefore increase the amount of free thylakoids in the solution. | ||
| − | <br><br><b>Synthesis, cloning and expression of Eucalyptus grandis laccases</ | + | <br><br>The recipes of the buffers used may be seen in the tables below: |
| − | <br>We searched for Eucalyptus grandis homologs of LAC4 and LAC17, two Arabidopsis thaliana laccase proteins known to reduce phenolic compounds much like the laccases from Trametes versicolor traditionally used in PBECs (Berthet et al. 2011). | + | <br> |
| − | <br><br>Using BLASTP, we identified a number of laccase homologs in the E. grandis genome hosted on Phytozome (phytozome.jgi.doe.gov/pz/portal.html). We used gene expression data from EucGenIE (www.eucgenie.org; Hefer et al. 2011) to prioritise four laccase candidates based on high expression, especially in developing wood where these proteins are required for the polymerisation of monolignol substrates into lignin. | + | </p> |
| − | <br><br>Four | + | |
| + | <p style="text-align:center;"> | ||
| + | <img style="max-width:40%" src="https://static.igem.org/mediawiki/2016/4/48/T--Pretoria_UP--Results_3.png"> | ||
| + | <img style="max-width:40%" src="https://static.igem.org/mediawiki/2016/e/e5/T--Pretoria_UP--Results_4.png"> | ||
| + | <img style="max-width:40%" src="https://static.igem.org/mediawiki/2016/7/75/T--Pretoria_UP--Results_5.png"> | ||
| + | <img style="max-width:40%" src="https://static.igem.org/mediawiki/2016/5/59/T--Pretoria_UP--Results_6.png"> | ||
| + | <br> | ||
| + | </p> | ||
| + | |||
| + | <p style="text-align:center;"> | ||
| + | <img height="500px" src="https://static.igem.org/mediawiki/2016/c/c5/T--Pretoria_UP--Results_2.png"> | ||
| + | <p style="font-size:14px !important;text-align: center">Thylakoid extractions from spinach leaves. (Left) Percoll gradient-mediated purification. The top green layer contains a mixture of thylakoid membranes and broken chloroplasts, while the bottom layer contains pure intact chloroplasts. (Right) The resulting product of the simplified extraction. | ||
| + | </p> | ||
| + | |||
| + | <br><br> | ||
| + | |||
| + | <div class="col-sm-12"> | ||
| + | <p style="text-align:left;"> | ||
| + | <b>Assessment of thylakoid binding by candidate aptamer</b> | ||
| + | <br>1. We synthesized the predicted PSII-binding aptamer (5' TACGTTAT 3') with an extra "foot" of random nucleic acids of 25-nt in length to give it a foothold to a nitrocellulose membrane. As a negative control, we synthesized a random oligo of the same length. (Reagents/materials used: | ||
| + | - Aptamers (N)25TACGTTAT: Stock (100uM) and working solution (10uM) | ||
| + | Random sequence as negative control | ||
| + | Nitrocellulose membrane | ||
| + | Thylakoids | ||
| + | Cherring testis DNA (1ul diluted in 20ml TBS) | ||
| + | TBS: | ||
| + | 5% (m/v) non-fat milk in TBS | ||
| + | |||
| + | Procedure: | ||
| + | <br>2. We made serial dilutions of the aptamers and negative control sequences from the 10 uM working solution: undiluted, 1/10, 1/100, 1/500, 1/1000. | ||
| + | <br>3. The nitrocellulose membrane was cut to the desired size, marked and spotted with 3 ul of aptamer solution. As a positive control, the thylakoid extraction was spotted directly onto the membrane. | ||
| + | <br>4. Non-specific sites were blocked by incubating it with the herring testis DNA for 30 min at 37°C followed by three wash steps with TBS (50 mM Tris-HCl pH 7.5, 150 mM NaCl). | ||
| + | <br>5. The blot was further blocked with 5% m/v nonfat milk solution followed by washing three times with TBS. | ||
| + | <br>6. The membrane was incubated in the thylakoid solution (diluted in TBS containing protease-inhibitor) on ice for 2 hours. It was then washed 3 times for 5 min with TBS at 4°C to remove any unbound thylakoids. | ||
| + | <br>7. The blots were imaged with a Carl Zeiss LSM 5 confocal microscope, excitation wavelength 395 nm, to observe chlorophyll autofluorescence of the bound thylakoids. | ||
| + | |||
| + | <br><br><b>Result:</b> We were able to visualize thylakoids directly bound to the nitrocellulose membrane based on the autofluorescence of chlorophyll pigment in the photosystems. However, no significant binding of thylakoids was observed at regions of the membrane that were pre-spotted with the candidate PSII-binding aptamer. | ||
| + | |||
| + | <br><br><center><img width="700" height="1000" src="https://static.igem.org/mediawiki/parts/3/30/T--Pretoria_UP--Thylakoid_binding.jpg"></center> | ||
| + | |||
| + | <p style="font-size:14px !important;text-align: center">Confocal micrograph of thylakoid binding to candidate DNA aptamers. Positive control: thylakoids bound directly to nitrocellulose membrane. Random region: background binding of thylakoids to blocked membrane. Aptamer: level of thylakoid binding to membrane-bound candidate DNA aptamer. Negative control: level of thylakoid binding to membrane-bound random oligo. | ||
| + | </p> | ||
| + | |||
| + | |||
| + | |||
| + | <div class="section section-we-are-1"> | ||
| + | <div class="text-area"> | ||
| + | <div class="container"> | ||
| + | <div class="row"> | ||
| + | <div class="title"> | ||
| + | <p class = "h2WM">Development of a graphene-binding DNA aptamer</p> | ||
| + | </div> | ||
| + | <div class="col-sm-12"> | ||
| + | <p style="text-align:left;"> | ||
| + | |||
| + | Part of our envisioned aptamer needed to be designed to specifically bind to graphene foam which will of which our electrodes will be made. DNA naturally binds to graphene with pi-pi bonds if the DNA is 20.2Å from the graphene. We planned to test whether different DNA sequences will bind with different levels of binding affinities, i.e. whether or not oligo sequence plays a role in the binding affinity of DNA to graphene. | ||
| + | |||
| + | <br><br>We aimed to determine whether different DNA sequences bind with different affinities through Systematic Evolution of Ligands by EXponential enrichment (SELEX). For this process we started by incubating a whole lot of random oligonucleotides of the same length and with the same 5’ and 3’ ends, which serve as primer binding sites, with our graphene foam electrodes. The principle behind this is that during this incubation step many of the random oligos will bind to the graphene ranging from strong affinity to weak binding affinity, and many of the oligos won’t bind at all. The excess oligos that didn’t bind was removed. We then washed off the oligos that bound less strongly to the graphene with a low stringency buffer (10 mM Tris-HCl). At this point only strongly binding oligos will be present, which were then eluted from the graphene with warm 6M urea. The eluted DNA was then PCR amplified to create a new library. This same process was repeated twice each time with buffers of increasing stringency, namely Tris-HCl + 1% SDS and Tris-HCl + 1% SDS + 1% Tween respectively. | ||
| + | |||
| + | <br><br><b>SELEX</b> | ||
| + | <br><br> | ||
| + | <center><img width="600" height="400" src="https://static.igem.org/mediawiki/parts/6/68/T--Pretoria_UP--selex.png"></center> | ||
| + | <p style="font-size:14px !important;text-align: center">Confocal micrograph of thylakoid binding to candidate DNA aptamers. Positive control: thylakoids bound directly to nitrocellulose membrane. Random region: background binding of thylakoids to blocked membrane. Aptamer: level of thylakoid binding to membrane-bound candidate DNA aptamer. Negative control: level of thylakoid binding to membrane-bound random oligo. | ||
| + | </p> | ||
| + | <div class="col-sm-12"> | ||
| + | <p style="text-align:left;"> | ||
| + | |||
| + | |||
| + | <br><br><b>Graphene wash steps</b> | ||
| + | <br>Determining how we would wash the graphene with the different buffers and capturing the DNA that was washed off after each wash and elution step proved to be quite the challenge. However we came up with an effective system to wash the graphene with the buffers. We first incubated the graphene with the aptamers, then we pulverized the graphene into syringe filter tips. We then sequentially passed through the different buffers and captured the eluent in separate eppendorf tubes. | ||
| + | |||
| + | <br><center><img width="400" height="320" src="https://static.igem.org/mediawiki/2016/c/c4/T--Pretoria_UP--Graphene_wash_.jpg"></center> | ||
| + | <p style="font-size:14px !important;text-align: center">Image displaying a syringe filter without pulverized graphene (left) and pulverized graphene (right). | ||
| + | |||
| + | </p> | ||
| + | <div class="col-sm-12"> | ||
| + | <p style="text-align:left;"> | ||
| + | |||
| + | |||
| + | <br><br><b>PCR optimisation</b> | ||
| + | <br>PCR optimization: | ||
| + | Before starting with the SELEX procedure we had to determine what the PCR conditions were going to be. We needed to set up an asymmetric PCR to obtain single stranded DNA products. For the PCR optimization we mainly looked at two parameters: the number of cycles and primer ratios. The theory behind asymmetric PCR is that you add excessive amounts of one of the primers, as a result in the PCR cycle you will start off making double stranded DNA products. Eventually the limiting primer will run out and with one primer left, only single stranded DNA will be amplified from the double stranded template. The primer ratios we tested for include 1:1, 10:1, 15:1 and 20:1, the amount of cycles we tested included 30, 40, 50 and 70 cycles. | ||
| + | |||
| + | <br><br><center><img width="500" length="500" src="https://static.igem.org/mediawiki/2016/0/00/T--Pretoria_UP--PCR_Optimization_Gel.jpg"></center> | ||
| + | <p style="font-size:14px !important;text-align: center">Asymmetric PCR optimisation using different primer ratios. Eqi, equimolar amounts of primers. | ||
| + | |||
| + | </p> | ||
| + | <div class="col-sm-12"> | ||
| + | <p style="text-align:left;"> | ||
| + | |||
| + | |||
| + | <br><br>From this figure we found that the asymmetric PCR was successful. The green arrows indicate an equimolar concentration PCR. All the samples from the orange arrow onwards were obtained from asymmetric PCR reactions. Though not clear on the 3% agarose gel in most of the samples i.e. samples 4, 5, 6, 7, 9, 10, 11, 12 and 15 clearly had two bands of the expected size range. The top bands occur in the same location as the positive equimolar controls at the size of approximately 70 bp. The bottom band which is smaller than the double stranded product is clearly the single stranded product. Even though the two bands are of equal length the single stranded product is physically much smaller than the double stranded product and thus moves through the gel more readily. The single stranded product is also is more intense than that of the double stranded band which confirms that we got higher yield of the single stranded product. From this gel the optimal number of PCR cycles could not be determined. | ||
| + | |||
| + | <br><br><center><img width="600" height="400" src="https://static.igem.org/mediawiki/2016/b/bc/T--Pretoria_UP--ASSYMETRIC_pcr_2016-09-29_13hr_33min.jpg"></center> | ||
| + | <p style="font-size:14px !important;text-align: center">Polyacrylamide gel of an asymmetric PCR made from the first round of SELEX. This gel clearly showed the separation between the single stranded (lower band) and the double stranded (upper band) DNA. | ||
| + | |||
| + | </p> | ||
| + | <div class="col-sm-12"> | ||
| + | <p style="text-align:left;"> | ||
| + | |||
| + | |||
| + | <div class="section section-we-are-1"> | ||
| + | <div class="text-area"> | ||
| + | <div class="container"> | ||
| + | <div class="row"> | ||
| + | <div class="title"> | ||
| + | <p class = "h2WM">Synthesis, cloning and expression of <i>Eucalyptus grandis</i> laccases</p> | ||
| + | </div> | ||
| + | <div class="col-sm-12"> | ||
| + | <p style="text-align:left;"> | ||
| + | <br>Here, we chose a rapid cell-free expression system that makes use of the SP6 phage promoter and does not require a transcriptional terminator. We searched for <i>Eucalyptus grandis</i> homologs of LAC4 and LAC17, two <i>Arabidopsis thaliana</i> laccase proteins known to reduce phenolic compounds much like the laccases from Trametes versicolor traditionally used in PBECs (Berthet <i>et al</i>. 2011). | ||
| + | <br><br>Using BLASTP, we identified a number of laccase homologs in the <i>E. grandis</i> genome hosted on Phytozome (phytozome.jgi.doe.gov/pz/portal.html). We used gene expression data from EucGenIE (www.eucgenie.org; Hefer <i>et al</i>. 2011) to prioritise four laccase candidates based on high expression, especially in developing wood where these proteins are required for the polymerisation of monolignol substrates into lignin. | ||
| + | <br><br>Four laccase proteins from <i>Eucalyptus grandis</i> were synthesized: | ||
<br><br>Eucgr.A01282<br>Eucgr.F02641<br>Eucgr.B02797<br>Eucgr.G03098 | <br><br>Eucgr.A01282<br>Eucgr.F02641<br>Eucgr.B02797<br>Eucgr.G03098 | ||
| − | <br><br>Two of the laccases were cloned into pSB1C3 and submitted as new parts. | + | <br><br>Two of the laccases were cloned into pSB1C3 and submitted as new parts (see our parts page for more information). |
| − | <br><br>For expression, an SP6 promoter was added for Phage SP6 RNA Polymerase to transcribe and translate the genes in vitro by making use of an SP6 in vitro expression kit (Promega TNT SP6 Coupled Wheat Germ Extract System). The advantage of this is that expression is fast, easy and does not require a T7 transcription termination sequence. | + | |
| + | <br><br>Two of the laccases were cloned into pSB1C3 and submitted as new parts. We were forced to use digested and gel-purified pSB1C3-mRFP1 (BBa_J04450) from the distribution kit after the linearized backbone ran out for the remaining of our cloning reactions. This proved to be a poor choice, since self-annealing and/or non-linearized vector contamination became a major hindrance. No matter how well we gel-purified the digested pSB1C3-mRFP1 fragment, We frequently observed pink colonies that expressed the mRFP protein and these did not contain the laccase insert. | ||
| + | |||
| + | <br><center><img width="400" height="300" src="https://static.igem.org/mediawiki/2016/1/10/T--Pretoria_UP--vector_problems.jpg"></center> | ||
| + | <p style="font-size:14px !important;text-align: center">An example of two colonies on a replica plate that turned pink as a result of pSB1C3-mRFP1 contamination. | ||
| + | </p> | ||
| + | <div class="col-sm-12"> | ||
| + | <p style="text-align:left;"> | ||
| + | |||
| + | <br><br>For expression, an SP6 promoter was added for Phage SP6 RNA Polymerase to transcribe and translate the genes <i>in vitro</i> by making use of an SP6 in vitro expression kit (Promega TNT SP6 Coupled Wheat Germ Extract System). The advantage of this is that expression is fast, easy and does not require a T7 transcription termination sequence. | ||
<br><br><b>Development of SP6 promoter as standard part</b> | <br><br><b>Development of SP6 promoter as standard part</b> | ||
| Line 50: | Line 198: | ||
<br>Oligo 1: 5’ CGCGAATTCGCGGCCGCTTCTAGAGATTTAGGTGACAC 3’ | <br>Oligo 1: 5’ CGCGAATTCGCGGCCGCTTCTAGAGATTTAGGTGACAC 3’ | ||
<br>Oligo 2: 5’ CGCCTGCAGCGGCCGCTACTAGTACTATAGTGTCACCTAAA 3’ | <br>Oligo 2: 5’ CGCCTGCAGCGGCCGCTACTAGTACTATAGTGTCACCTAAA 3’ | ||
| − | <br><br>These oligos were allowed to | + | <br><br>These oligos were allowed to anneal at room temperature and were then extended with <i>Bsu</i> DNA polymerase, large fragment (NEB) at 37°C for 30 min. The resulting fragment was digested with EcoRI and PstI, cloned into pSB1C3, sequenced and submitted as part BBa_K2037000. |
| − | + | ||
| + | <br><br><center><img width="250" height="300" src="https://static.igem.org/mediawiki/2016/4/45/T--Pretoria_UP--SP6construct.jpg | ||
| + | "></center> | ||
| + | <p style="font-size:14px !important;text-align: center">Constitution of the SP6 promoter from two self-annealing oligos. | ||
| + | </p> | ||
| + | <div class="col-sm-12"> | ||
| + | |||
<br><br> | <br><br> | ||
<p style="text-align:center;"> | <p style="text-align:center;"> | ||
<img height="500px" src="https://static.igem.org/mediawiki/2016/5/50/T--Pretoria_UP--Results_1.png"> | <img height="500px" src="https://static.igem.org/mediawiki/2016/5/50/T--Pretoria_UP--Results_1.png"> | ||
<p style="font-size:14px !important;text-align: center">Sequencing result of cloned SP6 promoter parts. Four of six clones sequenced produced chromatograms agreeing with the reference sequence. | <p style="font-size:14px !important;text-align: center">Sequencing result of cloned SP6 promoter parts. Four of six clones sequenced produced chromatograms agreeing with the reference sequence. | ||
| + | |||
| + | <p style="text-align:left;"> | ||
| + | |||
| + | |||
| + | <br><br>To test the functionality of this promoter as a standard part with RFC10 prefix and suffix sequence, we appended it to the mRFP1 fragment (BBa_J04450) for <i>in vitro</i> expression. The TNT SP6 yeast extract expression kit (Promega) was used to attempt expression of mRFP1 under the regulation of the SP6 promoter. However, after a 2 hour incubation period there was no significant increase in fluorescence in the SP6-mRFP sample compared to the negative control (only SP6). This means that the SP6 promoter was not able to drive expression of mRFP in the <i>in vitro</i> expression kit, or such low levels of expression occurred that it is not possible to measure. We did not have a chance to sequence the construct to confirm its integrity. | ||
| + | |||
| + | <br><br><center><img width="250" height="210" src="https://static.igem.org/mediawiki/2016/b/b9/T--Pretoria_UP--SP6-mRFP.jpg"></center> | ||
| + | <p style="font-size:14px !important;text-align: center">Left: Negative control (pSB1C3-SP6); Right: SP6-mRFP1 in pSB1C3 vector. No clear mRFP1 pigementation was seen in the SP6-mRFP1 construct after 2h <i>in vitro</i> expression. | ||
| + | |||
| + | <p style="text-align:left;"> | ||
| + | |||
| + | |||
| + | |||
| + | <div class="section section-we-are-1"> | ||
| + | <div class="text-area"> | ||
| + | <div class="container"> | ||
| + | <div class="row"> | ||
| + | <div class="title"> | ||
| + | <p class = "h2WM">Characterisation of existing laccase parts</p> | ||
| + | </div> | ||
| + | <div class="col-sm-12"> | ||
| + | <p style="text-align:left;"> | ||
| + | <br>Two existing laccases in the registry submitted by the <a href=”https://2012.igem.org/Team:Bielefeld-Germany”>2012 Bielefeld-Germany team</a>, <a href=”http://parts.igem.org/wiki/index.php?title=Part:BBa_K863010”>BBa_K863010</a> (tthl) and <a href=”http://parts.igem.org/wiki/index.php?title=Part:BBa_K863020”>BBa_K863020</a> (bhaI) from <i>Thermo thermophilus </i> and <i>Bacillus halodurans</i> respectively, have not yet been characterised. We aimed to express these proteins in <i>Escherichia coli</i> to study the laccase activity on synthetic substrates at different pH levels. | ||
| + | <br><br><i>E. coli</i> BL21Star cells were transformed with these parts, each of which contained a T7 promoter and termination sequence flanking the coding sequences. Expression was induced with 1 mM IPTG and protein expression was performed for 24h at 30°C, after which cells were harvested followed by sonication in protein extraction buffer (10 mM phosphate buffer pH 7, 150 mM NaCl, 5% glycerol, 10 mM beta-mercaptoethanol, 0.1 mM PMSF, 1X Roche complete protease inhibitors). A pET160-GW/CAT construct (Invitrogen) expressing the chloramphenicol acetyltransferase (CAT) protein was used as a positive control for induction. The soluble fraction was analyzed on a 12% SDS-PAGE gel followed by Coomassie staining. | ||
| + | |||
| + | <br><br>We observed expression of the positive control CAT protein (~32 kDa), but no evidence of tthl (BBa_K863010) or bhal (BBa_K863020) expression: | ||
| + | |||
| + | <br><br><center><img width="450" height="500" src="https://static.igem.org/mediawiki/parts/8/80/T--Pretoria_UP--SDS-PAGE_laccases.png"></center> | ||
| + | <p style="font-size:14px !important;text-align: center">SDS-PAGE analysis of <i>E. coli</i> extracts. Approx. 50 ug of protein was loaded per well. Expression of that CAT control protein is indicated. | ||
| + | </p> | ||
| + | |||
| + | <div class="col-sm-12"> | ||
| + | <p style="text-align:left;"> | ||
| + | <br><br>Nevertheless, we assumed there would be some functional laccase present, and proceeded with decolorisation assays. | ||
| + | |||
| + | |||
| + | <br><br><b>Decolorisation assay with bromophenol blue</b> | ||
| + | <br>We adapted a protocol by Foroontanfar <i>et al.</i> (2012) based on the decolorization of bromophenol blue. We first experimented with a standard solution of laccase purified from <i>Trametes versicolor</i> (Sigma) by incubating 200 ul bromophenol blue (0.05 mg/ml) in 0.1 M citrate buffer pH 4.5 containing 1.5 mM copper sulphate with various quantities of <i>Trametes</i> laccase. | ||
| + | |||
| + | <br><br>Next, we assayed the crude soluble fraction of the tthl and bhal <i>E. coli</i> protein extracts for laccase activity at different pH levels. <i>Trametes</i> laccase was used as a positive control; as a negative control we used the induced CAT control protein fraction. The positive control, from <i>Trametes</i>, worked very well as a positive control, but only at low pH. Aside from that, there was no significant difference between the absorbance of the laccases and CAT. | ||
| + | |||
</p> | </p> | ||
</p> | </p> | ||
| Line 65: | Line 260: | ||
</div><!--section section-we-are-1--> | </div><!--section section-we-are-1--> | ||
| + | |||
| + | <br> | ||
| + | </p> | ||
| + | </div> | ||
| + | </div> | ||
| + | </div> | ||
| + | </div> | ||
| + | </div><!--section section-we-are-1--> | ||
| + | |||
<div class="section section-we-are-1"> | <div class="section section-we-are-1"> | ||
<div class="text-area"> | <div class="text-area"> | ||
| Line 70: | Line 274: | ||
<div class="row"> | <div class="row"> | ||
<div class="title"> | <div class="title"> | ||
| − | <p class = "h2WM"> | + | <p class = "h2WM">References</p> |
| − | </div> | + | </div> |
<div class="col-sm-12"> | <div class="col-sm-12"> | ||
<p style="text-align:left;"> | <p style="text-align:left;"> | ||
| − | + | <br>Berthet, S., Demont-Caulet, N., Pollet, B., Bidzinski, P., Cézard, L., Bris, P.L., Borrega, N., Hervé, J., Blondet, E., Balzergue, S., Lapierre, C., Jouanin, L. (2011). Disruption of LACCASE4 and 17 results in tissue-specific alterations to lignification of <i>Arabidopsis thaliana</i> stems. <i>The Plant Cell</i> 23: 1124-1137 | |
| − | + | ||
| − | + | ||
| − | + | <br><br>Foroontanfar, H., Moezzi, A., Aghiae-Khozani, M., Mahmoudjanlou, Y., Ameri, A., Niknejad, F., Faramarzi, A. (2012). Synthetic due colorization by three sources of fungal laccase. <i>Iranian Journal of Environmental Health Sciences & Engineering</i> 9:27. | |
| − | + | <br><br>Hefer, C., Mizrachi, E., Joubert, F., Myburg, A. (2011). The <i>Eucalyptus</i> genome integrative explorer (EucGenIE): a resource for <i>Eucalyptus</i> genomics and transcriptomics. <i>BMC Proceedings</i> 5: O49 | |
| − | + | <br><br>Lang, E.G., Mueller, S.J., Hoernstein, S.N., Porankiewicz-Asplund, J., Vervliet-Scheebaum, M., Reski, R. (2011). Simultaneous isolation of pure and intact chloroplasts and mitochondria from moss as the basis for sub-cellular proteomics. <i>Plant cell reports</i> 30: 205-215. | |
| − | + | <br><br>Nagahashi, G., 1985. The marker concept in cell fractionation, In: <i>Cell Components</i>. Springer, pp. 66-84. | |
| − | + | <br><br>Rödiger, A., Baudisch, B., Klösgen, R.B. (2010). Simultaneous isolation of intact mitochondria and chloroplasts from a single pulping of plant tissue. <i>Journal of plant physiology</i> 167: 620-624. | |
| − | + | <br><br>Shiraya, T., Kaneko, K., Mitsui, T. (2014). Quantitative Proteomic Analysis of Intact Plastids. <i>Plant Proteomics: Methods and Protocols</i> 469-480. | |
| − | + | <br><br>Wei, X., Su, X., Cao, P., Liu, X., Chang, W., Li, M., Zhang, X., Liu, Z. (2016). Structure of spinach photosystem II-LHCII supercomplex at 3.2 Å resolution. <i>Nature</i> 534:69–74. | |
| − | + | ||
| − | + | ||
| − | + | ||
| − | + | ||
| − | + | ||
| − | + | ||
| − | + | ||
| − | + | ||
| − | + | ||
| − | + | ||
| − | + | ||
| − | <br> | + | |
| − | + | ||
| − | + | ||
| − | + | ||
| − | + | ||
| − | + | ||
| − | + | ||
| − | + | ||
| − | + | ||
| − | + | ||
| − | + | ||
| − | < | + | |
| − | + | ||
| − | <br><br>Rödiger, A., Baudisch, B., Klösgen, R.B. (2010). | + | |
| − | <br><br> | + | |
| − | + | ||
</p> | </p> | ||
</div> | </div> | ||
| Line 117: | Line 292: | ||
</div> | </div> | ||
</div> | </div> | ||
| − | </div><!--section section-we-are-1--> | + | </div><!--section section-we-are-1--> |
</div> | </div> | ||
Latest revision as of 03:19, 20 October 2016
Project Results We divided our synthetic biology work into four sub-projects:
Development of a PSII-binding DNA aptamer
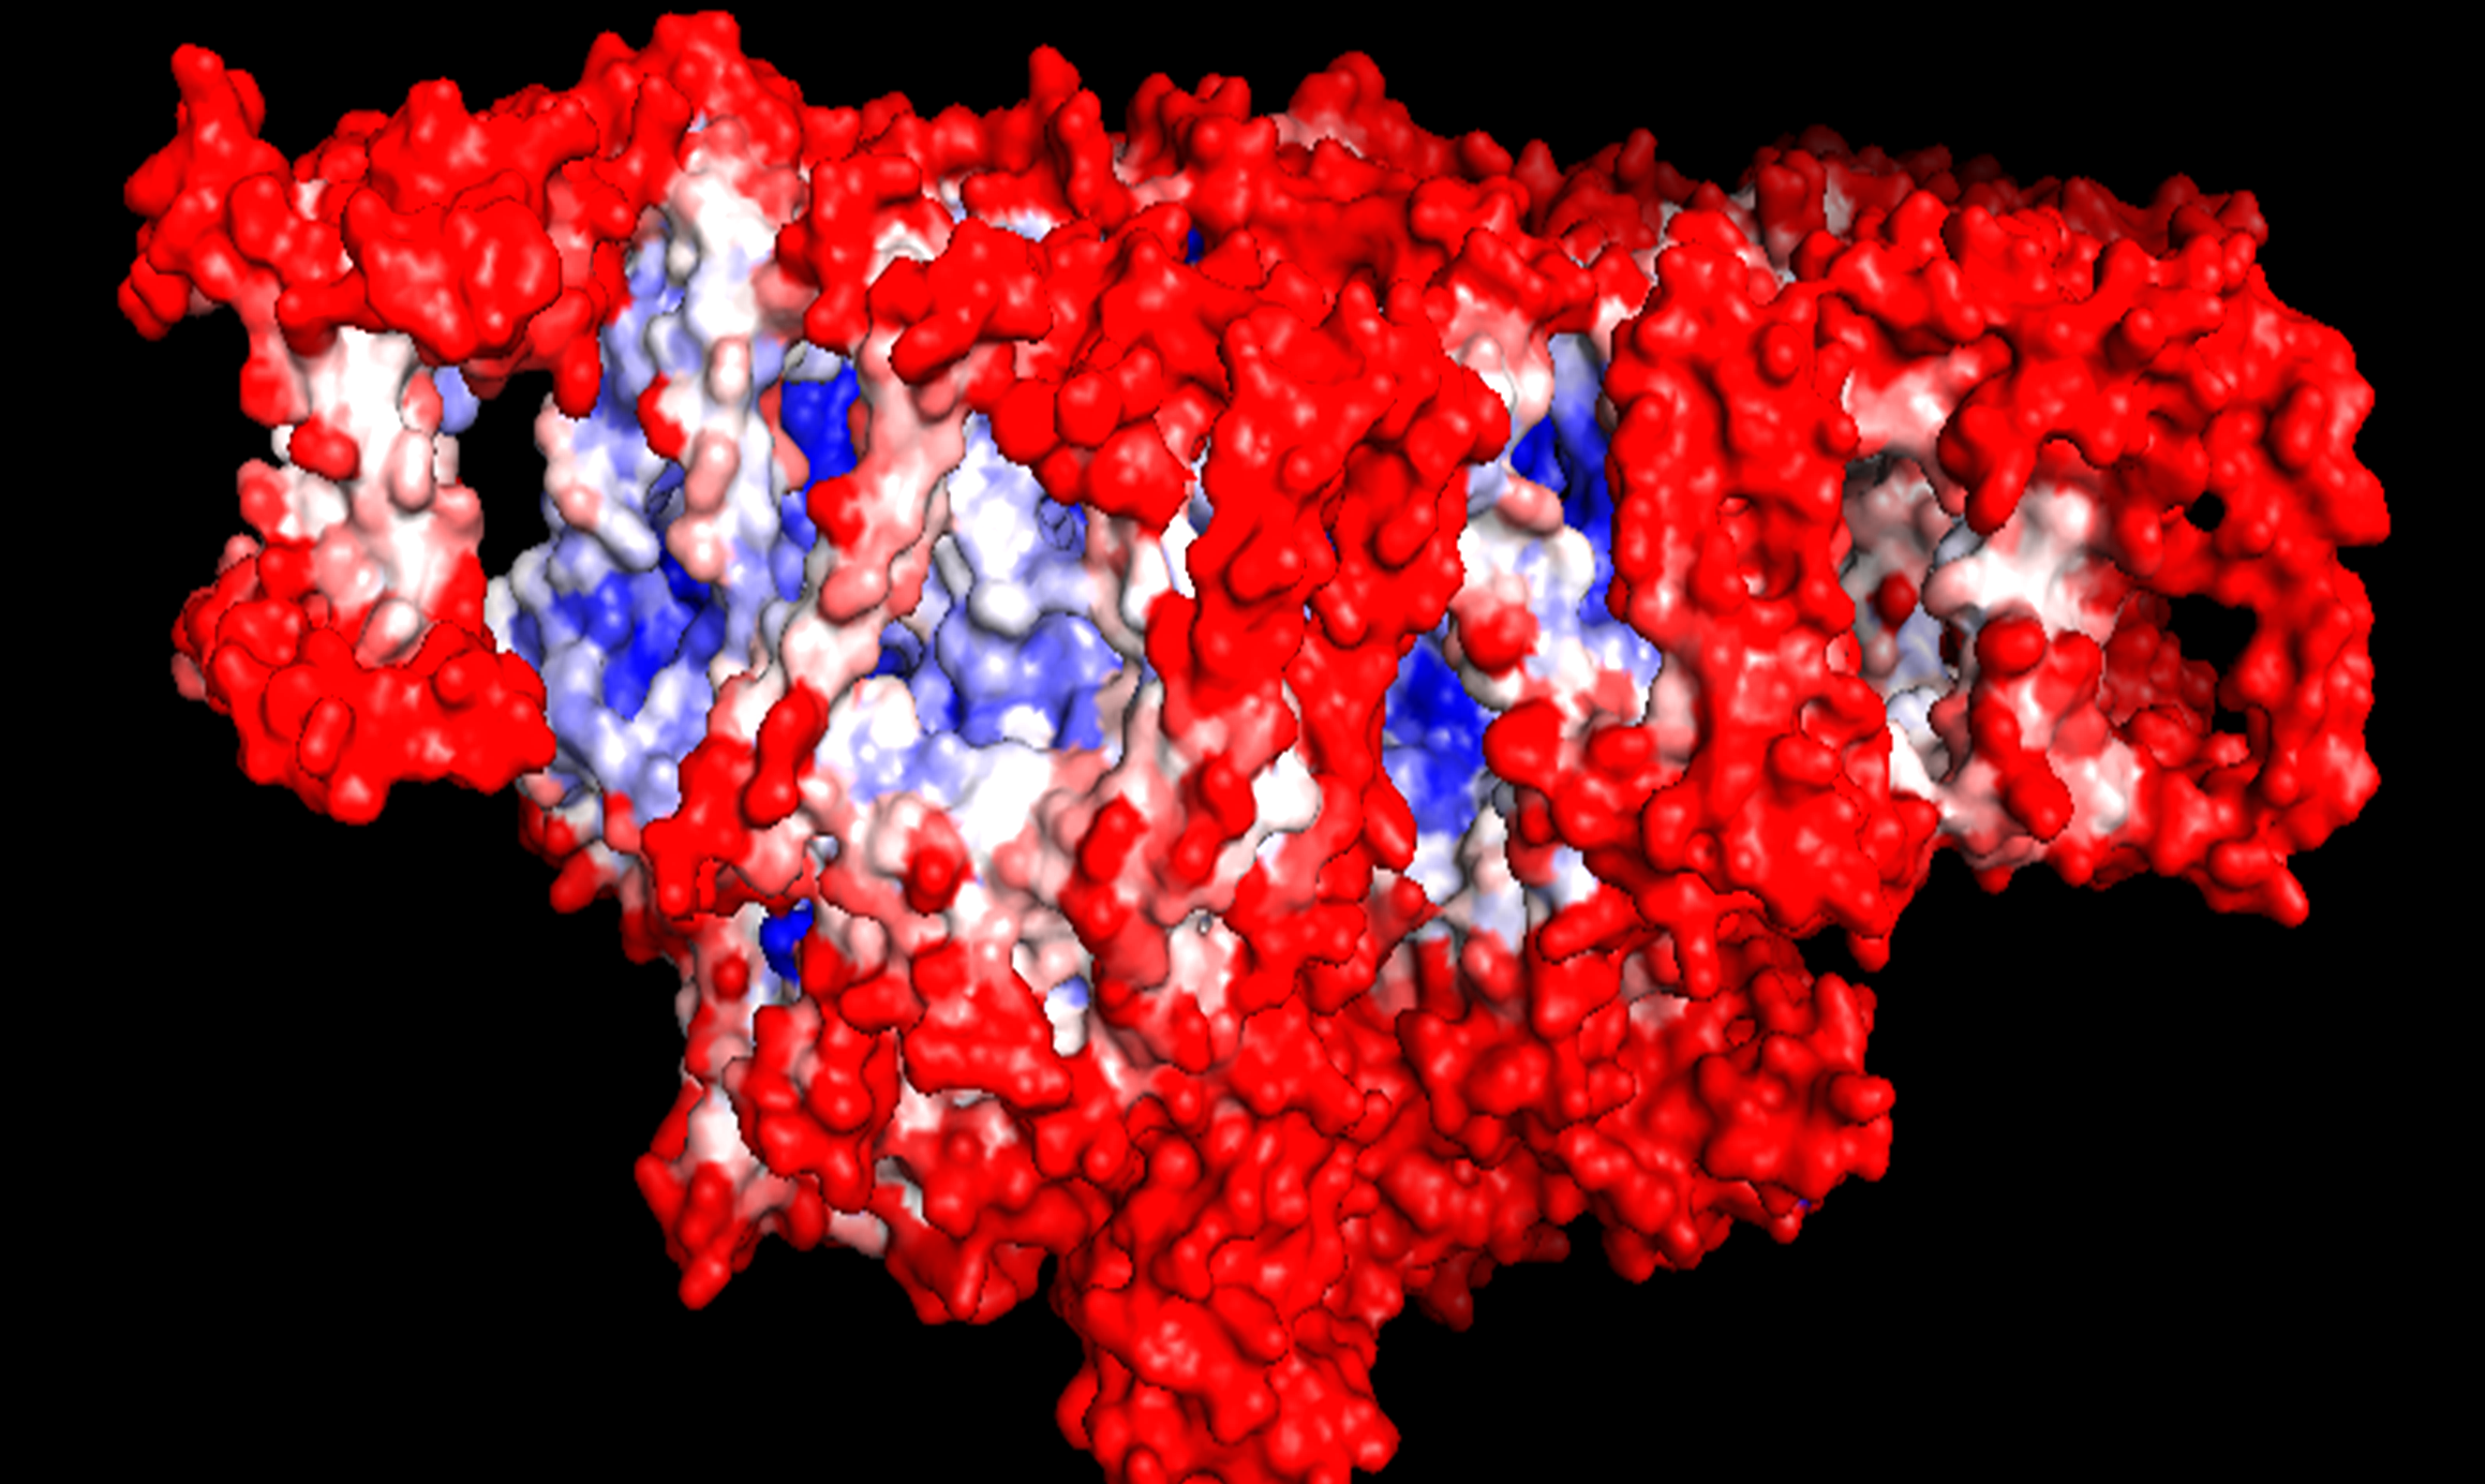
Designing a DNA aptamer for Photosystem II (PSII)
B-factor testing of Photosystem II (PSII) using Pymol. Red shading indicates higher mobility; blue shading denotes higher rigidity.
Figure depicting the core PSII components, with different colours representing distinct subunits of the complex. Pink, CP47; Cyan, CP43; green, D1; yellow, D2. Image drawn in Pymol.
Figure depicting the predicted binding of the single stranded DNA aptamer candidate designed by the MAWS software (5' TACGTTAT 3'). The aptamer was predicted to bind to the stromal side of the CP47 subunit. Image drawn in Pymol.
Isolation of thylakoids
Thylakoid extractions from spinach leaves. (Left) Percoll gradient-mediated purification. The top green layer contains a mixture of thylakoid membranes and broken chloroplasts, while the bottom layer contains pure intact chloroplasts. (Right) The resulting product of the simplified extraction.
Assessment of thylakoid binding by candidate aptamer
Confocal micrograph of thylakoid binding to candidate DNA aptamers. Positive control: thylakoids bound directly to nitrocellulose membrane. Random region: background binding of thylakoids to blocked membrane. Aptamer: level of thylakoid binding to membrane-bound candidate DNA aptamer. Negative control: level of thylakoid binding to membrane-bound random oligo.
Development of a graphene-binding DNA aptamer
Part of our envisioned aptamer needed to be designed to specifically bind to graphene foam which will of which our electrodes will be made. DNA naturally binds to graphene with pi-pi bonds if the DNA is 20.2Å from the graphene. We planned to test whether different DNA sequences will bind with different levels of binding affinities, i.e. whether or not oligo sequence plays a role in the binding affinity of DNA to graphene.
Confocal micrograph of thylakoid binding to candidate DNA aptamers. Positive control: thylakoids bound directly to nitrocellulose membrane. Random region: background binding of thylakoids to blocked membrane. Aptamer: level of thylakoid binding to membrane-bound candidate DNA aptamer. Negative control: level of thylakoid binding to membrane-bound random oligo.
Image displaying a syringe filter without pulverized graphene (left) and pulverized graphene (right).
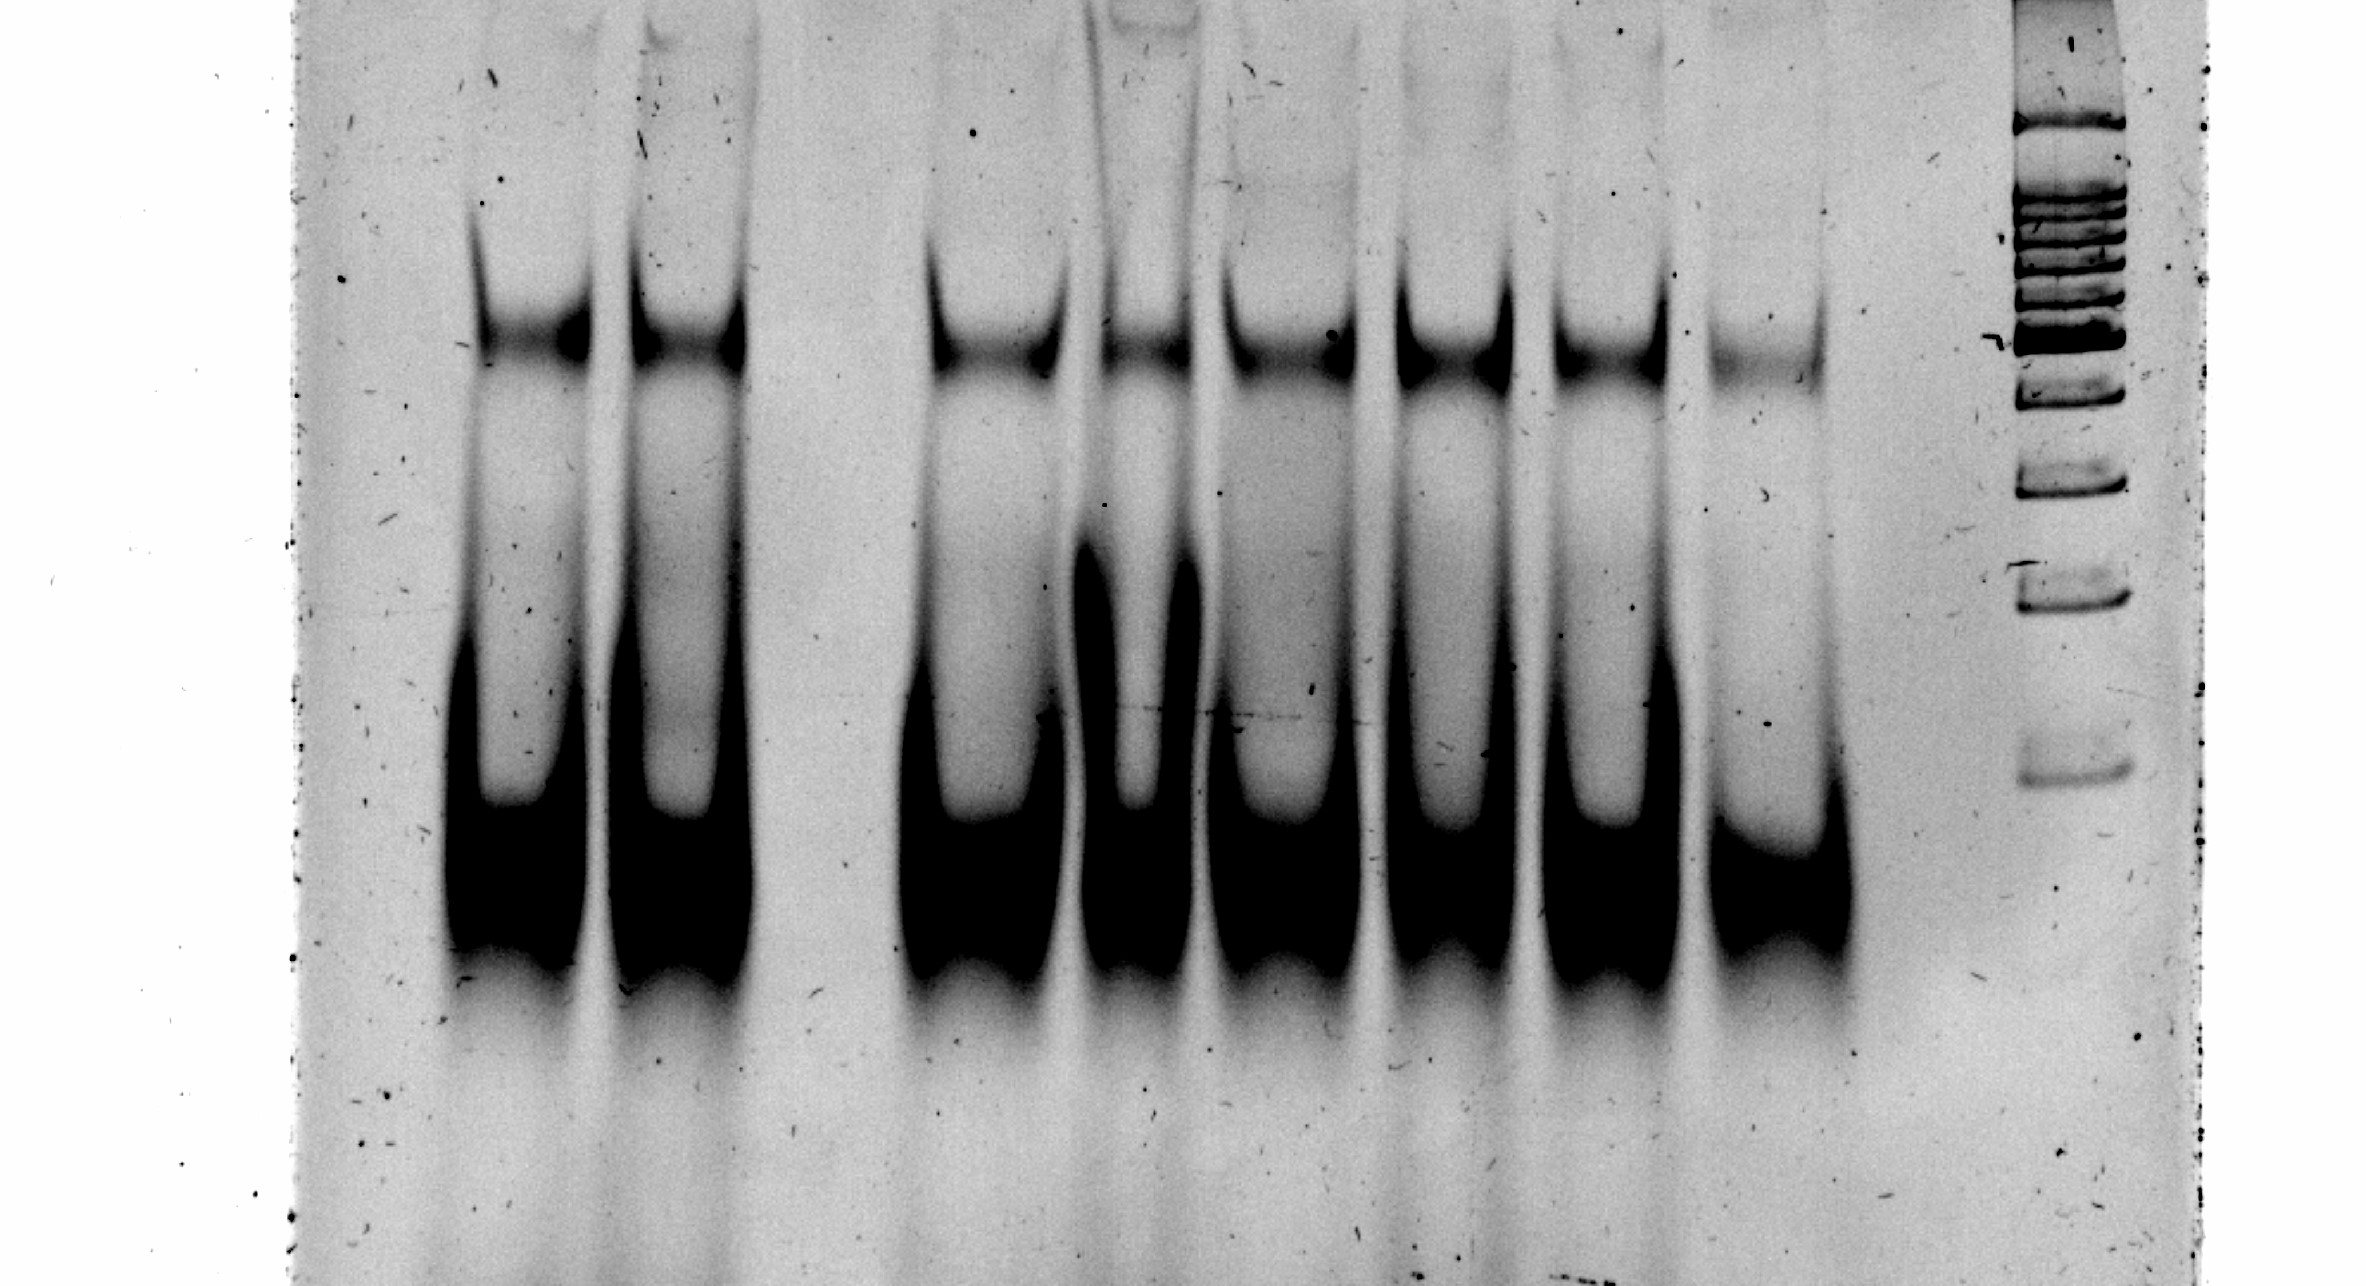
Asymmetric PCR optimisation using different primer ratios. Eqi, equimolar amounts of primers.
Polyacrylamide gel of an asymmetric PCR made from the first round of SELEX. This gel clearly showed the separation between the single stranded (lower band) and the double stranded (upper band) DNA.
Synthesis, cloning and expression of Eucalyptus grandis laccases
An example of two colonies on a replica plate that turned pink as a result of pSB1C3-mRFP1 contamination.
Constitution of the SP6 promoter from two self-annealing oligos.
Sequencing result of cloned SP6 promoter parts. Four of six clones sequenced produced chromatograms agreeing with the reference sequence.
Left: Negative control (pSB1C3-SP6); Right: SP6-mRFP1 in pSB1C3 vector. No clear mRFP1 pigementation was seen in the SP6-mRFP1 construct after 2h in vitro expression.
Characterisation of existing laccase parts
SDS-PAGE analysis of E. coli extracts. Approx. 50 ug of protein was loaded per well. Expression of that CAT control protein is indicated.
References
1. Development of a PSII-binding DNA aptamer (based on in silico prediction)
2. Development of a graphene-binding DNA aptamer (using SELEX)
3. Characterisation of novel laccase enzymes that might be used to reduce oxygen and hydrogen back to water on the cathode electrode of our PBEC.
4. Expression and characterisation of laccase enzymes that were previously submitted to the Registry.

We chose PSII rather than Photosystem I (PSI) as our system of choice as it only requires water for energy generation whereas PSI requires alternative co-factors. We then analysed one dimer of the PSII using Pymol and started off with B-factor analysis. B-factor refers to the displacement of atoms from their mean position in a crystal structure (Trueblood et al., 1996) . Using this analysis tool, we were able to determine which regions of the PSII complex are the most rigid and structurally stable and hence most suitable for aptamer-mediated targeting.
The result of the B-factor analysis revealed two proteins in the complex that were structurally more stable than the rest, namely CP47 and CP43. We decided to target the CP43 and CP47 subunits of the light-harvesting complex (LHC) of PSII to which the one side of the aptamers can bind. This protein is suitable as it is exposed and on the stromal side of the thylakoid membranes (which is important because electrons can more easily be abstracted on the stromal side). These proteins form the core subunits of the PSII complex and we determined them to be the most stable. We used PDF files from a recent crystal structure of the PSII complex (Wei et al., 2016) as the basis for aptamer design. iGEM team Heidelberg (2015) used their designed MAWS (Making Aptamers Without SELEX) software to design an aptamer sequence which has specifically bind to CP43 and CP47 subunits of PSII.
We then removed all non-target proteins and cofactors from the PSII PDB file using Pymol, so that we were left with CP43 and CP47 subunits alone. This file was then sent to Heidelberg 2015 iGEM team who used it as a template for aptamer targeting using their MAWS software. At first the PSII protein complex was too large for the program to compute a prediction, so we reduced the size of the PDB file to target only the stromal side of CP47. This was used as input for which was then ran through the MAWS software to test for the best aptamer oligo sequence. The predicted aptamer candidate had the sequence 5' TACGTTAT 3'.


Thylakoid extraction was carried out on store-bought spinach, using a protocol designed to extract and isolate intact chloroplasts from leaves, which we derived from Lang et al. (2011), Nagahashi et al. (1985), Rödiger et al. (2010) and Shiraya et al. (2014) as described below . The first protocol used involved grinding frozen tissue with a homogenizer in liquid nitrogen. A volume of 30ml of a “homogenization buffer” was added to 2 - 5 g of tissue, vortexed for 30 seconds and filtered through two layers of 100 µm nylon mesh, followed by two layers of 60 µm mesh. The filtrate was centrifuged at 200 x g for 4 minutes at 4°C, and the supernatant was then centrifuged for 10 minutes at 1500 x g at 4°C. The resulting pellet contained the chloroplasts. The pellet was gently resuspended in 3ml of “resuspension buffer”. Next the plastid suspension was slowly layered onto a discontinuous Percoll density gradient solution, containing equal volumes (9ml) of 85%, 40% and 10% Percoll solutions. The Percoll density gradient solution was then centrifuged at 5000 x g for 45 min at 4°C, after this centrifugation, intact chloroplasts were located on the interface of the 40/85 Percoll and the 10/40 interface contained broken chloroplasts and thylakoid membranes. Both fractions were gently transferred to separate falcon tubes, to which 3 volumes of “wash buffer” was added and then gently washed by centrifugation at 1500 x g for 10 min at 4°C (repeated once). The pellet was then resuspended in wash buffer and 50% glycerol solution for storage.
This method extracted extremely pure, intact chloroplasts, but in small yields. Because we only required thylakoid membranes, not intact chloroplasts, separation using a Percoll gradient was not necessary. Furthermore, the protocol used small volumes of material and therefore resulted in a small amount of product. We therefore simplified and scaled up the protocol for crude thylakoid extractions:
- A larger amount of material (5 - 10 g) was used
- Separation via the percoll density gradient was omitted
- The first crude pellet containing the chloroplasts and thylakoids was resuspended in the “wash buffer” and then sonicated to disrupt the chloroplast membrane and therefore increase the amount of free thylakoids in the solution.
The recipes of the buffers used may be seen in the tables below:


1. We synthesized the predicted PSII-binding aptamer (5' TACGTTAT 3') with an extra "foot" of random nucleic acids of 25-nt in length to give it a foothold to a nitrocellulose membrane. As a negative control, we synthesized a random oligo of the same length. (Reagents/materials used:
- Aptamers (N)25TACGTTAT: Stock (100uM) and working solution (10uM)
Random sequence as negative control
Nitrocellulose membrane
Thylakoids
Cherring testis DNA (1ul diluted in 20ml TBS)
TBS:
5% (m/v) non-fat milk in TBS
Procedure:
2. We made serial dilutions of the aptamers and negative control sequences from the 10 uM working solution: undiluted, 1/10, 1/100, 1/500, 1/1000.
3. The nitrocellulose membrane was cut to the desired size, marked and spotted with 3 ul of aptamer solution. As a positive control, the thylakoid extraction was spotted directly onto the membrane.
4. Non-specific sites were blocked by incubating it with the herring testis DNA for 30 min at 37°C followed by three wash steps with TBS (50 mM Tris-HCl pH 7.5, 150 mM NaCl).
5. The blot was further blocked with 5% m/v nonfat milk solution followed by washing three times with TBS.
6. The membrane was incubated in the thylakoid solution (diluted in TBS containing protease-inhibitor) on ice for 2 hours. It was then washed 3 times for 5 min with TBS at 4°C to remove any unbound thylakoids.
7. The blots were imaged with a Carl Zeiss LSM 5 confocal microscope, excitation wavelength 395 nm, to observe chlorophyll autofluorescence of the bound thylakoids.
Result: We were able to visualize thylakoids directly bound to the nitrocellulose membrane based on the autofluorescence of chlorophyll pigment in the photosystems. However, no significant binding of thylakoids was observed at regions of the membrane that were pre-spotted with the candidate PSII-binding aptamer.

We aimed to determine whether different DNA sequences bind with different affinities through Systematic Evolution of Ligands by EXponential enrichment (SELEX). For this process we started by incubating a whole lot of random oligonucleotides of the same length and with the same 5’ and 3’ ends, which serve as primer binding sites, with our graphene foam electrodes. The principle behind this is that during this incubation step many of the random oligos will bind to the graphene ranging from strong affinity to weak binding affinity, and many of the oligos won’t bind at all. The excess oligos that didn’t bind was removed. We then washed off the oligos that bound less strongly to the graphene with a low stringency buffer (10 mM Tris-HCl). At this point only strongly binding oligos will be present, which were then eluted from the graphene with warm 6M urea. The eluted DNA was then PCR amplified to create a new library. This same process was repeated twice each time with buffers of increasing stringency, namely Tris-HCl + 1% SDS and Tris-HCl + 1% SDS + 1% Tween respectively.
SELEX

Graphene wash steps
Determining how we would wash the graphene with the different buffers and capturing the DNA that was washed off after each wash and elution step proved to be quite the challenge. However we came up with an effective system to wash the graphene with the buffers. We first incubated the graphene with the aptamers, then we pulverized the graphene into syringe filter tips. We then sequentially passed through the different buffers and captured the eluent in separate eppendorf tubes.

PCR optimisation
PCR optimization:
Before starting with the SELEX procedure we had to determine what the PCR conditions were going to be. We needed to set up an asymmetric PCR to obtain single stranded DNA products. For the PCR optimization we mainly looked at two parameters: the number of cycles and primer ratios. The theory behind asymmetric PCR is that you add excessive amounts of one of the primers, as a result in the PCR cycle you will start off making double stranded DNA products. Eventually the limiting primer will run out and with one primer left, only single stranded DNA will be amplified from the double stranded template. The primer ratios we tested for include 1:1, 10:1, 15:1 and 20:1, the amount of cycles we tested included 30, 40, 50 and 70 cycles.

From this figure we found that the asymmetric PCR was successful. The green arrows indicate an equimolar concentration PCR. All the samples from the orange arrow onwards were obtained from asymmetric PCR reactions. Though not clear on the 3% agarose gel in most of the samples i.e. samples 4, 5, 6, 7, 9, 10, 11, 12 and 15 clearly had two bands of the expected size range. The top bands occur in the same location as the positive equimolar controls at the size of approximately 70 bp. The bottom band which is smaller than the double stranded product is clearly the single stranded product. Even though the two bands are of equal length the single stranded product is physically much smaller than the double stranded product and thus moves through the gel more readily. The single stranded product is also is more intense than that of the double stranded band which confirms that we got higher yield of the single stranded product. From this gel the optimal number of PCR cycles could not be determined.
Here, we chose a rapid cell-free expression system that makes use of the SP6 phage promoter and does not require a transcriptional terminator. We searched for Eucalyptus grandis homologs of LAC4 and LAC17, two Arabidopsis thaliana laccase proteins known to reduce phenolic compounds much like the laccases from Trametes versicolor traditionally used in PBECs (Berthet et al. 2011).
Using BLASTP, we identified a number of laccase homologs in the E. grandis genome hosted on Phytozome (phytozome.jgi.doe.gov/pz/portal.html). We used gene expression data from EucGenIE (www.eucgenie.org; Hefer et al. 2011) to prioritise four laccase candidates based on high expression, especially in developing wood where these proteins are required for the polymerisation of monolignol substrates into lignin.
Four laccase proteins from Eucalyptus grandis were synthesized:
Eucgr.A01282
Eucgr.F02641
Eucgr.B02797
Eucgr.G03098
Two of the laccases were cloned into pSB1C3 and submitted as new parts (see our parts page for more information).
Two of the laccases were cloned into pSB1C3 and submitted as new parts. We were forced to use digested and gel-purified pSB1C3-mRFP1 (BBa_J04450) from the distribution kit after the linearized backbone ran out for the remaining of our cloning reactions. This proved to be a poor choice, since self-annealing and/or non-linearized vector contamination became a major hindrance. No matter how well we gel-purified the digested pSB1C3-mRFP1 fragment, We frequently observed pink colonies that expressed the mRFP protein and these did not contain the laccase insert.

For expression, an SP6 promoter was added for Phage SP6 RNA Polymerase to transcribe and translate the genes in vitro by making use of an SP6 in vitro expression kit (Promega TNT SP6 Coupled Wheat Germ Extract System). The advantage of this is that expression is fast, easy and does not require a T7 transcription termination sequence.
Development of SP6 promoter as standard part
Two self-annealing oligos were synthesized to form a double-stranded SP6 promoter flanked by the RFC10 prefix and suffix sequences.
Oligo 1: 5’ CGCGAATTCGCGGCCGCTTCTAGAGATTTAGGTGACAC 3’
Oligo 2: 5’ CGCCTGCAGCGGCCGCTACTAGTACTATAGTGTCACCTAAA 3’
These oligos were allowed to anneal at room temperature and were then extended with Bsu DNA polymerase, large fragment (NEB) at 37°C for 30 min. The resulting fragment was digested with EcoRI and PstI, cloned into pSB1C3, sequenced and submitted as part BBa_K2037000.


To test the functionality of this promoter as a standard part with RFC10 prefix and suffix sequence, we appended it to the mRFP1 fragment (BBa_J04450) for in vitro expression. The TNT SP6 yeast extract expression kit (Promega) was used to attempt expression of mRFP1 under the regulation of the SP6 promoter. However, after a 2 hour incubation period there was no significant increase in fluorescence in the SP6-mRFP sample compared to the negative control (only SP6). This means that the SP6 promoter was not able to drive expression of mRFP in the in vitro expression kit, or such low levels of expression occurred that it is not possible to measure. We did not have a chance to sequence the construct to confirm its integrity.

Two existing laccases in the registry submitted by the 2012 Bielefeld-Germany team, BBa_K863010 (tthl) and BBa_K863020 (bhaI) from Thermo thermophilus and Bacillus halodurans respectively, have not yet been characterised. We aimed to express these proteins in Escherichia coli to study the laccase activity on synthetic substrates at different pH levels.
E. coli BL21Star cells were transformed with these parts, each of which contained a T7 promoter and termination sequence flanking the coding sequences. Expression was induced with 1 mM IPTG and protein expression was performed for 24h at 30°C, after which cells were harvested followed by sonication in protein extraction buffer (10 mM phosphate buffer pH 7, 150 mM NaCl, 5% glycerol, 10 mM beta-mercaptoethanol, 0.1 mM PMSF, 1X Roche complete protease inhibitors). A pET160-GW/CAT construct (Invitrogen) expressing the chloramphenicol acetyltransferase (CAT) protein was used as a positive control for induction. The soluble fraction was analyzed on a 12% SDS-PAGE gel followed by Coomassie staining.
We observed expression of the positive control CAT protein (~32 kDa), but no evidence of tthl (BBa_K863010) or bhal (BBa_K863020) expression:

Nevertheless, we assumed there would be some functional laccase present, and proceeded with decolorisation assays.
Decolorisation assay with bromophenol blue
We adapted a protocol by Foroontanfar et al. (2012) based on the decolorization of bromophenol blue. We first experimented with a standard solution of laccase purified from Trametes versicolor (Sigma) by incubating 200 ul bromophenol blue (0.05 mg/ml) in 0.1 M citrate buffer pH 4.5 containing 1.5 mM copper sulphate with various quantities of Trametes laccase.
Next, we assayed the crude soluble fraction of the tthl and bhal E. coli protein extracts for laccase activity at different pH levels. Trametes laccase was used as a positive control; as a negative control we used the induced CAT control protein fraction. The positive control, from Trametes, worked very well as a positive control, but only at low pH. Aside from that, there was no significant difference between the absorbance of the laccases and CAT.
Berthet, S., Demont-Caulet, N., Pollet, B., Bidzinski, P., Cézard, L., Bris, P.L., Borrega, N., Hervé, J., Blondet, E., Balzergue, S., Lapierre, C., Jouanin, L. (2011). Disruption of LACCASE4 and 17 results in tissue-specific alterations to lignification of Arabidopsis thaliana stems. The Plant Cell 23: 1124-1137
Foroontanfar, H., Moezzi, A., Aghiae-Khozani, M., Mahmoudjanlou, Y., Ameri, A., Niknejad, F., Faramarzi, A. (2012). Synthetic due colorization by three sources of fungal laccase. Iranian Journal of Environmental Health Sciences & Engineering 9:27.
Hefer, C., Mizrachi, E., Joubert, F., Myburg, A. (2011). The Eucalyptus genome integrative explorer (EucGenIE): a resource for Eucalyptus genomics and transcriptomics. BMC Proceedings 5: O49
Lang, E.G., Mueller, S.J., Hoernstein, S.N., Porankiewicz-Asplund, J., Vervliet-Scheebaum, M., Reski, R. (2011). Simultaneous isolation of pure and intact chloroplasts and mitochondria from moss as the basis for sub-cellular proteomics. Plant cell reports 30: 205-215.
Nagahashi, G., 1985. The marker concept in cell fractionation, In: Cell Components. Springer, pp. 66-84.
Rödiger, A., Baudisch, B., Klösgen, R.B. (2010). Simultaneous isolation of intact mitochondria and chloroplasts from a single pulping of plant tissue. Journal of plant physiology 167: 620-624.
Shiraya, T., Kaneko, K., Mitsui, T. (2014). Quantitative Proteomic Analysis of Intact Plastids. Plant Proteomics: Methods and Protocols 469-480.
Wei, X., Su, X., Cao, P., Liu, X., Chang, W., Li, M., Zhang, X., Liu, Z. (2016). Structure of spinach photosystem II-LHCII supercomplex at 3.2 Å resolution. Nature 534:69–74.
![]()