| Line 84: | Line 84: | ||
the concentrations were 1M to 0 M. In case of glycerol, the range was 90-0 %. The experimental set | the concentrations were 1M to 0 M. In case of glycerol, the range was 90-0 %. The experimental set | ||
up followed same principle as before. The results can be viewed below. | up followed same principle as before. The results can be viewed below. | ||
| + | |||
| + | |||
| + | {{UBonn_HBRS/image|url=//2016.igem.org/wiki/images/2/25/T--UBonn_HBRS--Enzyme_Assays_citrate_assay_glucose.png|alt=Citrate Assay Glucose|class=100|caption-class=with-caption|caption=<strong>Figure 3. Citrate Assay with Glucose.</strong> Citrate concentrations go from 1 M down to 0 M and were tested with glucose concentrations 1 to 0,0005 μg.}} | ||
| + | |||
| + | |||
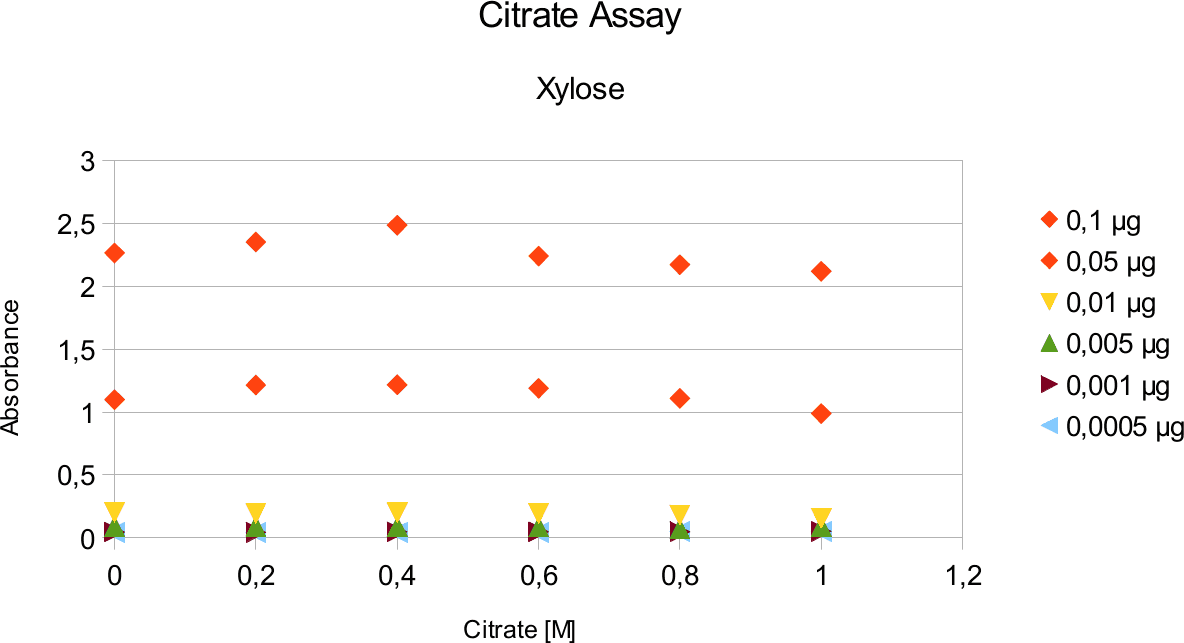
| + | {{UBonn_HBRS/image|url=//2016.igem.org/wiki/images/c/c7/T--UBonn_HBRS--Enzyme_Assays_citrate_assay_xylose.png|alt=Citrate Assay Xylose|class=100|caption-class=with-caption|caption=<strong>Figure 4. Citrate Assay with Xylose.</strong> Citrate buffer of 1 – 0 M tested with xylose concentrations of 0,1 μg to 0,005 μg.}} | ||
| + | |||
| + | The obtained results show that the absorbance measured at was nearly constant for both, citrate | ||
| + | buffer assays with very low fluctuation. | ||
| + | |||
| + | |||
| + | |||
{{UBonn_HBRS/footer}} | {{UBonn_HBRS/footer}} | ||
Revision as of 05:04, 19 October 2016
Enzyme Assays
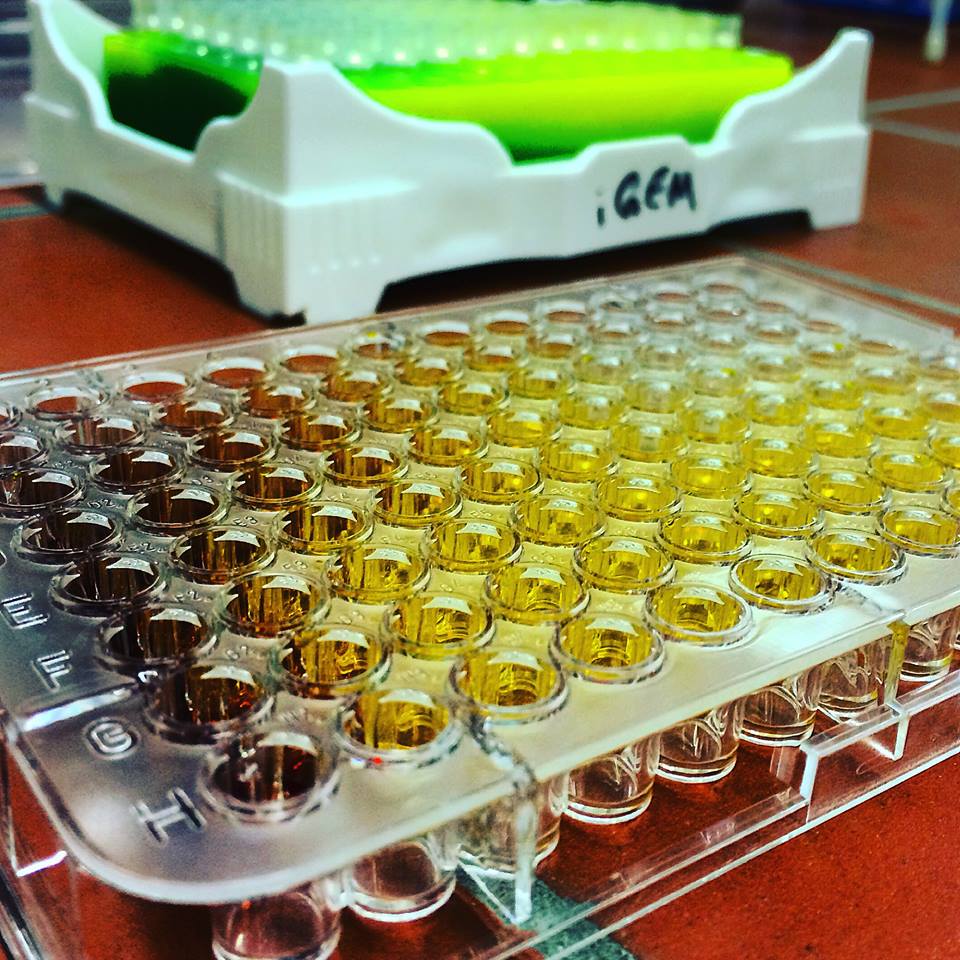
In order to guarantee the efficiency of our own secreted enzymes and find optimum environment in our project set up for the own enzymes and bought ones, a functional enzyme assay is necessary.
Contents
Introduction
The aim of the enzyme assays, is to determine the amount of enzymes present in the sample under certain conditions, making activity comparable between the samples and experiments. The activity is described by the product formed over the given time or how much substrate has been used up.
Different parameters affecting the activity of an enzymes are substrates and their concentration, pH, ionic strength, buffer type and temperature.
In our project, method of stopped colorimetric assays was used. This means that the assay was stopped after a fixed time with the use of temperature and the amount of product formed was measured. Colorimetric assay makes it possible to to quantify the product of interest with the use of spectrophotometer, by reacting it with another reagent. The measured absorbance is directly proportional to the product in the sample. In this experiment, 3,5-Dinitrosalicylic acid was used.
The enzymes tested were endoglucanase (endo-1,4-β-D-glucanase, Acidothermus cellulolyticus, Sigma-Aldrich) and xylanase (endo-1,4-β-Xylanase M4, Aspergillus niger, Megazyme). First enzyme belongs to cellalases and breaks down cellulose molecule by hydrolysis of the 1,4-beta-D- glycosidic linkages into monosaccahrides such as beta-glucose. Xylanase breaks down hemicellulose by degrading polysaccahride beta-1,4-xylan (Beechwood) into xylose.
Experimental Set Up an Validation
The tests done always follow similar recipe (see protocol) that containing sugar or enzyme solution, citrate buffer, water, substrate and DNS. Buffers are needed to adjust and stabilize the pH for enzyme assays. The concentration that works for our chosen enzymes is 50mM. Substrate used for endoglucanase was Carboxymethyl cellulose (CMC) which is a cellulose derivative that the enzyme is able to cleave. Initially for the standard calibrations 1:3 CMC was used but in order to increase the availability of the substrate, the assays with enzymes had CMC 3:7. Substrate for xylanase was 1% xylan, also known as beechwood. DNS is aromatic compound that reacts with reducing sugars to form 3-amino-5-nitrosalicylic acid-

This absorbs light at 540 nm creating a possibility to quantify the product present in the sample.
Additionally, absorbance at 750 nm was measured in order to subtract the background absorbance
for normalization.
Additional water served purpose for having room to change different part of the recipe while still
keeping constant volume.
Analysis of the data was done with Open Office Calc.
Standard Calibration
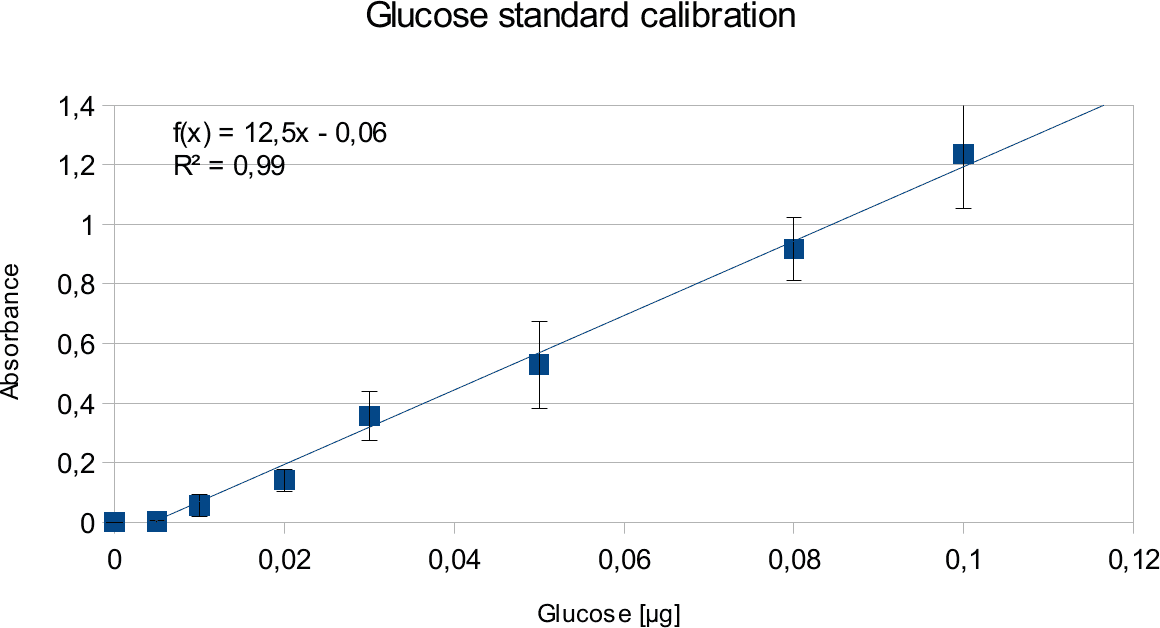
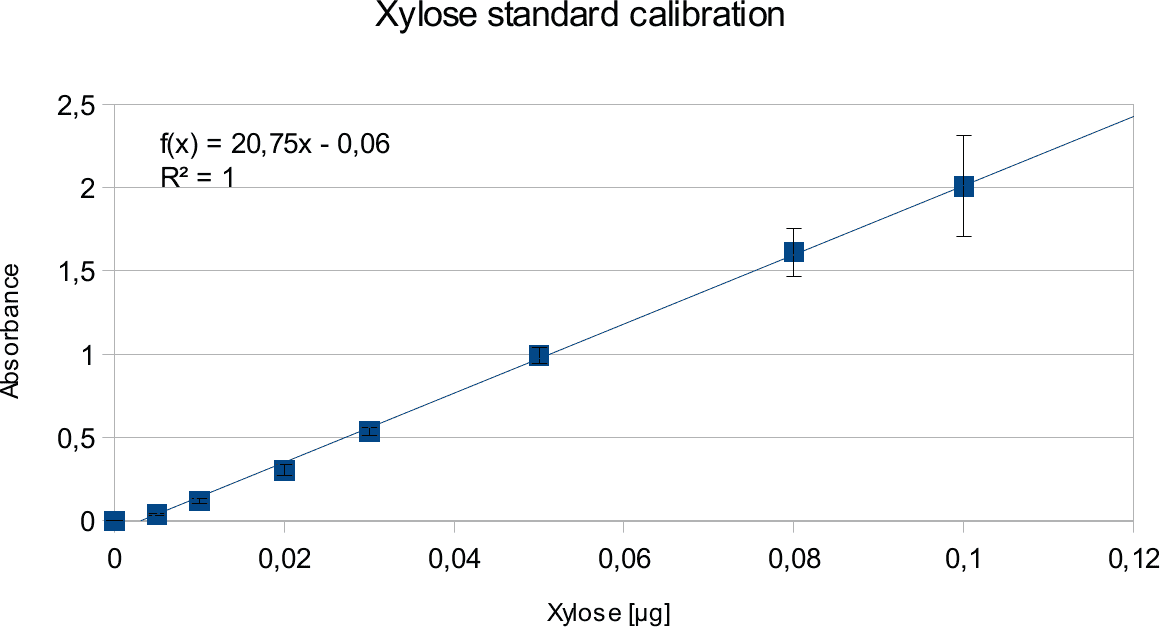
In order to determine the concentration of the substance of interest, standard calibration of the sample with known concentrations is necessary. Xylose was used for xylanase and glucose for endoglucanase.
Initially, a wide range of sugar concentration was tested which was 100 mg/ml to 0,001 mg/ml.
Through several experiments, a linear working range was determined to be 10 mg/ml to 0,5 mg/ml
(0,1to 0,005 μg in total in the sample)
Experiments creating a linear standard calibration lead to following results.
Discussion
The final results show linear range as expected and needed in order to validate the complete assay. Deviations increase with increasing concentration as smaller mistakes have then more effect. However, both xylose and glucose yielded usable results that aided in determination of the unit range, that should be used in experiments with enzymes.
Citrate and Glycerol Tests
In order to validate that the read out is not falsified by the variables in the test tube, a series of experiments were done. This entailed doing experiments with citrate buffer and glycerol. Buffer is needed to to create pH optimum and glycerol is enzyme stabilizing agent. Different concentrations of citrate buffer, glycerol and sugars were used.
A range of sugar concentrations of 0,1 μg to 0,0005 μg of total amount of sugar in sample was chosen for both experiments with exception of glucose citrate assay. The reason for higher high end glucose concentration, is due the fact that, results above 0,1 μg went over the measurable absorbance for other experiments and data point could not have been included. For citrate buffer, the concentrations were 1M to 0 M. In case of glycerol, the range was 90-0 %. The experimental set up followed same principle as before. The results can be viewed below.
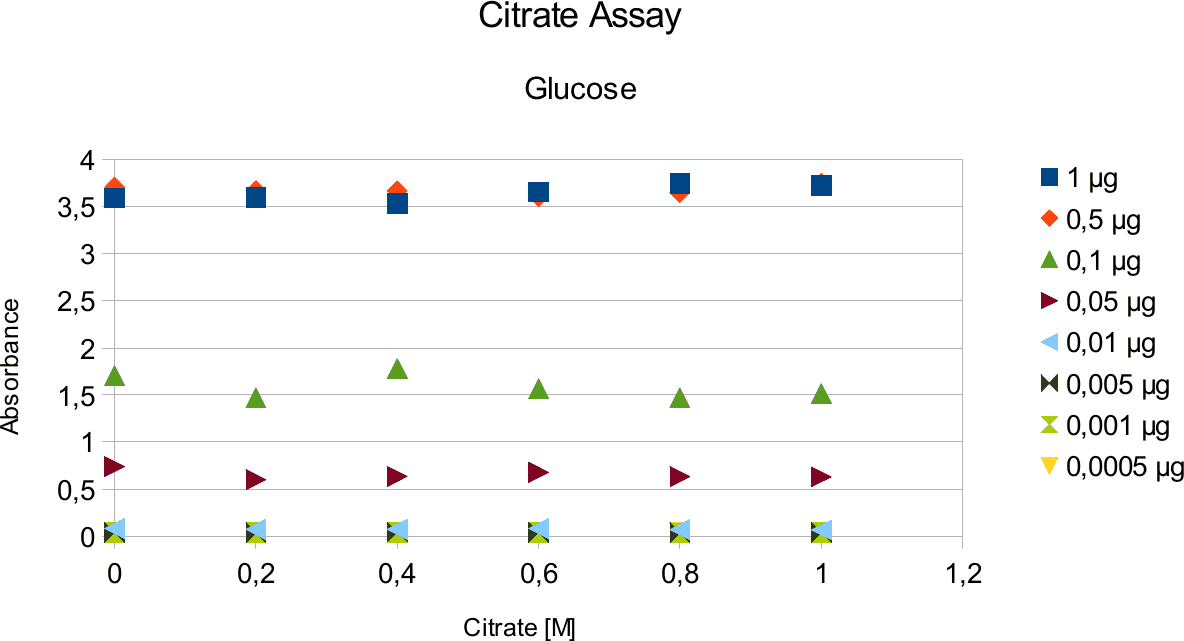
The obtained results show that the absorbance measured at was nearly constant for both, citrate buffer assays with very low fluctuation.


