Difference between revisions of "Team:UBonn HBRS/Description/Enzyme Assays"
| Line 143: | Line 143: | ||
done in parallel to the enzyme assay. | done in parallel to the enzyme assay. | ||
| + | |||
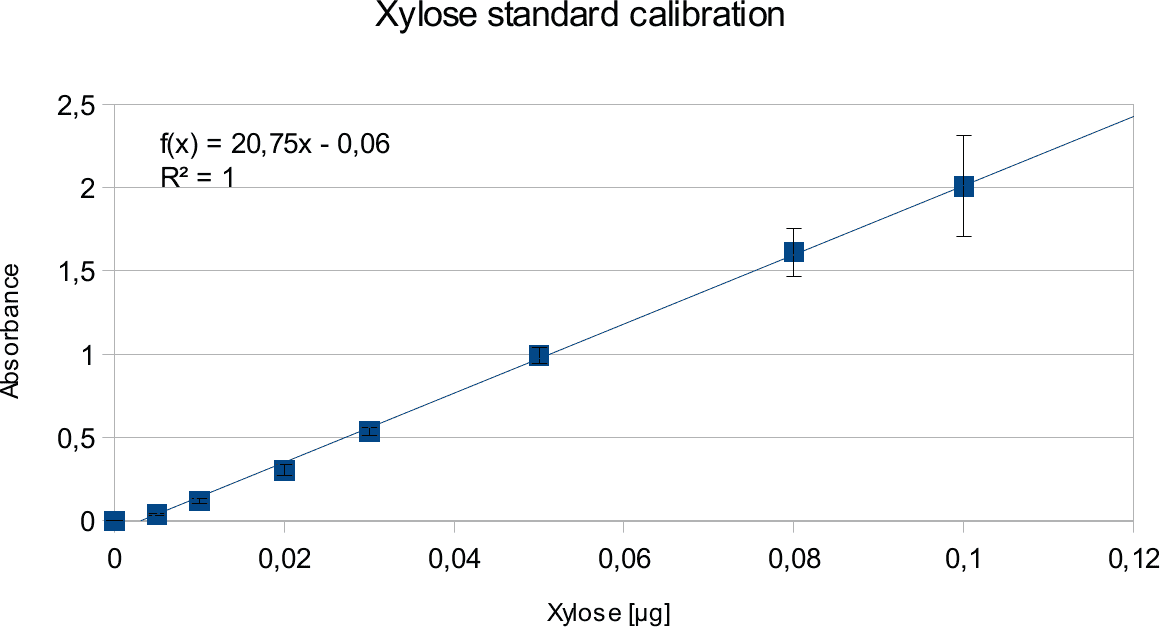
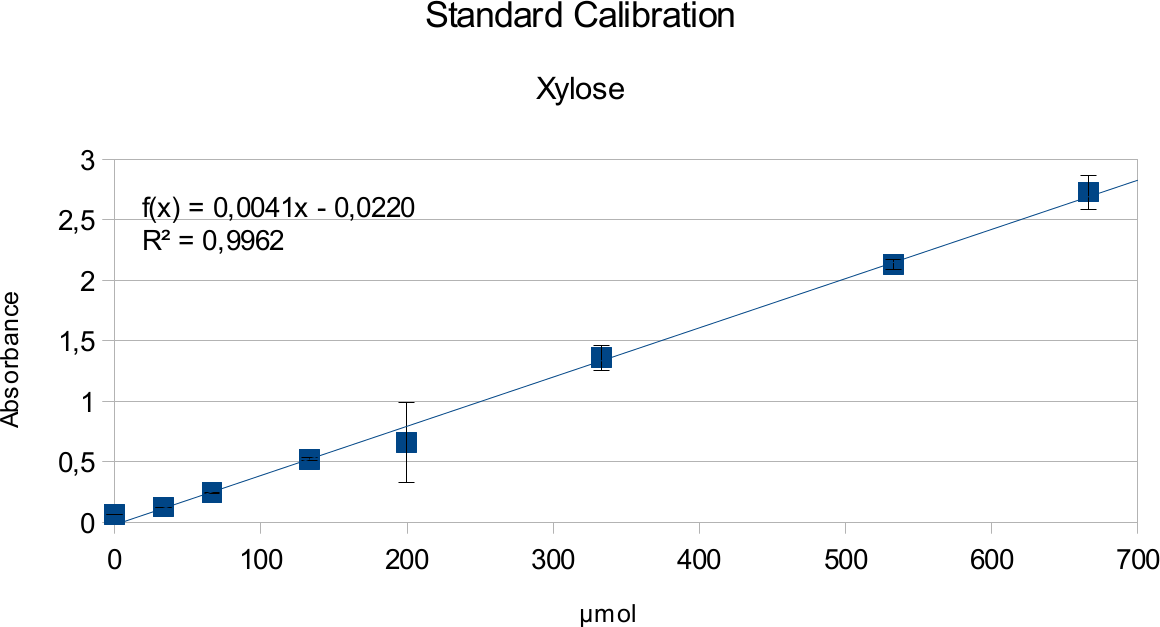
| + | {{UBonn_HBRS/image|url=//2016.igem.org/wiki/images/d/d2/T--UBonn_HBRS--Enzyme_Assays_xylose_calibration2.png|alt=Xylose Calibration |class=100|caption-class=with-caption|caption=<strong>Figure 9. Standard calibration of the Xylose for Xylanase Assay.</strong> Absorbance results are plotted against sugar concentration in μmol.}} | ||
| + | |||
| + | |||
| + | {{UBonn_HBRS/image|url=//2016.igem.org/wiki/images/c/ce/T--UBonn_HBRS--Enzyme_Assays_xylanase_assay.png|alt=Xylanase Assay|class=100|caption-class=with-caption|caption=<strong>Figure 10. Xylanase Assay.</strong> Absorbance in reference to the enzyme units used in the sample.}} | ||
| + | |||
| + | |||
| + | Both graph show very linear trend line with low deviations. Highest amount of units used was 0,1 | ||
| + | U which produced absorbance around 0,75. | ||
| + | |||
| + | |||
| + | ==== Discussion ==== | ||
| + | The experiments done with the enzymes gave analysable results. The proper linear | ||
| + | trend line of standard calibration shows that the the samples were treated properly | ||
| + | and acted as in experiments done before. | ||
| + | |||
| + | Endoglucanase assays show large deviations but give a linear trend line. Deviations | ||
| + | source is mainly the properties of solutions used in the experiment and reasons that | ||
| + | will be discussed in next sub-chapter. | ||
| + | |||
| + | The enzyme assay gives lower absorbance results which is likely due to the properties | ||
| + | of the enzyme and substrate. Endoglucanase has lower activity to begin with in | ||
| + | comparison to Xylanase. It could also be that the amount of substrate present was not | ||
| + | enough to show full activity. However, tests were done in different CMC | ||
| + | concentrations to find the point where the trend line becomes saturated. | ||
| + | |||
| + | In case of xylanase, the results show a expected linear patter and deviations are low. | ||
| + | This can be contrasted to viscosity of substrate for endoglucanase. Xylan is much | ||
| + | more easy to pipet, not leading to as many differences that could come from residual | ||
| + | liquids. It also shows higher activity based on information provided my manufacturer. | ||
| + | |||
| + | All in all, the experiments were successful but improvable. | ||
| + | |||
| + | |||
| + | ==== Troubleshooting and Missing Parts ==== | ||
| + | Like in every experiment, errors could have been made. In these experiments, | ||
| + | probable sources of errors come from human errors, pipetting, time differences in | ||
| + | preparations of the samples, uncontrolled temperatures, durability of enzymes and | ||
| + | viscosity of solutions. Measures must be taken where possible, in order to decrease | ||
| + | the amount of deviations. | ||
| + | |||
| + | Unfortunately, not all aims were fulfilled due to various factors. Biggest loss here was | ||
| + | not getting the own secreted enzymes in time to be able to test them and compare | ||
| + | them with commercial ones. However, everything missing is due to reason that will | ||
| + | not be discussed here. | ||
| + | |||
| + | |||
| + | ==== Protocols ==== | ||
{{UBonn_HBRS/footer}} | {{UBonn_HBRS/footer}} | ||
Revision as of 05:26, 19 October 2016
![]()
Enzyme Assays
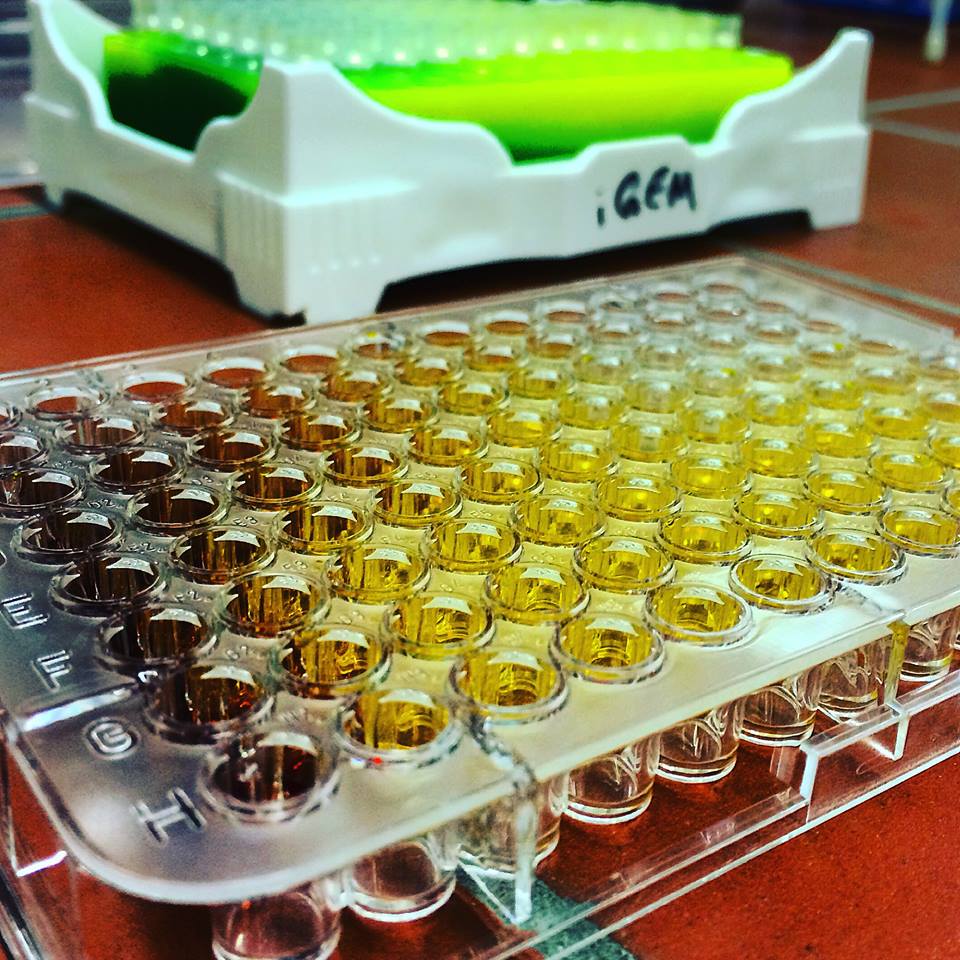
In order to guarantee the efficiency of our own secreted enzymes and find optimum environment in our project set up for the own enzymes and bought ones, a functional enzyme assay is necessary.
Contents
Introduction
The aim of the enzyme assays, is to determine the amount of enzymes present in the sample under certain conditions, making activity comparable between the samples and experiments. The activity is described by the product formed over the given time or how much substrate has been used up.
Different parameters affecting the activity of an enzymes are substrates and their concentration, pH, ionic strength, buffer type and temperature.
In our project, method of stopped colorimetric assays was used. This means that the assay was stopped after a fixed time with the use of temperature and the amount of product formed was measured. Colorimetric assay makes it possible to to quantify the product of interest with the use of spectrophotometer, by reacting it with another reagent. The measured absorbance is directly proportional to the product in the sample. In this experiment, 3,5-Dinitrosalicylic acid was used.
The enzymes tested were endoglucanase (endo-1,4-β-D-glucanase, Acidothermus cellulolyticus, Sigma-Aldrich) and xylanase (endo-1,4-β-Xylanase M4, Aspergillus niger, Megazyme). First enzyme belongs to cellalases and breaks down cellulose molecule by hydrolysis of the 1,4-beta-D- glycosidic linkages into monosaccahrides such as beta-glucose. Xylanase breaks down hemicellulose by degrading polysaccahride beta-1,4-xylan (Beechwood) into xylose.
Experimental Set Up an Validation
The tests done always follow similar recipe (see protocol) that containing sugar or enzyme solution, citrate buffer, water, substrate and DNS. Buffers are needed to adjust and stabilize the pH for enzyme assays. The concentration that works for our chosen enzymes is 50mM. Substrate used for endoglucanase was Carboxymethyl cellulose (CMC) which is a cellulose derivative that the enzyme is able to cleave. Initially for the standard calibrations 1:3 CMC was used but in order to increase the availability of the substrate, the assays with enzymes had CMC 3:7. Substrate for xylanase was 1% xylan, also known as beechwood. DNS is aromatic compound that reacts with reducing sugars to form 3-amino-5-nitrosalicylic acid-
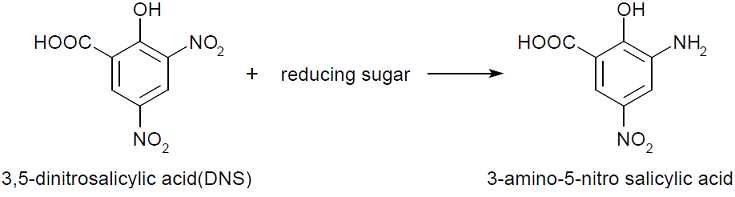
This absorbs light at 540 nm creating a possibility to quantify the product present in the sample.
Additionally, absorbance at 750 nm was measured in order to subtract the background absorbance
for normalization.
Additional water served purpose for having room to change different part of the recipe while still
keeping constant volume.
Analysis of the data was done with Open Office Calc.
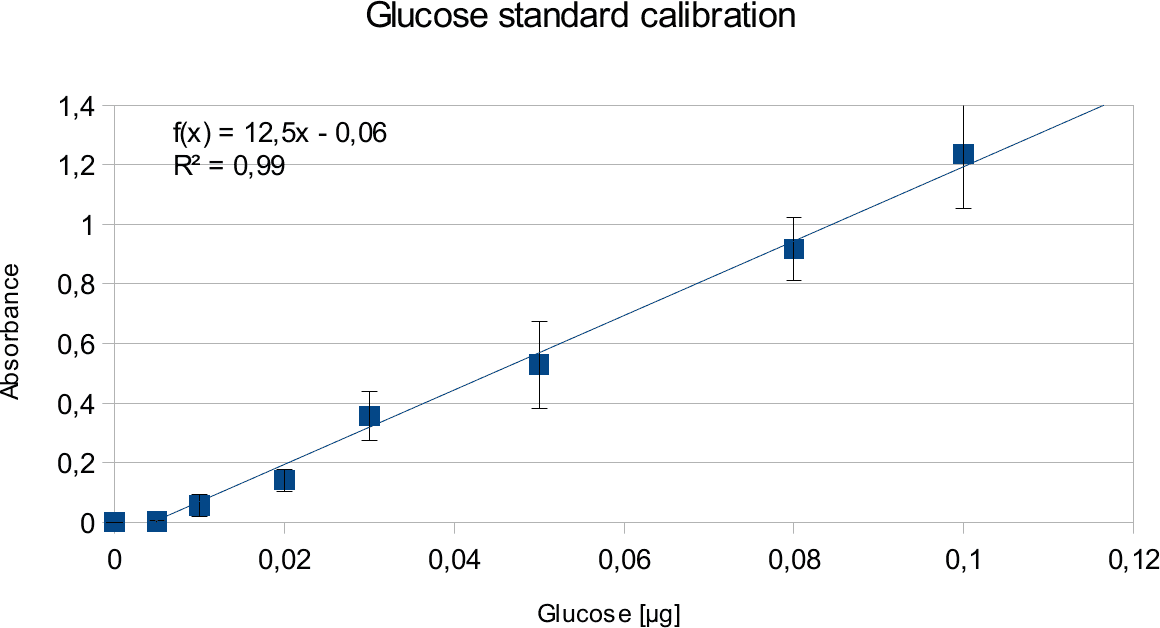
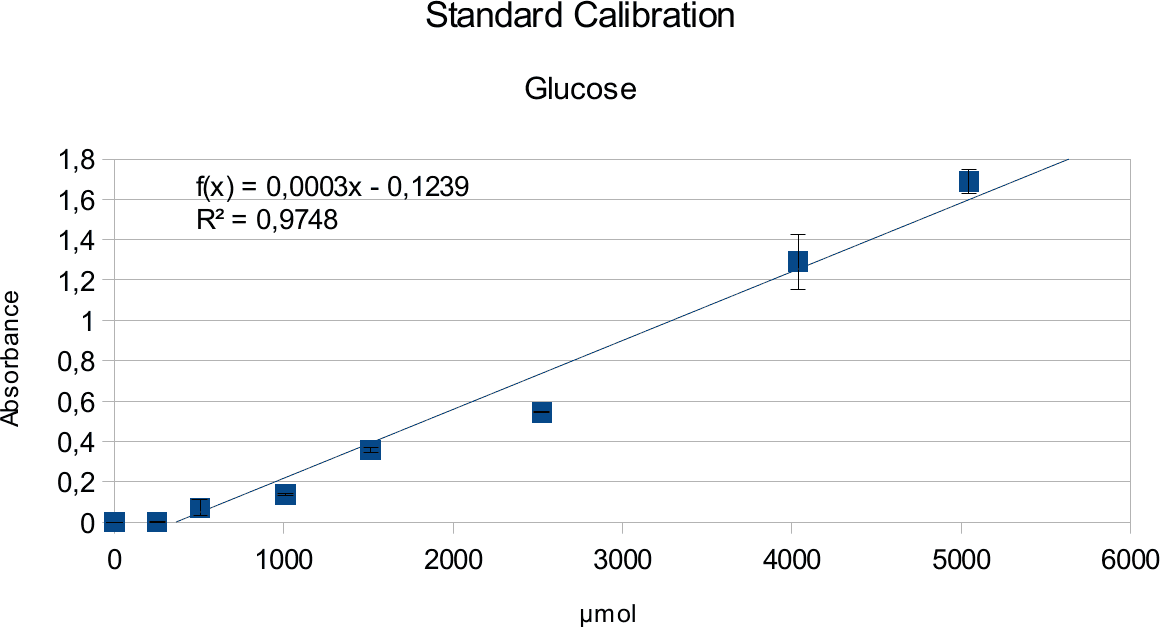
Standard Calibration
In order to determine the concentration of the substance of interest, standard calibration of the sample with known concentrations is necessary. Xylose was used for xylanase and glucose for endoglucanase.
Initially, a wide range of sugar concentration was tested which was 100 mg/ml to 0,001 mg/ml.
Through several experiments, a linear working range was determined to be 10 mg/ml to 0,5 mg/ml
(0,1to 0,005 μg in total in the sample)
Experiments creating a linear standard calibration lead to following results.
Discussion
The final results show linear range as expected and needed in order to validate the complete assay. Deviations increase with increasing concentration as smaller mistakes have then more effect. However, both xylose and glucose yielded usable results that aided in determination of the unit range, that should be used in experiments with enzymes.
Citrate and Glycerol Tests
In order to validate that the read out is not falsified by the variables in the test tube, a series of experiments were done. This entailed doing experiments with citrate buffer and glycerol. Buffer is needed to to create pH optimum and glycerol is enzyme stabilizing agent. Different concentrations of citrate buffer, glycerol and sugars were used.
A range of sugar concentrations of 0,1 μg to 0,0005 μg of total amount of sugar in sample was chosen for both experiments with exception of glucose citrate assay. The reason for higher high end glucose concentration, is due the fact that, results above 0,1 μg went over the measurable absorbance for other experiments and data point could not have been included. For citrate buffer, the concentrations were 1M to 0 M. In case of glycerol, the range was 90-0 %. The experimental set up followed same principle as before. The results can be viewed below.
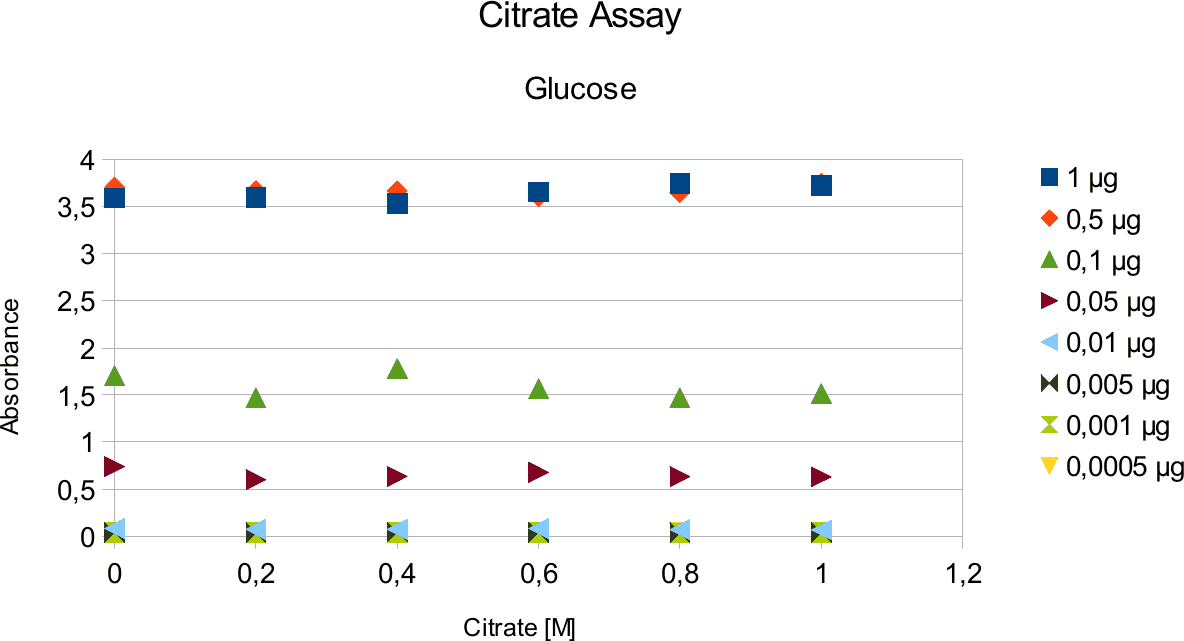
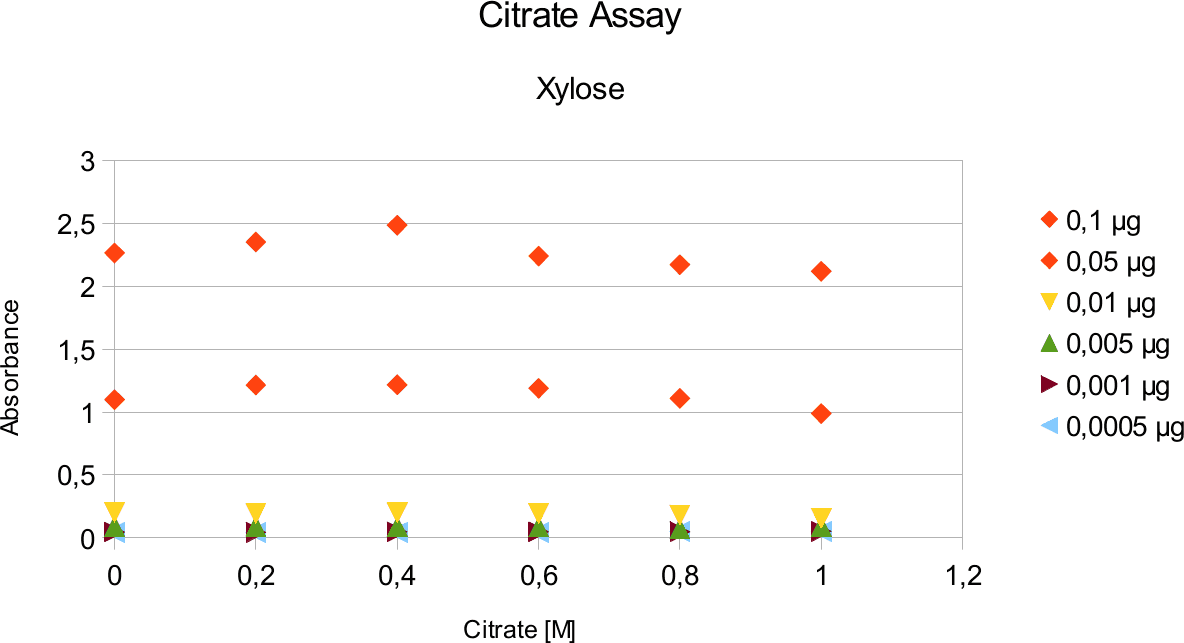
The obtained results show that the absorbance measured at was nearly constant for both, citrate
buffer assays with very low fluctuation.
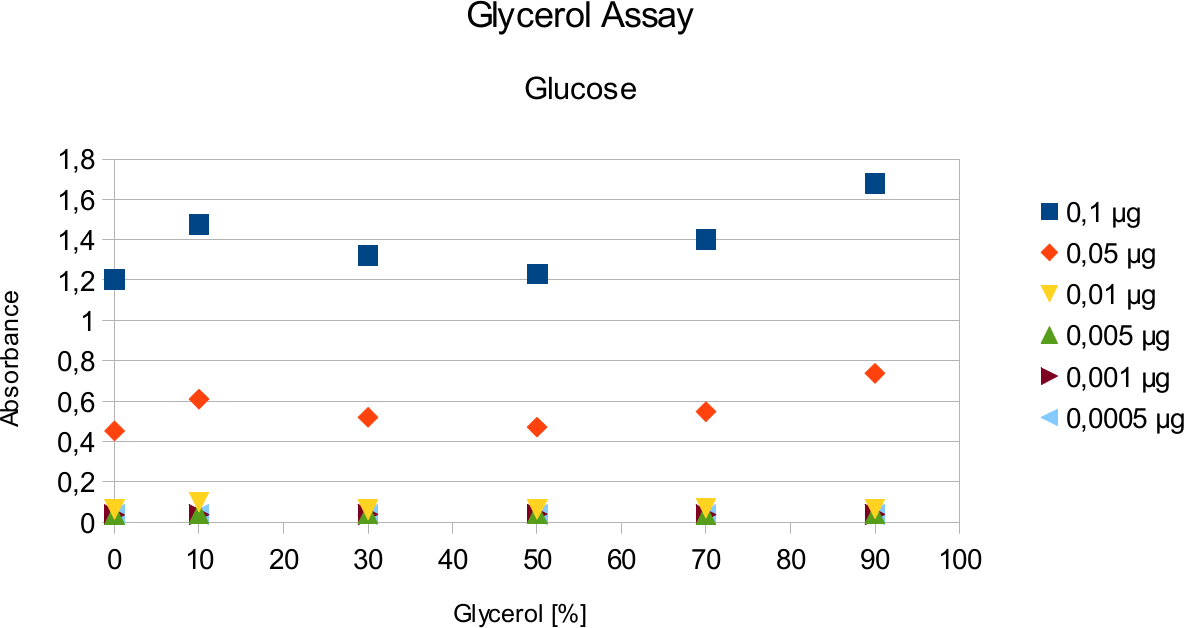
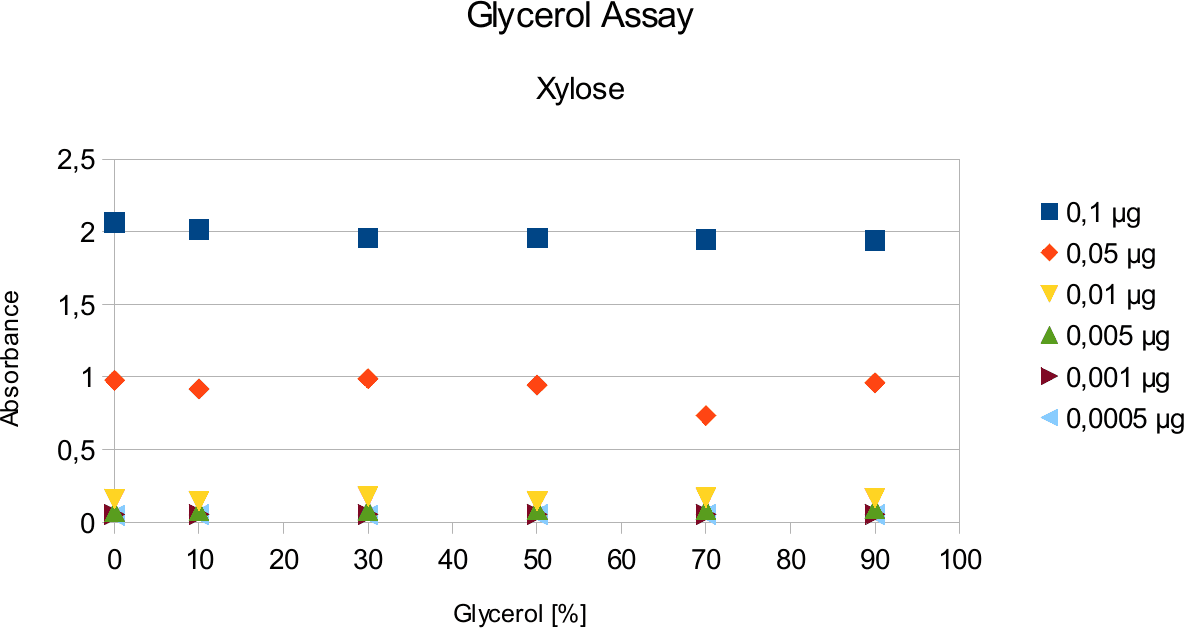
The results are similar to the ones from citrate. Here once again the absorbance values stay near
constant through all measurements.
Discussion
Citrate and glycerol result showed both similar pattern. There was some fluctuation between the samples, however, this can be taken as an error. Glycerol is rather viscous and therefore, difficult to pipette. Furthermore, sources of mistakes must be considered such as errors from pipetting. All in all, it can be concluded that citrate and glycerol have no effect in the experiments done.
Enzyme Assays
The assays done with xylanase and endoglucanase followed similar principle to the previous experiments. Precautions were taken to keep samples on cooler rack while preparing enzyme samples, in order to preserve the enzyme activity.
Endoglucanase Assays
Endoglucanase assays are made difficult by the substrate viscosity. This is the main source of deviations in these assays. Standard calibration was done in parallel to the enzyme experiments.
The results of the endoglucanase assays are illustrated on the upcoming graphs.
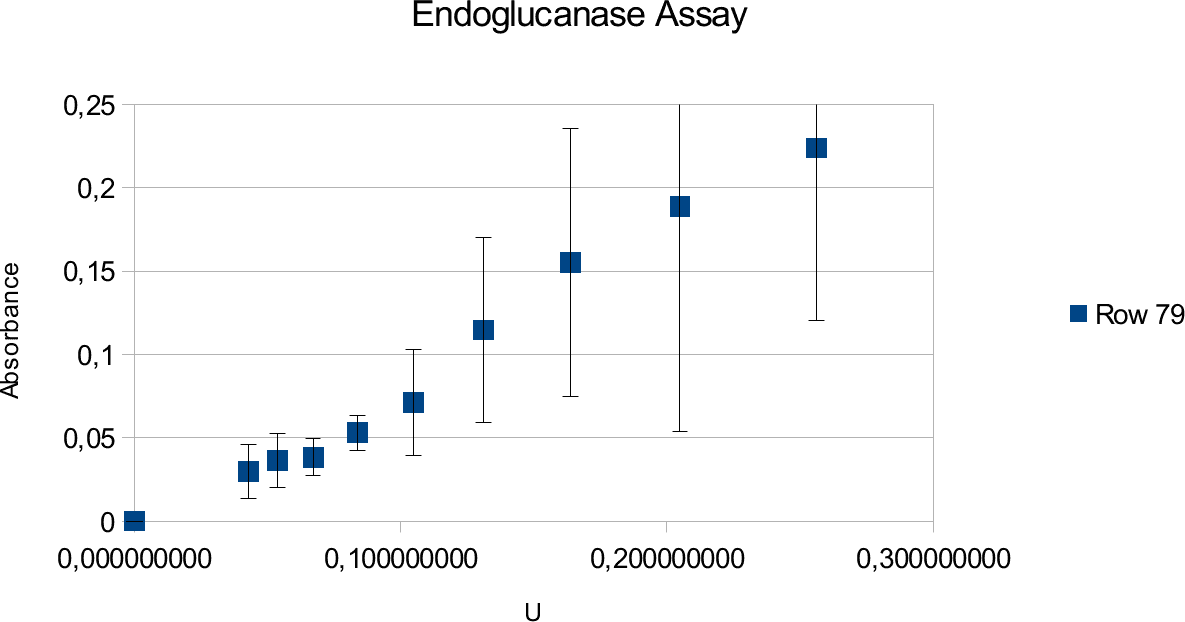
The graphs show linear ranges but error bars can be considered big. This is especially true for the
enzyme experiment. Units used went up to 0,25 U and absorbance maxima was 0,225. Going over
the amount of enzymes produced saturated curve. Lower values also showed results that can not be
take into account, as they showed random results opposed to constant increase with increasing
concentrations.
Xylanase Assay
Xylanase assays were successful and the results can be seen on the graphs below. Standards were done in parallel to the enzyme assay.
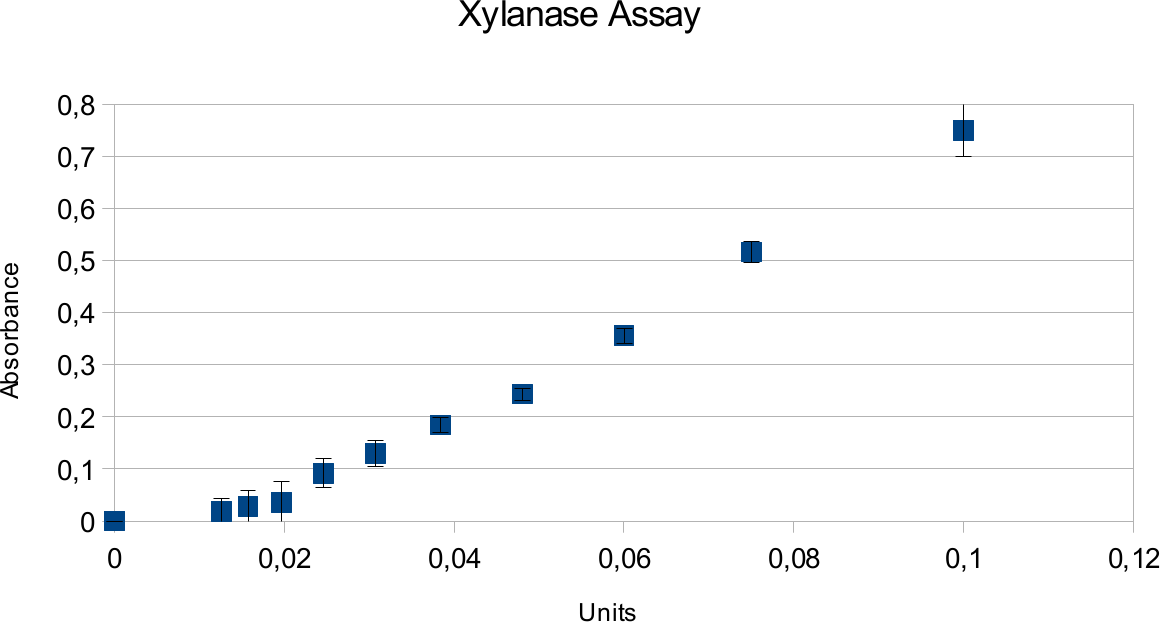
Both graph show very linear trend line with low deviations. Highest amount of units used was 0,1
U which produced absorbance around 0,75.
Discussion
The experiments done with the enzymes gave analysable results. The proper linear trend line of standard calibration shows that the the samples were treated properly and acted as in experiments done before.
Endoglucanase assays show large deviations but give a linear trend line. Deviations source is mainly the properties of solutions used in the experiment and reasons that will be discussed in next sub-chapter.
The enzyme assay gives lower absorbance results which is likely due to the properties of the enzyme and substrate. Endoglucanase has lower activity to begin with in comparison to Xylanase. It could also be that the amount of substrate present was not enough to show full activity. However, tests were done in different CMC concentrations to find the point where the trend line becomes saturated.
In case of xylanase, the results show a expected linear patter and deviations are low. This can be contrasted to viscosity of substrate for endoglucanase. Xylan is much more easy to pipet, not leading to as many differences that could come from residual liquids. It also shows higher activity based on information provided my manufacturer.
All in all, the experiments were successful but improvable.
Troubleshooting and Missing Parts
Like in every experiment, errors could have been made. In these experiments, probable sources of errors come from human errors, pipetting, time differences in preparations of the samples, uncontrolled temperatures, durability of enzymes and viscosity of solutions. Measures must be taken where possible, in order to decrease the amount of deviations.
Unfortunately, not all aims were fulfilled due to various factors. Biggest loss here was not getting the own secreted enzymes in time to be able to test them and compare them with commercial ones. However, everything missing is due to reason that will not be discussed here.
Protocols