Contents
Exeter and Glasgow iGEM 2016 Collaboration: KillerRed and KillerOrange Promoter Efficiency Experiment
Our collaboration with Exeter iGEM team started when we met them at the UK meet-up organised by Westminster iGEM team. It stemmed from our issues with cloning the parts for our SIM (self-inactivation mechanism) device, in particular the toxin part of the toxin-antitoxin system, so they agreed to help us by sending us one of their kill switches to use in our system. In return, we agreed to test the efficiency of the lac-repressible (and therefore IPTG-inducible) promoter they were using to expression two phototoxic fluorescent proteins, called KillerRed and KillerOrange.
Methods
First, we transformed the plasmids for testing promoter efficiency into the E. coli strain DH5α.Z1:
- BBa_J04450 (RFP with a lac-repressible promoter) in pSB1C3
- lac-repressible promoter + KillerRed in pSB1C3
- lac-repressible promoter + KillerOrange in pSB1C3
Next, we set up 5ml LB broth cultures in boiling tubes with 25μg/ml chloramphenicol for the strains with plasmids, and incubated at 37°C (shaking at 225rpm) overnight. For each of the following we set up two cultures, one with 1mM IPTG and one without:
- DH5α, no plasmid
- DH5α, J04450-pSB1C3
- DH5α, KillerRed-pSB1C3
- DH5α, KillerOrange-pSB1C3
- DH5α.Z1, no plasmid
- DH5α.Z1, J04450-pSB1C3
- DH5α.Z1, KillerRed-pSB1C3
- DH5α.Z1, KillerOrange-pSB1C3
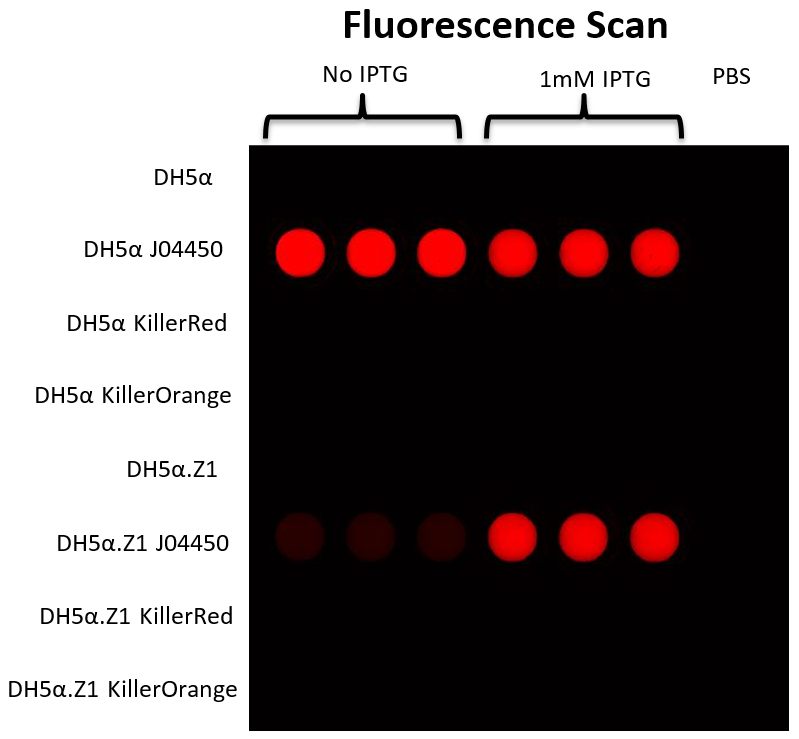
The next day, we spun down 500μl of each culture, resuspended in 1ml PBS buffer, and took OD600 measurements to calculate the relative cell density of each culture. For the fluorescence measurements, we used a Typhoon FLA 9500 with the samples in a 96-well plate. Each of the 16 samples were pipetted into 3 wells with 300μl each. The settings on the Typhoon were: 1) excitation laser at 532nm and emission filter above 575nm and 2) excitation laser at 473nm and emission filter above 575nm. Both were across the whole 96-well plate, but the second lower excitation wavelength was included in case the first was too high to excite the KillerOrange protein.
Results
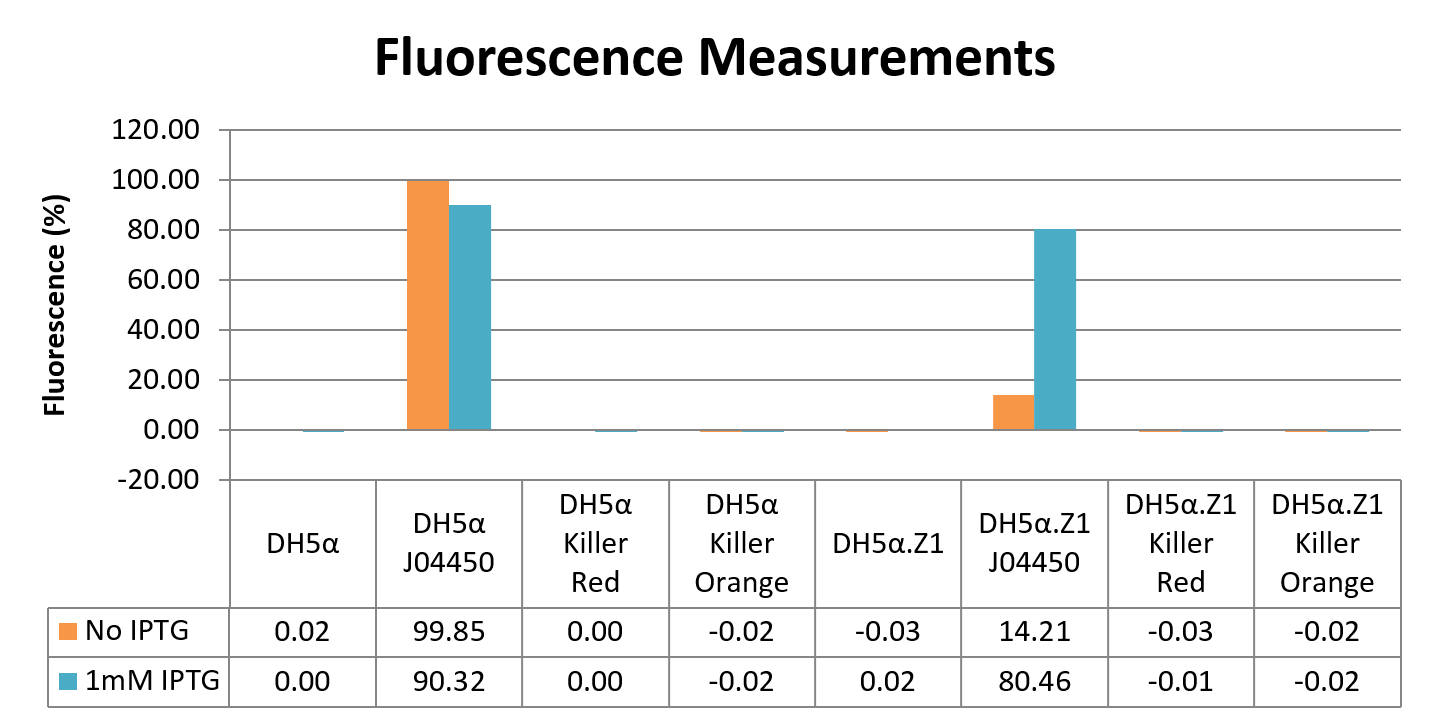
For each of the wells, a fluorescence value in arbitrary units (au) was calculated using ImageQuant software, where we set the 3 wells of PBS only blanks as 0% fluorescence, and the well with the highest value as 100% to convert au into percentage. Next, we normalised for any natural fluorescence in the cells by subtracting the average of the “cells only” wells (DH5α, and DH5α.Z1, both with and without IPTG) from all wells, and then corrected for the difference in cell density between samples by dividing the normalised fluorescence measurements by the OD600 values. For each sample, the average across the 3 wells was plotted on a graph:
These data indicate that there is no difference in fluorescence between either KillerRed or KillerOrange and the cells only control either with or without induction with IPTG. There could be several reasons for this, including the light was not intense enough to excite the fluorescent proteins, however no fluorescence from this type of the test with a laser for excitation would be unlikely. It is also possible that no protein is being produced, which could be due to insufficient IPTG. However, the RFP in BBa_J04450 under the control of the lac-repressible promoter BBa_R0010 clearly shows that in the DH5α.Z1 strain, there is less fluorescence without IPTG, than with IPTG. While this does show that 1mM IPTG is sufficient to induce the BBa_R0010 promoter, this is not a perfect control for the concentration of IPTG used unless KillerRed and KillerOrange also have this promoter. In the DH5α strain, there is not much difference between RFP fluorescence with or without IPTG – this is due to DH5α not having a functional copy of LacI, the lac repressor, therefore lac-repressible promoters are not “OFF”, so cannot be switched “ON” by IPTG induction.
Sequencing
Other reasons there may not be any KillerRed or KillerOrange protein produced, are mutations in the promoter. This was something we encountered when attempting to clone a promoter in front of the toxin from the toxin-antitoxin system we were working with. If a protein is toxic to produce, any cell which is producing less or no protein will grow faster than a cell which is producing the toxic protein. This means a mutated, non-functional promoter will have a proliferative advantage during transformation. So, as we were sending our BioBricks for sequencing before submission to the iGEM registry, we decided to sequence the minipreps of KillerRed and KillerOrange as well with the registry standard pSB1C3 sequencing primer VF2, to check for any mutations. Both plasmids had the BioBrick prefix, and the correct sequence for both KillerRed and KillerOrange open reading frame. The sequence between the prefix and the ATG start codon, we checked against lac-repressible promoters in the iGEM registry. We found a match to BBa_R0184, which is a T7 lac-repressible promoter. T7 promoters require T7 polymerase to be transcribed, as they are not recognised by E. coli polymerases. This results confirms the result of the fluorescence measurements. No KillerRed or KillerOrange fluorescence was observed, as neither gene was being transcribed by either DH5α or DH5α.Z1 as neither strain produces the required T7 polymerase. A protein overexpression E. coli strain such as BL21<DE3> which has the T7 polymerase gene inserted into its genome is designed to use T7 promoters would have been able to express these KillerRed and KillerOrange constructs.


