Difference between revisions of "Team:British Columbia/Model"
| Line 84: | Line 84: | ||
<img src="https://static.igem.org/mediawiki/2016/a/a8/British_Columbia_Modeling_Equation_2.png" | <img src="https://static.igem.org/mediawiki/2016/a/a8/British_Columbia_Modeling_Equation_2.png" | ||
| − | style="width: 150px; display: table; margin: 0 auto; max-width: 100%"><p align="right">Equation | + | style="width: 150px; display: table; margin: 0 auto; max-width: 100%"><p align="right">Equation 2: Differential Equation for Species Growth</p> |
Revision as of 15:13, 18 October 2016
Modelling
Introduction
A model was developed to describe a mixed culture of C. crescentus and E.coli with cellulose and glucose as the primary feedstocks. In mixed culture systems, the dynamics between the species can impact the complexity of the model, with more sophisticated dynamics requiring significant effort. Two mixed culture dynamics exist in the consortia: competition, in which species compete for substrate, and commensalism, where one species requires the existence of another to survive. The commensalism is passive and has been assumed to have negligible impact on the growth of either culture.
The culture dynamics have been modelled using a system of four ordinary differential equations: one for each species, one for glucose consumption and formation, and one for cellulose degradation. To model our environment, the individual species growth, enzyme expression, and enzyme activity were experimentally determined at optimum co-culture conditions of 30 degrees Celsius. Using these values, ordinary differential equations for a mixed culture were developed assuming that both E. coli and C. crescentus behaved competitively and that cellulose degradation by expressed cellulase enzymes on the C. crescentus surface did not favor C. crescentus due to diffusion gradients.
Monod Kinetics
To model substrate limited growth, Monod kinetics provided a relationship between substrate concentration and species growth. Two constants, maximum specific growth rate and the saturation constant, are required to use the relationship. The maximum specific growth rate of the culture, μmax, is the growth rate when substrate is in excess. The saturation constant, Ks, is the concentration at which the specific growth rate is half the maximum specific growth rate.

Equation 1: Monod Kinetics for Substrate Limited Growth
The maximum specific growth rate and saturation constant can be obtained for our system by evaluating the growth rates for a range of initial substrate concentrations for each strain desired in the model. With a series of biomass concentration values over a range of time, plotting the natural logarithm of each biomass concentration produces a linear plot with a slope equal to the strain growth rate on substrate. With several growth rates as a function of substrate concentrations, the inverse of both the rate and the substrate concentration can be plotted to produce a Lineweaver-Burk plot. The slope of this plot is equal to Ks/μmax, while the intercept is equal to 1/μmax. The C. crescentus data is obtained using this method, seen in Figure 1. An analysis of this plot produced μmax of 0.156 hr-1 and a Ks of 0.403 mM.
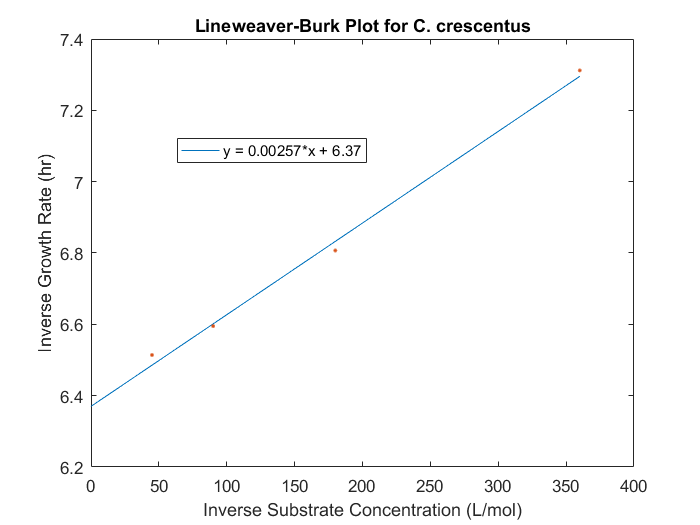
Figure 1: Lineweaver-Burk plot for C.crescentus with initial glucose concentrations of 2.77, 5.56, 11.1, 22.2 M
Caulobacter Model Development
Differential equations using the Monod growth rate can be made for the change in species concentration as a function of time, seen in Equation 2. The experimentally determined growth rate seemed to decrease as a function of cell density, and as a result, a penalty function of the inverse natural exponent to the power of cell density was included in the differential equation. The inclusion of a penalty function improved the relationship between modelled values and experimentally obtained values. The final model correlation can be seen in Figure 2.
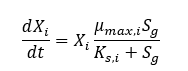
Equation 2: Differential Equation for Species Growth
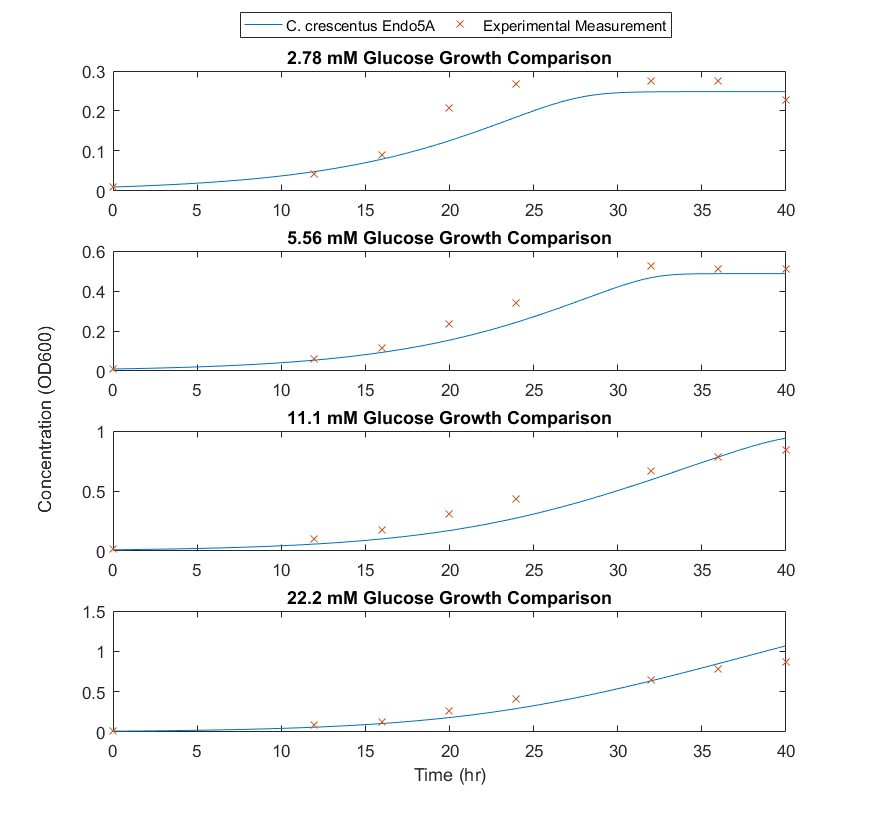
Figure 2: Comparison of experimental data to modelled results for C.crescentus with initial glucose concentrations of 2.77, 5.56, 11.1, 22.2 M
Check out other parts of our project below!

