Proof of Concept
Project
Contents
Overview
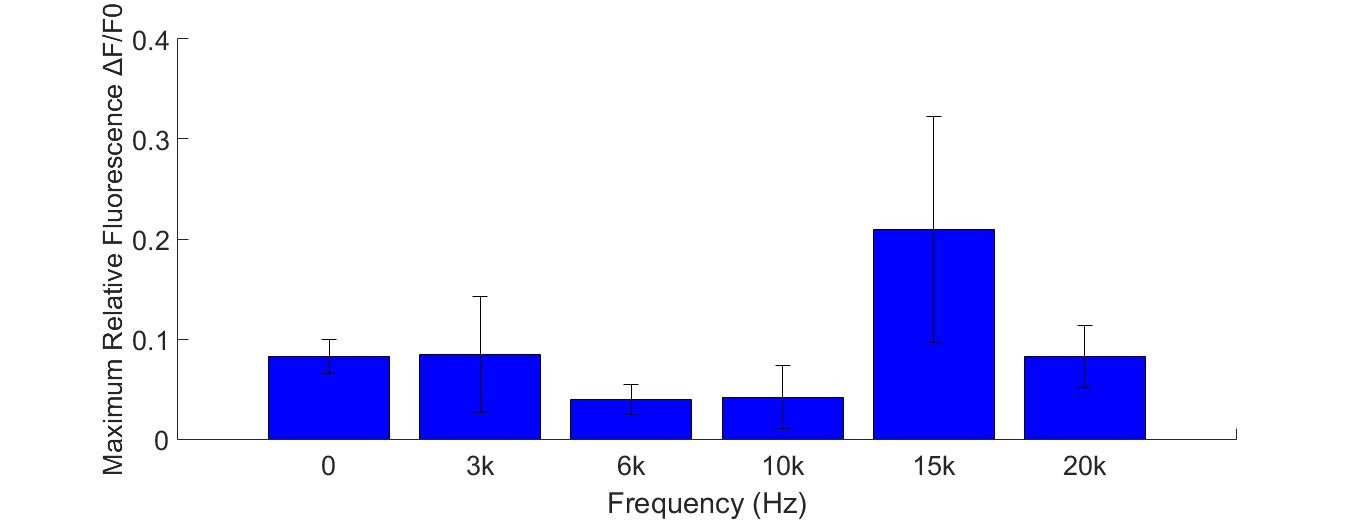
To implement audiogenetics, we chose two (Piezo1 and TRPC5) from hundreds of mechanosensitive(MS) channels for their sensitivity to mechanical stress and selective permeability to calcium ion. We used genetically encoded calcium indicator (R-GECO) to quantitatively examine the sensibility of Piezo1 and TRPC5 channels. We used hypoosmolarity as a positive control stimuli and validate the function of the MS channels and Calcium sensor. We designed a microfluidic chip to quantitatively tune the shear force exerted on cell membrane, and both channel are responsive to such mechical stress. Surprisingly, we discovered that Piezo1-expression CHO cell response to shear force in an biphasic manner and a maximum responsive of ~0.3 pa. We haven't found similar report in the past. We also examined the intracellular calcium response to various combination of frequency and intensity of sound.We discovered that Piezo1-expression CHO cell are very sensitive to 15khz sound and not to 10khz, which indicate the previous identified touching sensing Piezo1 channel could detect sound wave of particular frequency range. Finally, we engineered CHO cell with a GFP gene under the control of NFAT promoter to detect chronic calcium signal). With which, we further developed tools for direct evolution of TRPC5 towarding mutants with high sensitivity to specific sound parameters. All in all, our project is well organized. Each procedure is indispensable. We not only implemented audiogenetics with synthetic biology to sense mechanical stress and sound, but only use it as a research tool for discover novel mechanical properties of Piezo1. The whole project can strongly prove the possibility of using sound wave energy as the extracellular input signal to induce intracellular downstream signal.
1. PiggyBac System Test
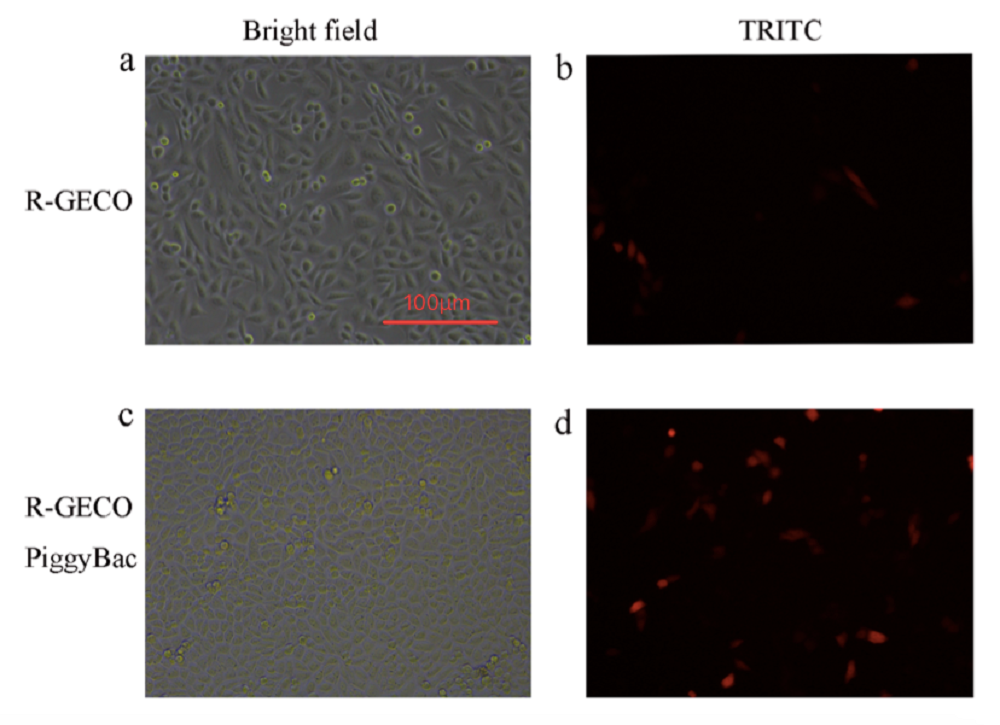
In order to quantitatively test the function of PiggyBac system, we did two groups of transfection using Lipofectamine® 3000. One was a group of CHO-K1 cells transfected with R-GECO, and the other group was the cells transfected with R-GECO and PiggyBac.
a) Bright field image of the cells transfected with R-GECO. b) Fluorescence of the cells transfected with R-GECO. c) Bright field image of the cells transfected with R-GECO and PiggyBac. d) Fluorescence of the cells transfected with R-GECO and PiggyBac.All figures was captured by Nikon microscope (Nikon TS100) 24 hours after transfection.
Comparing the fluorescence image of R-GECO (Fig. 1b) with R-GECO + PiggyBac transfected cells (Fig. 1d), we can observe that the group with PiggyBac has more fluorescent cells. It’s proved that PiggyBac transposon system can help the insertion of R-GECO gene into CHO-K1 genomes.
2. R-GECO Function Examination
To quantitatively test the function of R-GECO, two experiments, potassium chloride (KCl) induced calcium influx and ionomycin induced calcium influx, were conducted under the live cell imaging.
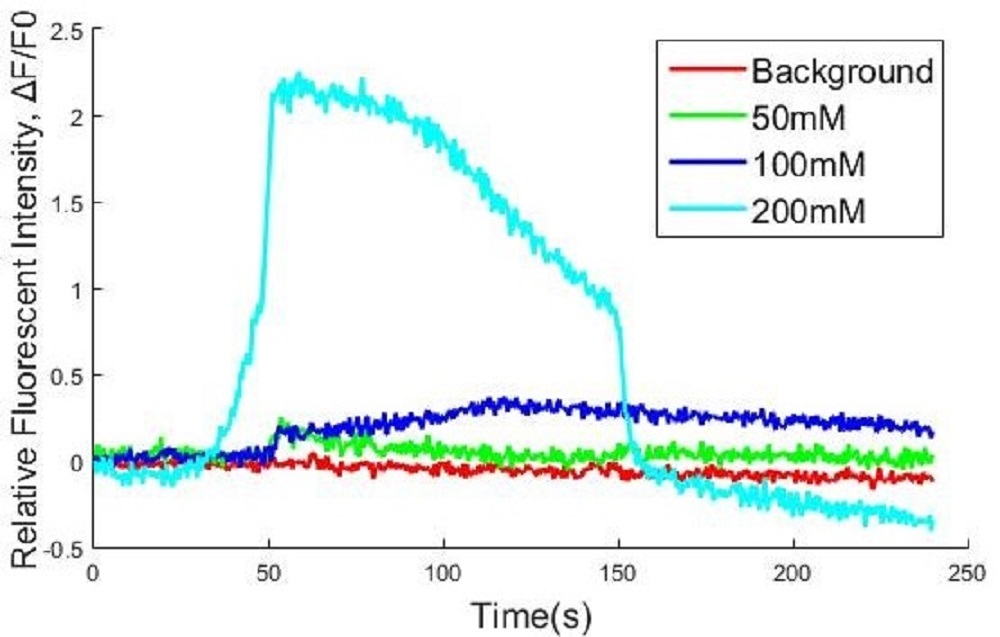
(Calcium influx due to depolarization of cell membrane was induced by different concentration of KCl. Different volume of KCl was added by drops into cell culture wells to reach the different final concentrations of KCl (control, 12.5mM, 50mM, 200mM, respectively) at 40s. Fluorescence intensity over time is shown as signal per pixel (the initial intensity has been subtracteed and normalized). 0 mM control, 12.5 mM, 50 mM, 200 mM.)
There was no distinct fluorescent increase at 12.5mM KCl compared with the control group. Cells under 50mM and 200mM KCl both displayed higher fluorescence. Besides, the fluorescence of cells at 200mM was higher than cell at 50mM along with oscillation. It was proved quantitatively that R-GECO could be excited by KCl-induced calcium influx.
Fig.3 Ionomycin induced Ca2+ influx result(Fluorescence intensity over time is shown as signal per pixel (the initial intensity has been normalized). Ionomycin was added at 20s to 10μM final concentration.)
To further validate our cells, we use ionomycin as another positive control for calcium influx. Ionomycin was dropped on one side of the culture well, the direction of fluorescence gradient (shown in the movie) was consistent with the direction of ionomycin diffusion.
3. Piezo1 and TRPC5 Sensitivity Measurement
We designed two experiments to quantitatively examine the sensibility of Piezo1 and TRPC5. Microfluidics and hypoosmolarity were employed to exert shear force and tension on our transgenic CHO-K1 cells’ membrane separately.
Hypoosmolarity
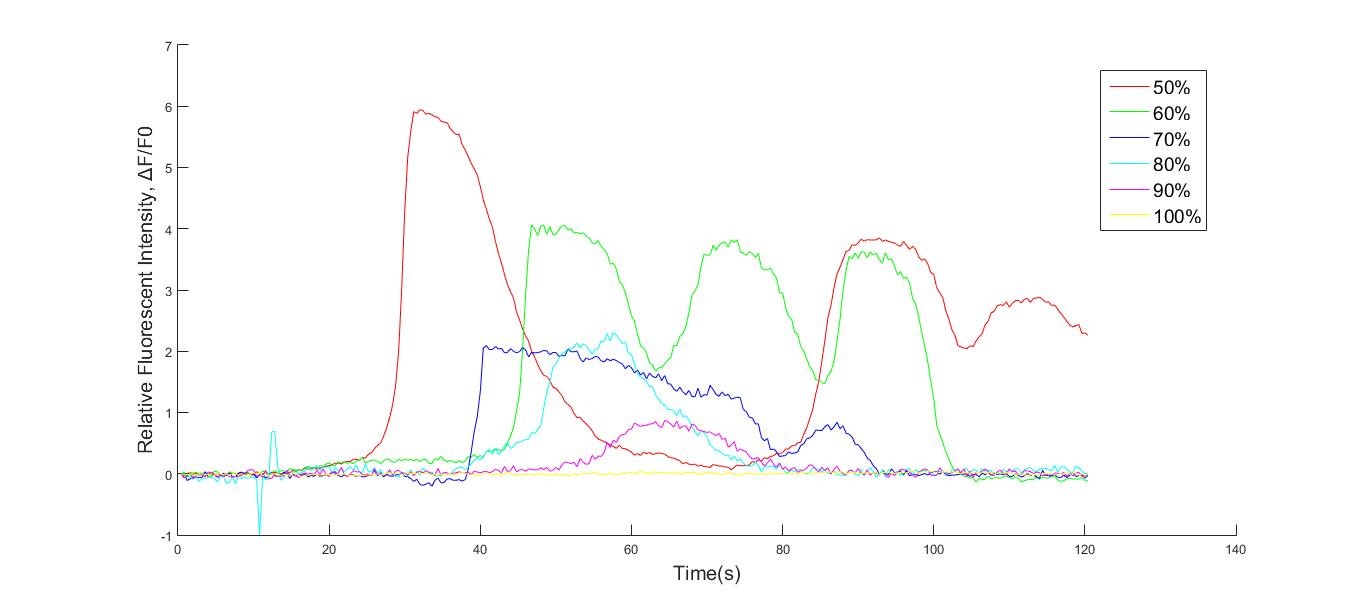
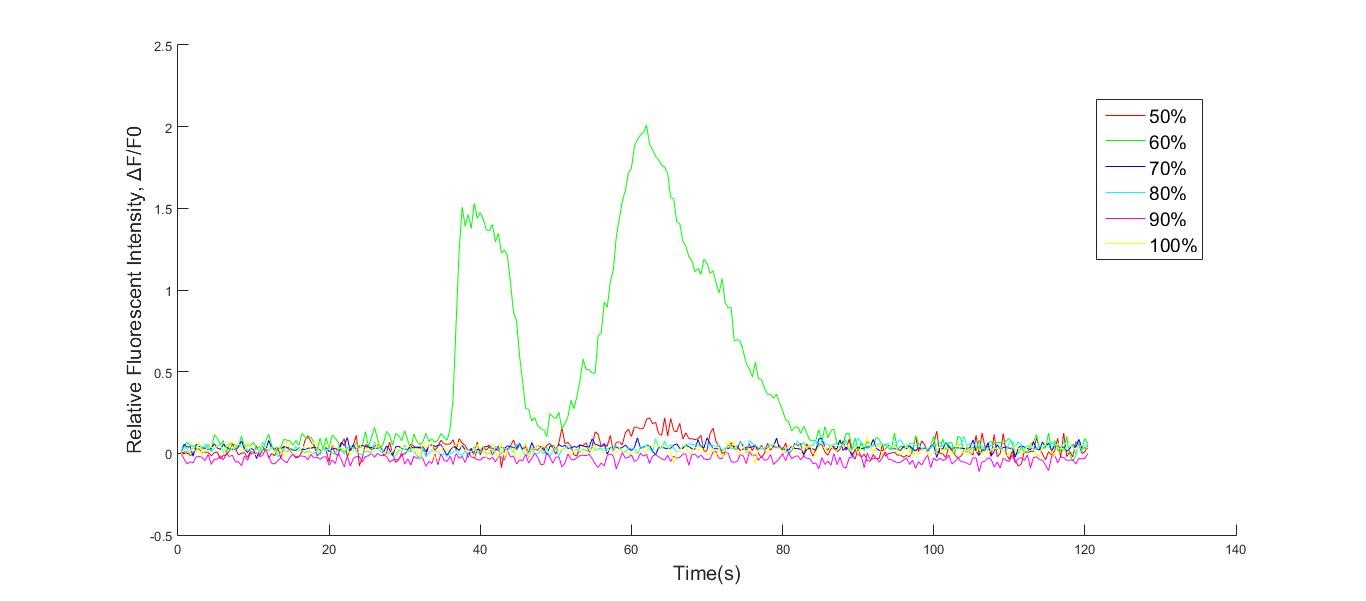
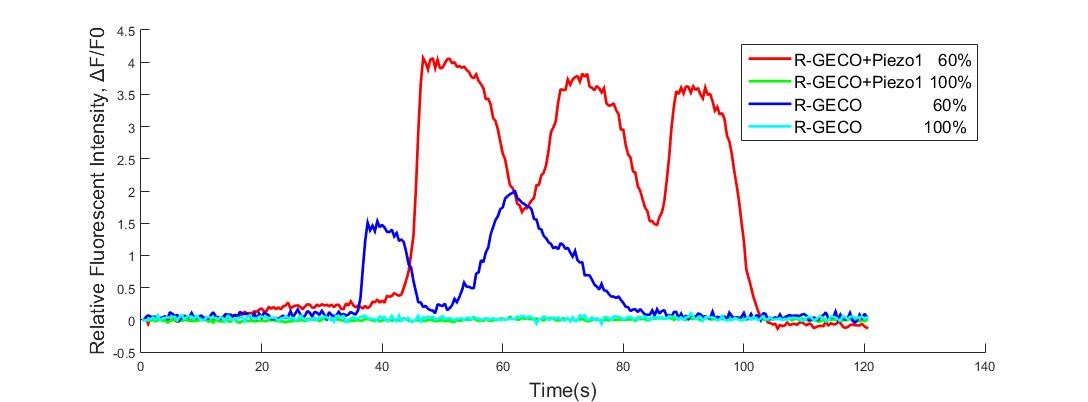
Calcium influx induced by hypoosmolarity was indicated by fluorescence intensity increase of R-GECO. CHO-K1 cells with Piezo1 (Fig.4a) were much more sensitive to hypoosmolarity. The peak values of R-GECO+Piezo1 increased as osmolarity decreased. And there were distinct oscillations of fluorescence when osmolarity was below 70%. However, fluorescence of cells with R-GECO (Fig. 4b) only showed obvious increase and oscillation when the osmolarity was 60%, whose intensity was a lot less than R-GECO+Piezo1 (Fig. 4c). It was quantitatively proved that Piezo1 channel was very sensitive to osmolarity.
Fig. 4 Hypoosmolarity actived cytosolic R-GECO sensor a) CHO-K1 cells with R-GECO+Piezo1. b) CHO-K1 cells with R-GECO. c) Compare for these two cell lines. At 10 second (t=10s), distilled water (added with CaCl2) was added into wells to make final concentration of HHBSS into 100%, 90%, 80%, 70%, 60% or 50% for 3 groups.) Calcium influx was indicated by R-GECO fluorescence intensity. Culture medium was replaced by HHBSS before using live cell imaging. Three groups of cells were seeded into 18 wells: 6 wells of R-GECO, 6 wells of Piezo1 (without doxycycline inducement) and 6 wells of Piezo1 (with doxycycline inducement). Distilled water (added with CaCl2) was added into wells to make concentration of HHBSS into 100%, 90%, 80%, 70%, 60% or 50% for 3 groups.Relative fluorescence intensity over time is shown as signal per pixel (the initial intensity has been subtracted and normalized.)
Microfluidics
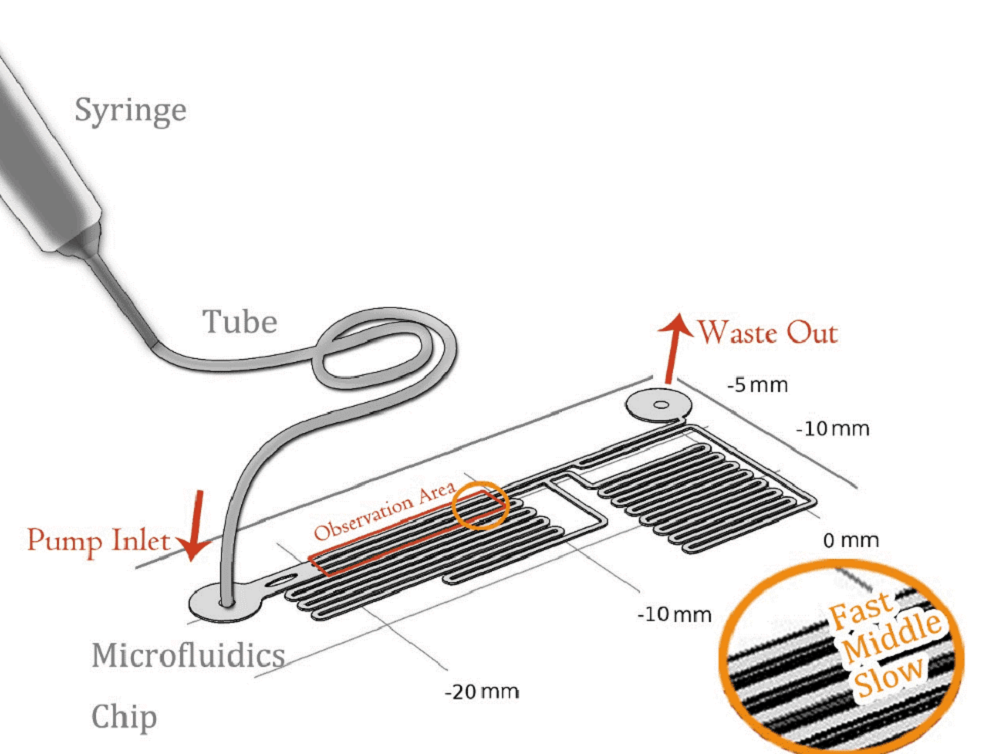
CHO-K1 cells were cultured adherent on the bottom glass of PDMS tunnel. Stable and flexible shear force field was formed cells at surrounding, directly controlled by the micro syringe pump inflow rate.
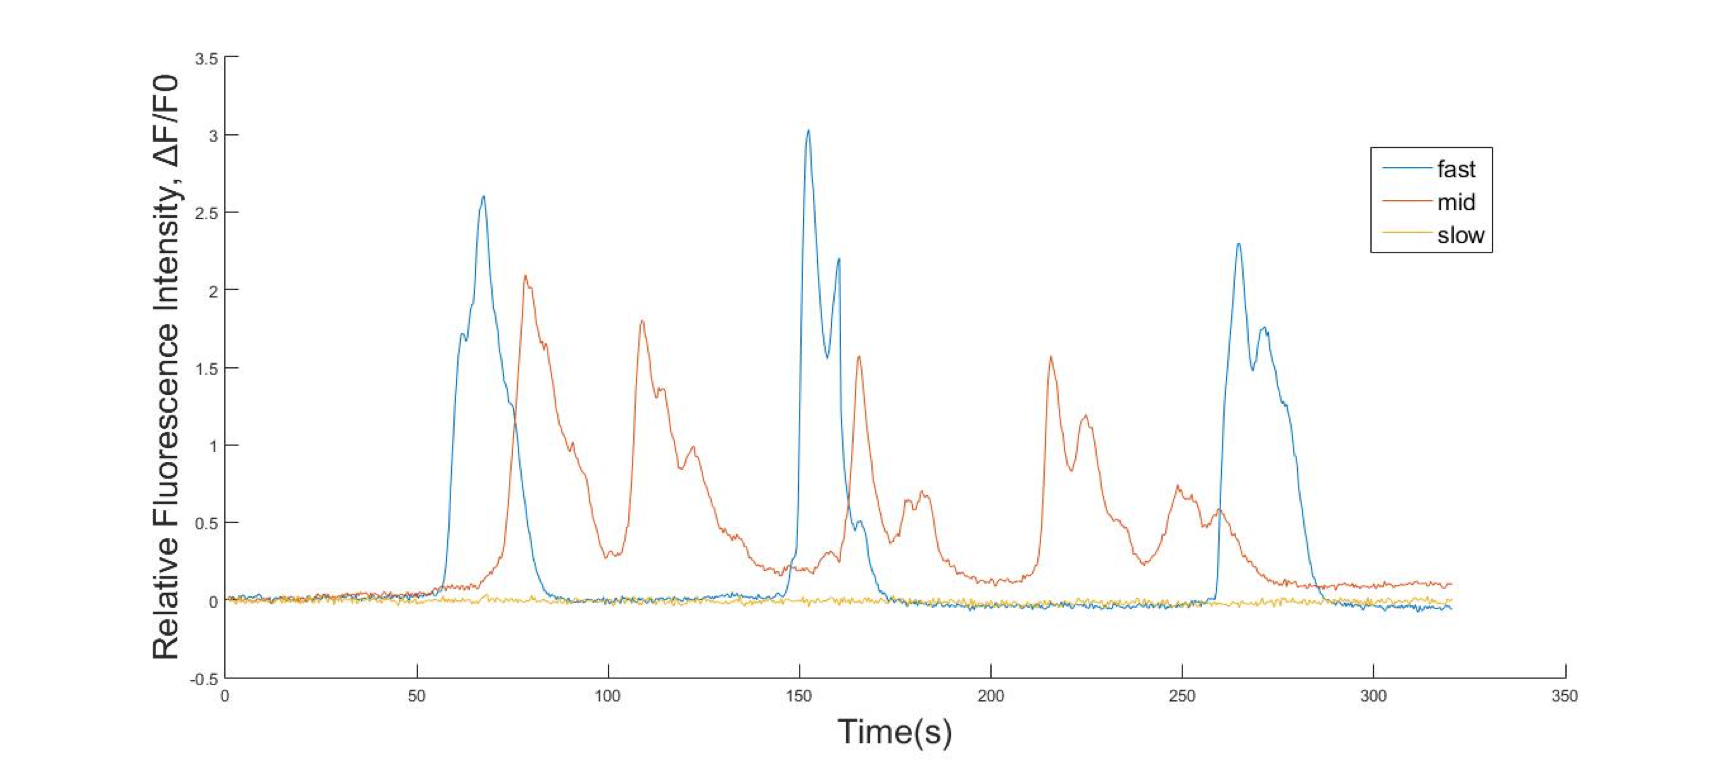
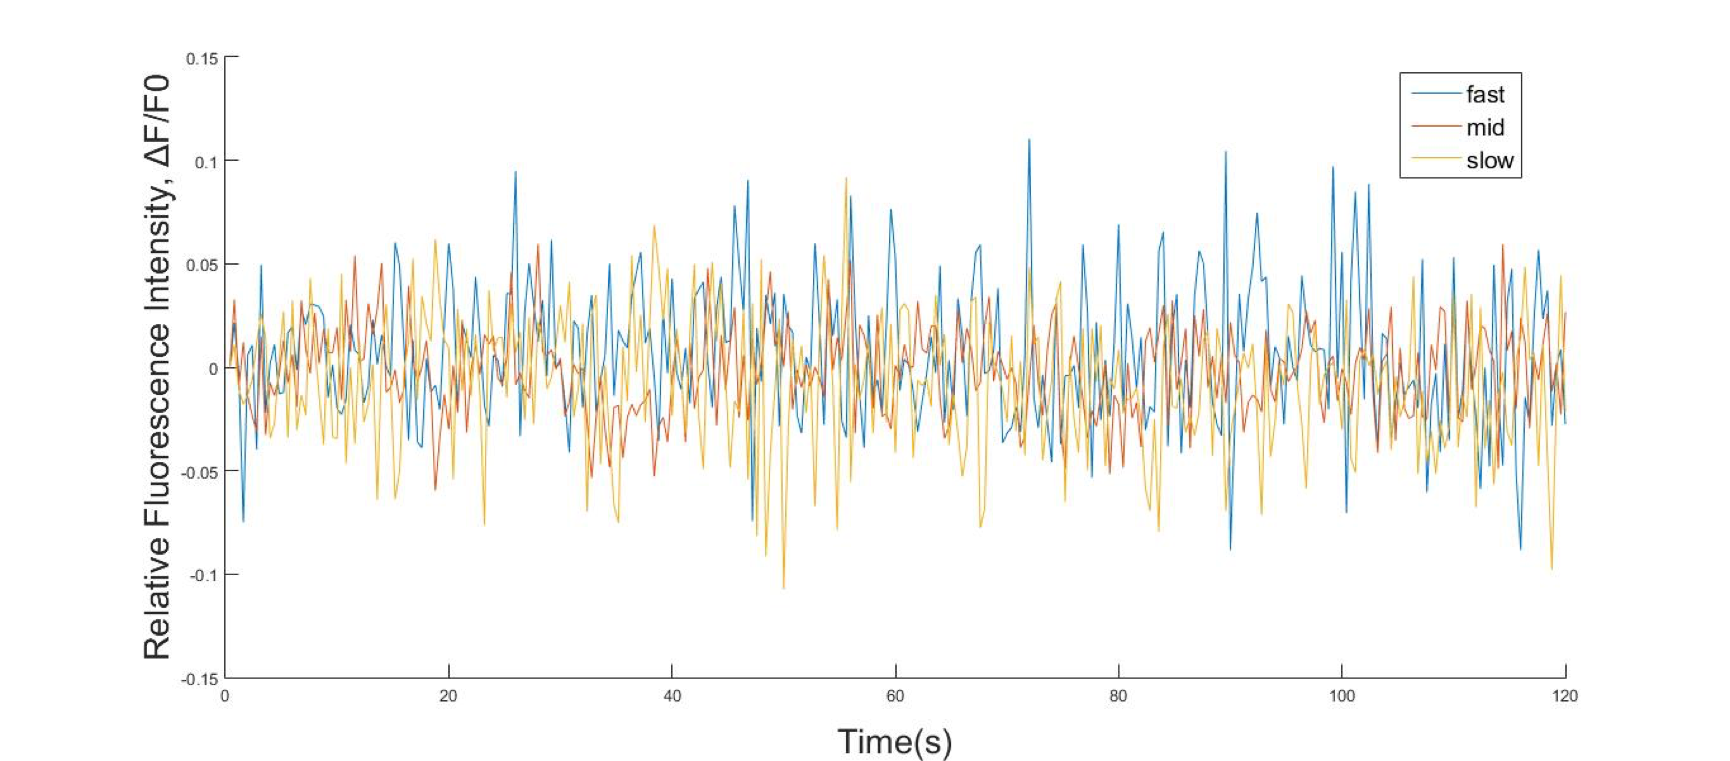
(A: 6.25μL/min, GECO cells B: 6.25μL/min, C: GECO+Piezo1 cells. CHO-K1 cell suspension was injected into gelatin treated microfluidics chips and incubated at 37°C, 5% CO2 incubator for 24 hours. Culture medium was then injected into the chip channels (with the inflow rate of 0μL/min,6.25μL/min and 50μL/min and controlled by micro syringe pump). The pump of culture medium started at t=10s. Cells’ response towards different shear force was measured by R-GECO fluorescence intensity under live cell imaging.)
At the pumping velocity of 6.25μL/min, GECO cells didn’t display much fluorescence change. While for GECO+Piezo1 cells, it can sense shear stress thus causing the influx of Ca2+.
See the design of microfluidics chip and the simulation of force field at Model
CHO-K1 cell suspension was injected into gelatin treated microfluidics chips and incubated at 37°C, 5% CO2 incubator for 24 hours. Then the culture medium was injected into the chip channels (with the inflow rate of 25μL/min, 50μL/min and100μL/min controlled by micro syringe pump). The pump of culture medium started at t=10s. Cells’ response towards different shear force was measured by R-GECO fluorescence intensity under live cell imaging.
See the result discussion at Result
4. Validation of audiogenetics
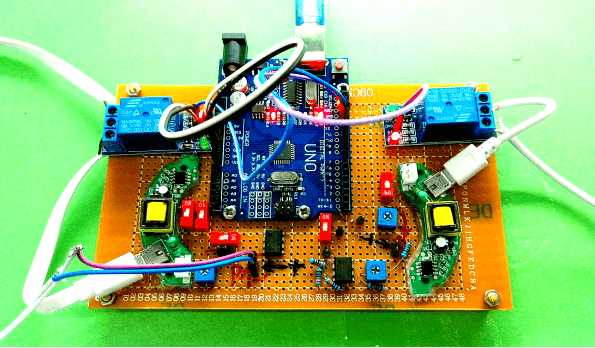
We designed both ultrasonic and audible sonic simulation hardware to quantitatively test stimulated cells.
Audible sonic stimulation
Buzzers, balanced amatures and speakers were used as sonic stimulators. Only buzzers induced obvious cell response in high frequency conditions (15kHz and 20kHz). A buzzer was attached to the bottom of a cell dish. When the buzzer was working, cells around the buzzer boundary was observed under microscope. Strong fluorescence intensity increased immediately after the buzzer was started. Cell fluorescence intensity increased greatly when stimulated by 15K and 20kHz sound. While no obvious fluorescence intensity change when GECO cells (without MS channel) were stimulated (Fig.8 ).
Fig. 8 (A) R-GECO+Piezo1 cell fluorescence intensity increased greatly when stimulated by 15K and 20KHz sound. While no obvious fluorescence intensity changed when GECO cells (without MS channel) were stimulated (B).
Ultrasonic Stimulation
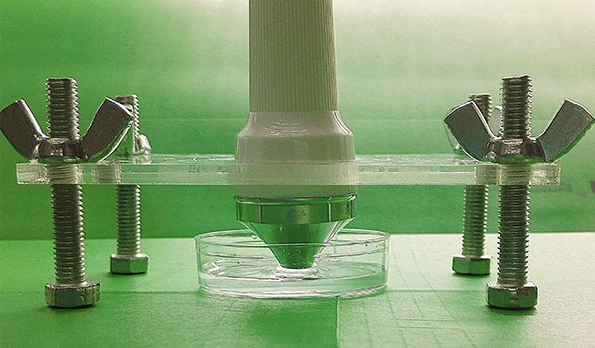
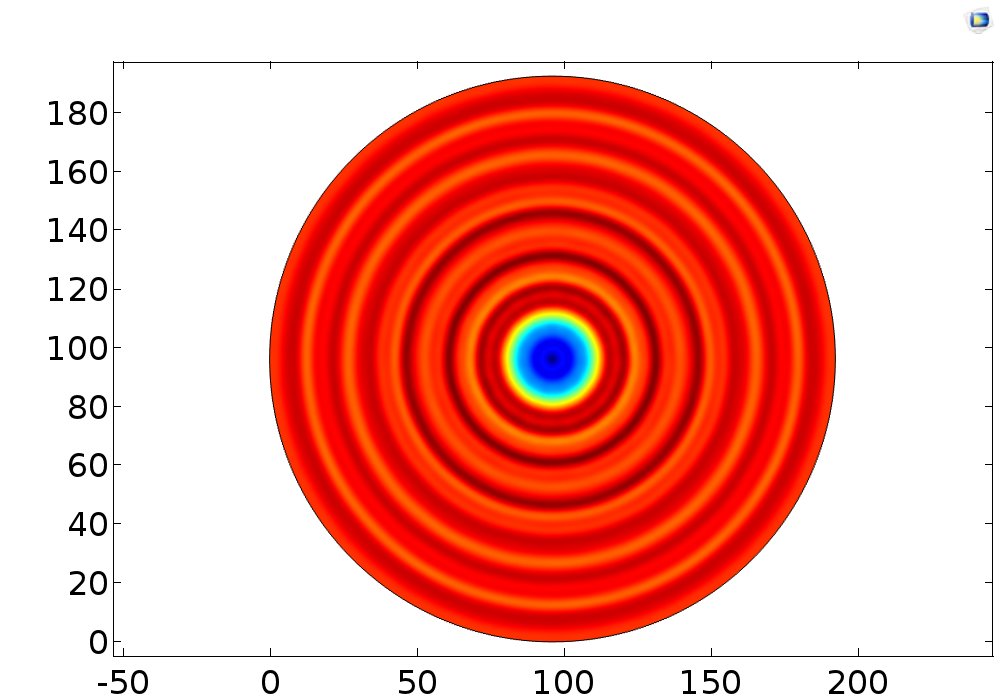
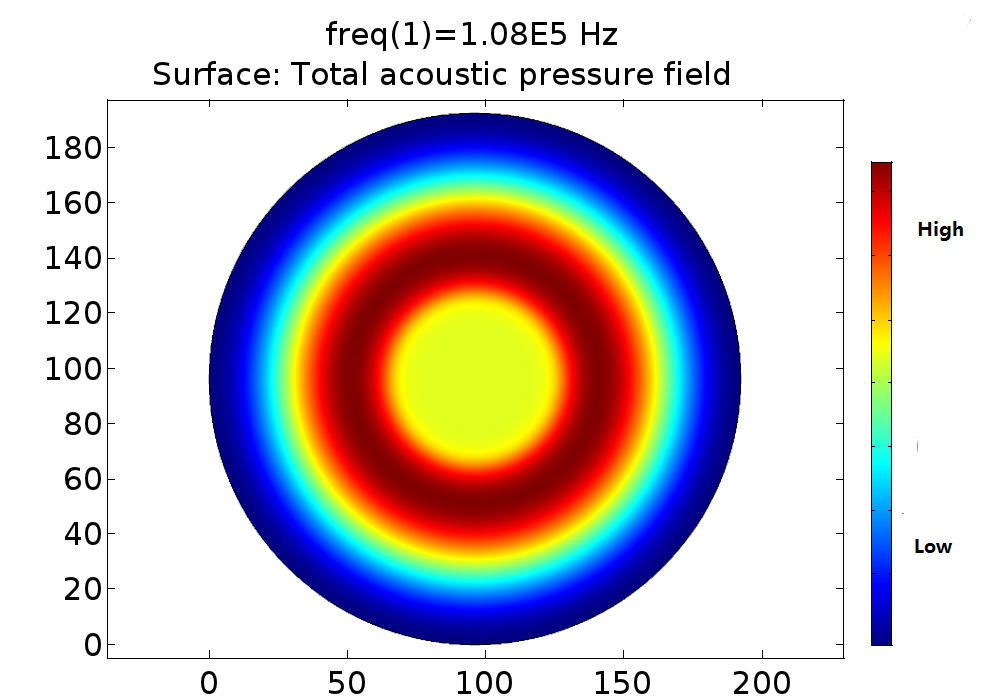
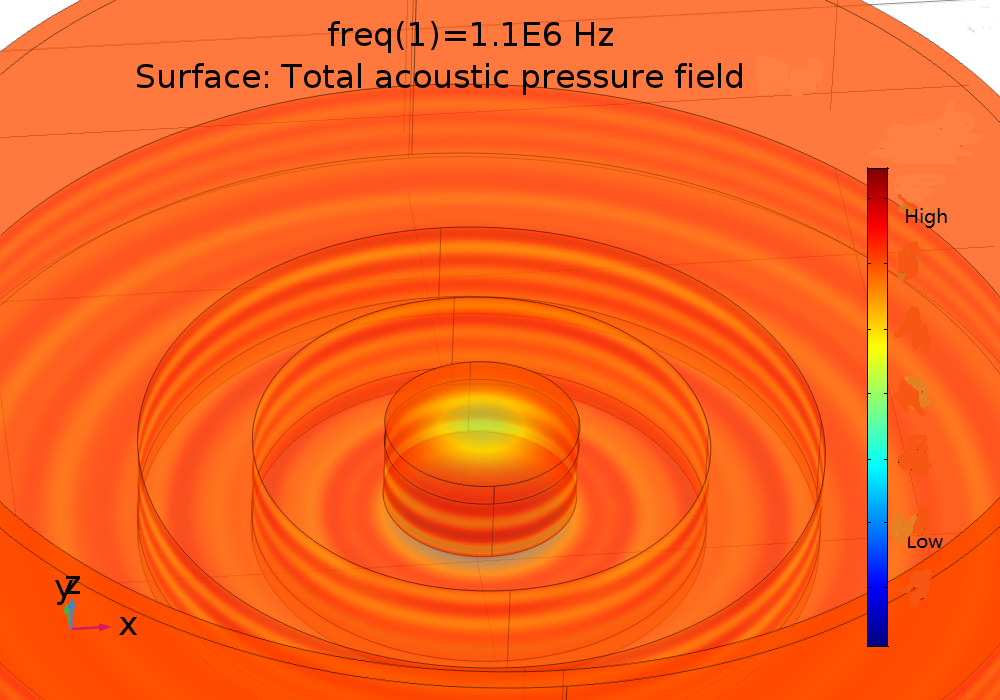
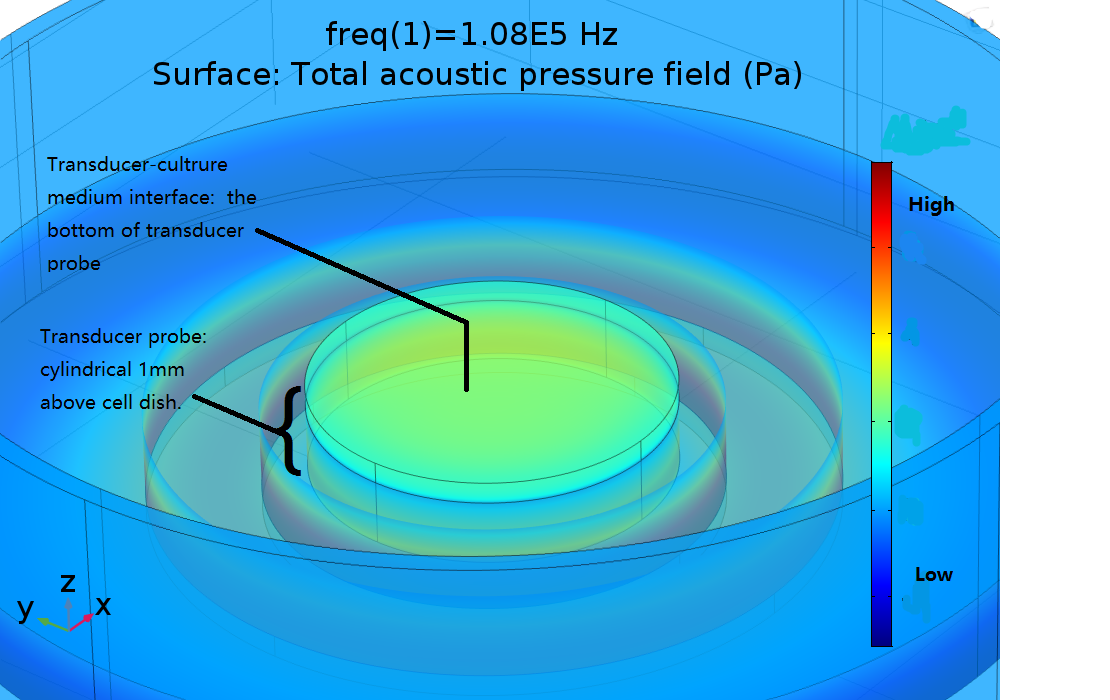
Ultrasonic transducers can transform electric energy into ultrasonic radiant energy. There were four kinds of ultrasonic transducer tried. Pressure fields of 108kHz and 1.1MHz transducers were simulated for different power and distance. The pressure field distribution changes smoothly, while the pressure distribution was quite chaos in condition of 1.1MHz. Only strong cell response was observed in condition of 108kHz stimulation as shown in Fig9. No obvious cell response was observed for 1.1MHz stimulation.
Fig. 12 (A) Pressure distribution of 108KHz ultrasonic transducer, the transducer was 1.0mm far above the cell layer. (B) Pressure distribution of 1.1MHz ultrasonic transducer. 3D pressure distribution for 108KHz condition (C) and 1.1MHz condition (D).
In experiment, 108KHz 4.1W ultrasonic device induced a strong cell response as is shown in the following. However, no cell response was observed when cells were stimulated by 1.1MHz transducer with the same power.
Long-term Stimulation
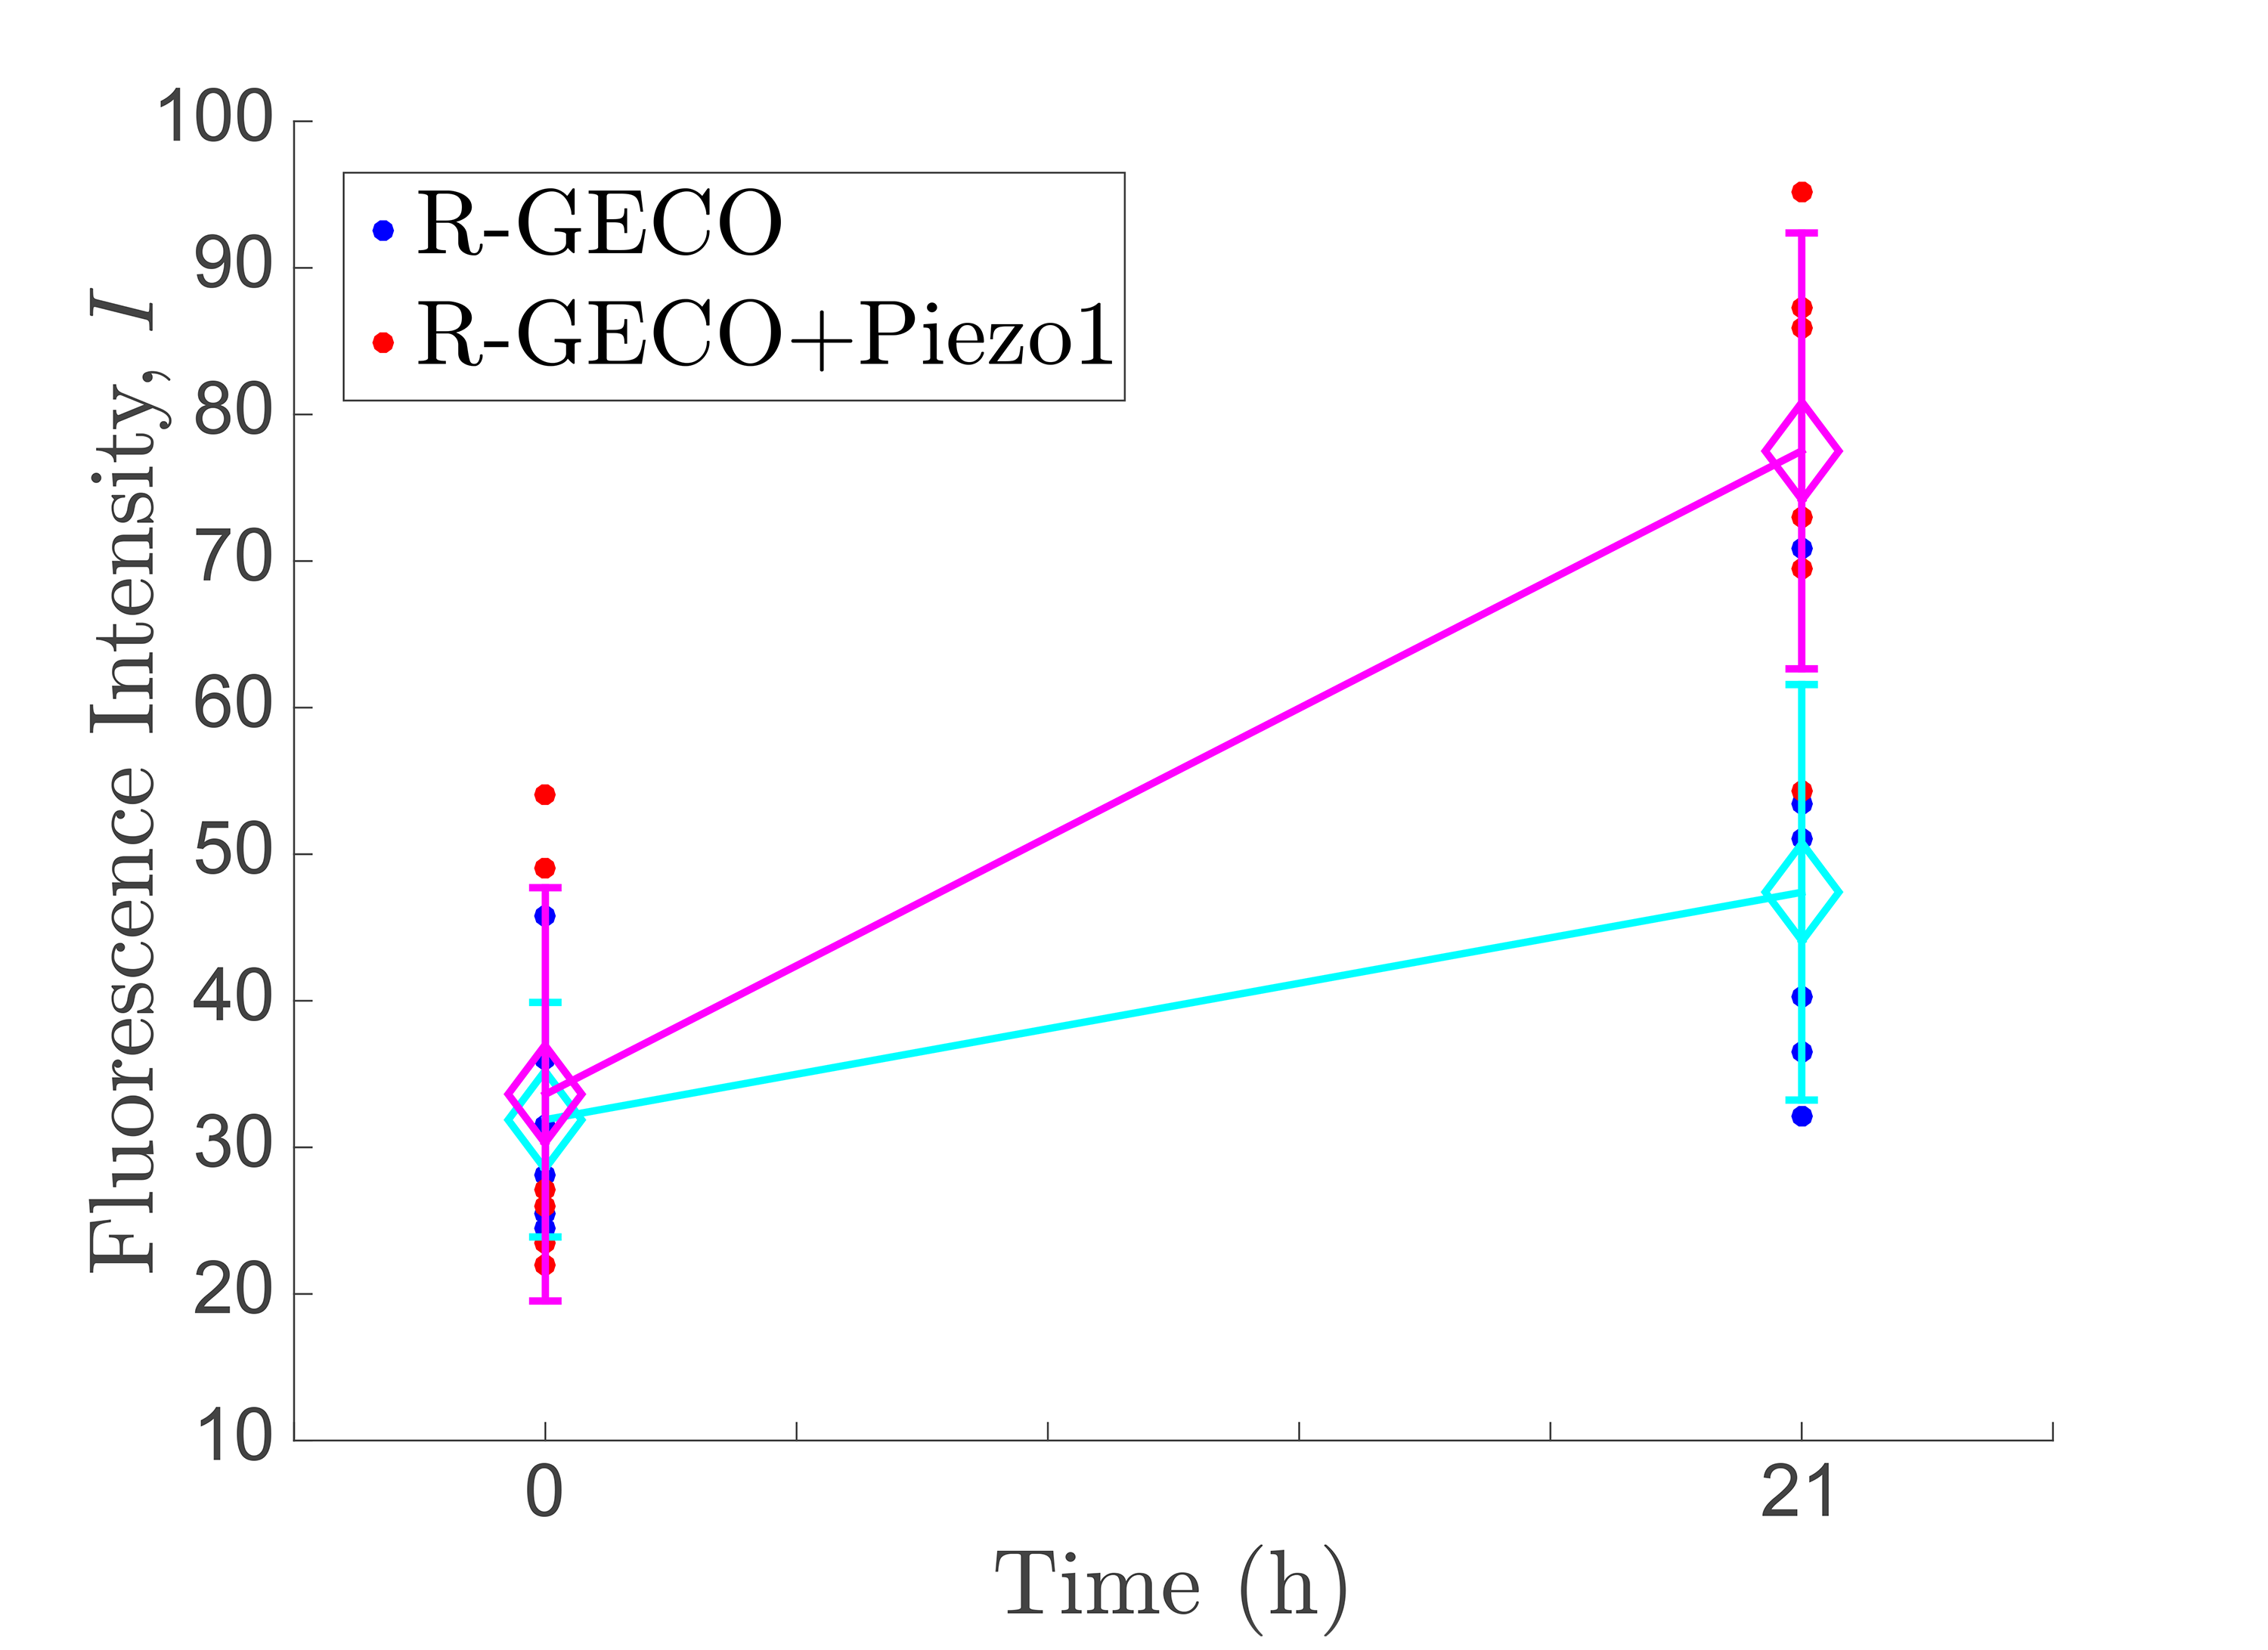
NFAT part can start gene expression when triggered by Ca2+ influx. The NFAT+Piezo1 cell expresses GFP when its MS channels open inducing a Ca2+ influx. Long-term stimulation (21h, 108KHz, 4.1W ultrasonic stimulation) experiment on Piezo1+NFAT cells showed GFP express level increased after 21h stimulation. 108KHz ultrasonic device was programmed to stimulate cells for duty cycle of 5s on and 10s off.
5. Selection by Cre-loxp system
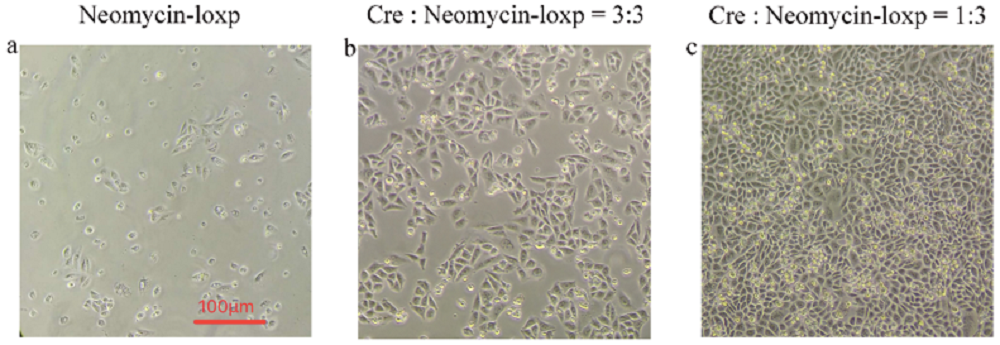
Cre-loxp system played an important role in directed evolution, because we needed to screen a single cell colony only with one loxp site in the genome of each CHO-K1 cell for single copy insert of mutated TRPC5. Here we tested the function of cre-loxp system by making 3 different groups of transfection in the cells that already inserted with loxp gene on genomes using Lipofectamine® 3000.
a) Bright field image of the cells transfected with neomycin-loxp plasmids. b) Bright field image of the cells transfected with Cre recombinase and neomycin-loxp plasmids (3:3). c) Bright field image of the cells transfected with Cre recombinase and neomycin-loxp plasmids (1:3). )Few cells survives (Fig15. a) after antibiotics screening without transfecting Cre recombinase gene, which means that there is a small possibility that loxp gene can insert into genomes by interior transposase in cells. To find out the optimal ratio of Cre recombinase gene to Neomycin-loxp gene in the process of transfection, we compared two different ratio, 3:3 (Fig15. b) and 1:3 (Fig15. c), with equal amount of Neomycin-loxp gene but different amount of Cre recombinase gene.(All pictures was captured by Nikon microscope (Nikon TS100) 120 hours after transfection, 600 μg/ml neomycin were added 72hours screening.
From observation, we know that excess Cre recombinase is not appropriate in transfection process. The most possible reason is that surplus Cre recombinase is harmful for cells, so they may random cut and recombine genes in cell’s genome. Thus, we finally chose 1:3 as the ratio of Cre recombinase gene to Neomycin-loxp gene in transfection.
6. Mutagenesis of TRPC5
Mutation frequency calibration
1. Define ideal mutation frequency
Mutation frequency is the product of DNA polymerase error rate and number of duplications. It depends on initial target amount and fold amplification. Mutation frequencies of 1~4 amino acid changes (2~7 nucleotide changes) per gene are commonly employed.
We have mutated the ankyrin repeats region (734bp length) of TRPC5 by employ 500ng initial tartget and 32 cycle amplification according to the protocol of GeneMorph II Random Mutagenesis Kit (Agilent Technologies,Catalog #200550).
2. Calibration of mutation frequency by sequencing
To calibrate the mutation frequency in experimental condition, we sequenced 20 mutated TRPC5 samples in the region of ankyrin repeats. The table below shows the correspondence between mutation(s) and sequenced sample numbers.
| Mutation(s) | 1 | 2 | 0 |
|---|---|---|---|
| Sample Numbers | 4 | 1 | 14 |
Table 1 Practical mutations and sample numbers
5 samples have been detected mutation(s). However, the transformation result showed that the digestion might be incomplete (Table 2). Still, the data could offer us some information. Basically, the practical mutation frequency with initial target amount of 500ng was similar with the theoretical mutation frequency.
| Colonies | Control |
|---|---|
| 10688 | 113 |
Table 2. Transformation result of mutated TRPC5 ligation product vs control
To construct a large-scale mutation library with different mutation frequencies in the specific region, we also did error-prone PCR with different initial target amounts to get TRPC5 mutants with low, medium and high mutation rate.
Library construction
3. Calculate competent cell efficiency from experimental result
(1). Formula: \frac{\text{Colonies}}{\text{ng of DNA plated}}\times 1000ng/\mu g
(2). Calculation: 237 / 0.02 x 1000=1.185x10⁷ cfu/μg
(3). Actual meaning: 20pg, 5640bp TRPC5 plasmid → 3.457x10⁶ copies
3.457x10⁶ / 237=14586, which means 1 of 14586 plasmids would actually grow on the plate.
4. Compare three methods for mutation library construction
| Method | Colonies | Control |
|---|---|---|
| R. E. D and Ligation | 1772 | 330 |
| Whole Plasmid Mutagenesis | 191 | 0 |
| Gibson Assembly | 38 | 7 |
Table 5. Transformation Results of Three Methods for Mutation Library Construction. All groups were transformed with 5μl products after all experiment procedure with 100ul competent cell. Restriction Enzyme Digestion and Ligation method and Gibson assembly method used the same mole of TRPC5 backbone. Transformation operations were all the same.
From the table, we can know Restriction Enzyme Digestion and Ligation method is the most efficient way of constructing library.
(1). 62ng, 4906bp plasmid → 1.232x10¹⁰ copies
(2). Efficiency= \frac{(1772-330)\times 20 \div 5}{1.232 \times 10^10 \times \frac{1}{14586}}\times 100\% = 0.68\%
We needed to consider their effect on CHO-k1 cell if being directly transfected without transformation and plasmid construction. Since the ligation efficiency was 0.68%, we did an experiment comparing the survival rate of CHO-k1 cells after being transfected with linear DNA and circular DNA. After antibiotic screening, we luckily found that the former one were almost dead, while the latter one were good. Thus we could directly transfect the ligation products into cell without transformation, preventing the mutation library from decreasing.
7. Cell screening for audiogenetics test
1. Transfect the cells with loxp gene, pNFAT+GFP gene, R-GECO gene (calcium indicator) by PiggyBac system and sort them into single colonies by FACS (BD FACSAria)
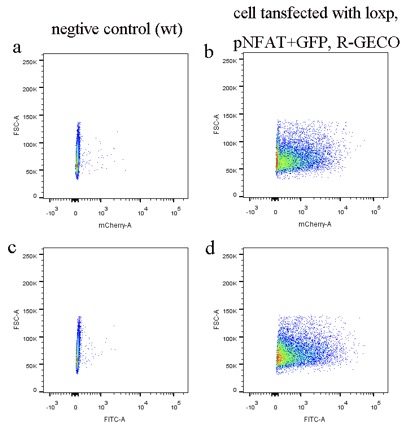
The data was collected in the process of sorting by FACS, total cells count is 10000. Cells transfected with R-GECO gene will continually express R-GECO, because CAG promoter is a constitutive promoter. Thus, most cells have red fluorescence (Fig16. b) compare with wild type control (Fig16. a). Cells transfected with pNFAT+GFP should not express GFP because promoter NFAT need to be activated by calcium signal indirectly. However, most cells still can express GFP (Fig.16 d) compare with wild type control (Fig.16 c), which mean there is some leaky expression of promoter NFAT or background calcium activity.
2. Select the single cell colony only with one copy number of loxp by qPCR
To evaluate the efficiency of each mutated channels, single cell colony with only one copy number is required when testing, so we designed the following experiments to achieve it.
2.1 Primer design and primer efficiency test
The real-time PCR primers (Forward: TTGTCAAGACCGACCTGTCC, Reverse: TTCAGTGACAACGTCGAGCA) were designed by Primer-BLAST, a tool for finding specific primers, followed by BLAST specificity check. Firstly, we selected an appropriate annealing temperature to avoid unnecessary amplification as well as improving primer efficiency by normal PCR test in wild type CHO-K1 genomes, the result indicates that 62℃ may be the most appropriate annealing temperature. In addition, we also confirmed that the amplification product was accurate at 62℃ when the target was cells genome that transfected with neomycin-loxp gene by sequencing the PCR product.
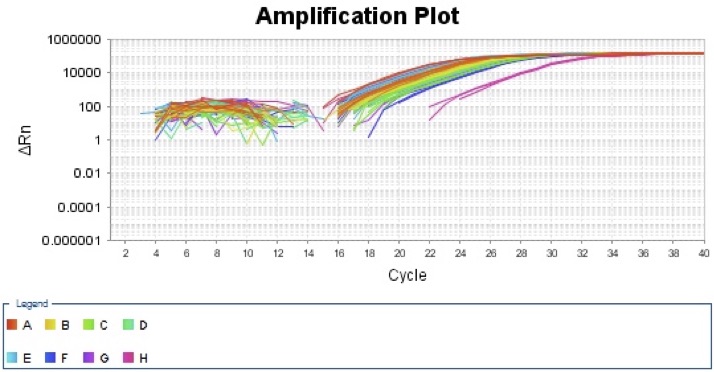
Real-time PCR ( here we used TaKaRa-SYBR Premix Ex Taq II(Tli RNaseH Plus) ran in the ABI StepOne Plus qPCR instrument) can be used to calculate the primer efficiency of PCR amplification via Equation 1. In which X_n = PCR product quantity after n cycles, X_0 = initial copy number, E = amplification efficiency, n = cycle number.
X_n=x_0 \times (1+E)^n
Equation 1
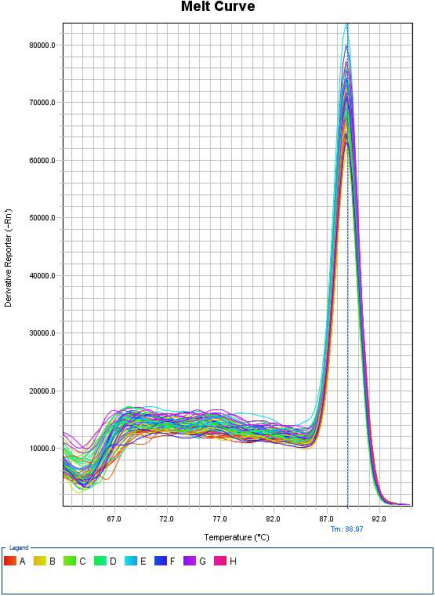
The efficiency of the primer is 104% by calculating (Within the usual margin of error, which is 90%~110%). Also, the melt curve has only one peak, which means the designed primer is quite specific to the transfected CHO-K1 cell’s genomic DNA.
2.2 Select the cell colony with single copy number
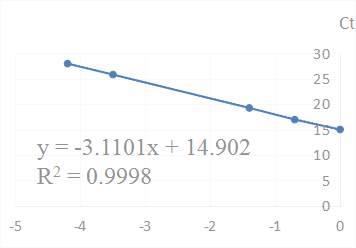
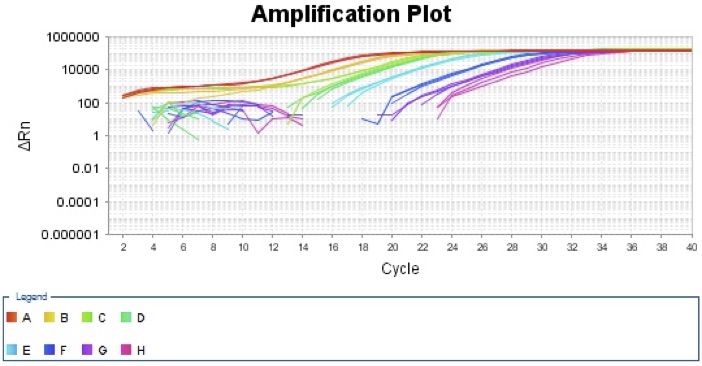
In each qPCR screening experiment, we made a standard curve by employing a series of 5-fold dilution gradient Neomycin-loxp gene with known mole amount. Therefore, we could quantitatively examined the copy number of neomycin-loxp gene in single colony genomes by fitting the sample Ct data in the standard amplification plot. Standard curve was made by using the following data.
| Relative Quantity | log(Relative Quantity) | Ct |
|---|---|---|
| 1 | 0 | 15.01047802 |
| 0.2 | -0.698970004 | 16.94664574 |
| 0.04 | -1.397940009 | 19.24198341 |
| 0.00032 | -3.494850022 | 25.79216194 |
| -4.193820026 | 27.9509449 |
Table 10. Log(Relative Quantity) vs. Ct
(within the usual margins of error, which is 90%~110%)
Copy Number
| Mass/ng | Ct | Relative Quantity | 10^-3 fmole | Copy Number |
| 78.8075 | 23.2236 | 0.002110101 | 0.0531425 | 4.054 |
| 40.7625 | 24.1791 | 0.001040142 | 0.0274875 | 3.863 |
| 19.0225 | 25.2316 | 0.000477161 | 0.0128275 | 3.797 |
| Average | 3.905 |
Table 11. Neomycin-loxp Copy Number of CHO-K1 Cell
Relative Quantity =10^\frac{\text{Ct}-14.902}{-3.1101}
Copy Number :
Plasmid used in standard curve: 0.1021 fmol, Relative Quantity=1
c=\frac{\text{Quantity}\cdot 102.1}{\text{fmole} } (c: copy number)
The efficiency of PiggyBac transposon system ranged from 2% for one transposon to 0.5% for five transposons [1]. Consequently, it’s quite possible for us to screen out the cells with single or low copies of Neomycin-loxp.
In practical experiments, we totally test 18 different single colony genomes. The lowest copy number of those selected CHO-K1 cell transfected with Neomycin-loxp is around 4, which was not good enough. The reason may be that the designed primer was not so satisfying. Also, the contamination during real-time PCR was hard to avoid. To get cells with single copy of Neomycin-loxp, we still need to design better primers as well as paying attention to the experiment operations.
3. Transfect the cells with mutated TRPC5 by Cre-loxp system
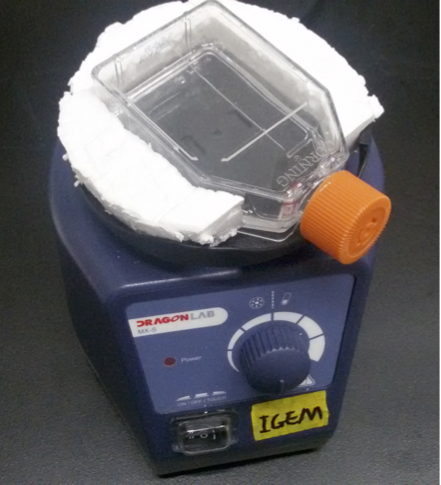
After we’ve selected the CHO-K1 cell transfected with single copy of NeoLoxp, we could transfect mutated TRPC5 into the cell’s genomic DNA using Cre-Loxp recombination system. Then we would use fluorescence activated cell sorting(FACS) to select the cells with high intensity of GFP after long term stimulation. To realize high-throughput screening, we designed a device as shown in the figure below. Cells are seeded at the larger area side of the bottle, and the bottle is fixed above vortex through a holder and foam. Then we are going to place this device in cell culture incubator with vortex running for 20 hours, to fulfill long term mechanical force stimulation.
After the first round of mutation and screening, we still need to continue mutation based on the previous result. We will extract genomic DNA of the screened-out CHO-K1 cell, performing polymerase chain reaction with the mutation primer and sending the PCR product for sequencing. Through alignment of the mutated TRPC5 with normal one, we could clearly see which base site has been mutated. Combing with the TRPC5 structure we’ve known, we may explain why the specific site mutation could induce channel’s greater sensitivity to mechanical force. Then we could specify the mutation region every time, repeating then huge-library mutation and high-throughout screening procedure, thus realizing directed evolution.
Ideally, we would like to screen out then mutated TRPC5 with high sensitivity to mechanical force. As for the audiogenetics, we hope to screen out cells which are able to response to specific sound frequency, achieving precise and orthogonal audio regulation.
References
- ↑ Lu, X. and W. Huang, PiggyBac mediated multiplex gene transfer in mouse embryonic stem cell. PLoS One, 2014. 9(12): p. ell 5072

