Measurement
Model
Contents
Introduction
Mechanosensitive channels (MS channel) are present in the cell membrane of both eukaryote and prokaryote and responsible for sensing mechanical stimuli,such as touch, hearing and balancing [1] [2]. They also participate in cardiovascular regulation and osmotic homeostasis. In our project, we aim to use synthetic biology as a research tool to systematically explore the MS channel’s properties of feeling mechanical stress. Thus, careful control of parameters is of utmost importance. So far, the most widely accepted method to examine the sensibility of MS channel is patch clamp technique [3][4]. However, patch clamps cannot be applied to this scenario as the pressure exerted on cells membrane is usually between 10 mmHg (1330 pa) and 20 mmHg (2660 pa), which is much bigger than necessary to activate MS channels.
Here, we successfully activated two MS channels (Piezo1, TRPC5) at 0.01 Pa by using custom-designed microfluidics chip. This is consistent with the recent literature that the stress needed to activate some MS channels is less than 1 Pa[5][6]. The microfluidics we designed is used for quantitative and precise measurement of the MS channel response to programmable shear force in a repeatable and flexible fashion. Furthermore, we adapted the Particle Image Velocimetry (PIV) method and computer vision in our microfluidics study to compare the designed value with computer simulation and experimental measurement. We are proud that all three of them are quantitatively consistent to each other. We believe the chip can be widely used to study any MS channels expressed in adherent cells.
Microfluidics design
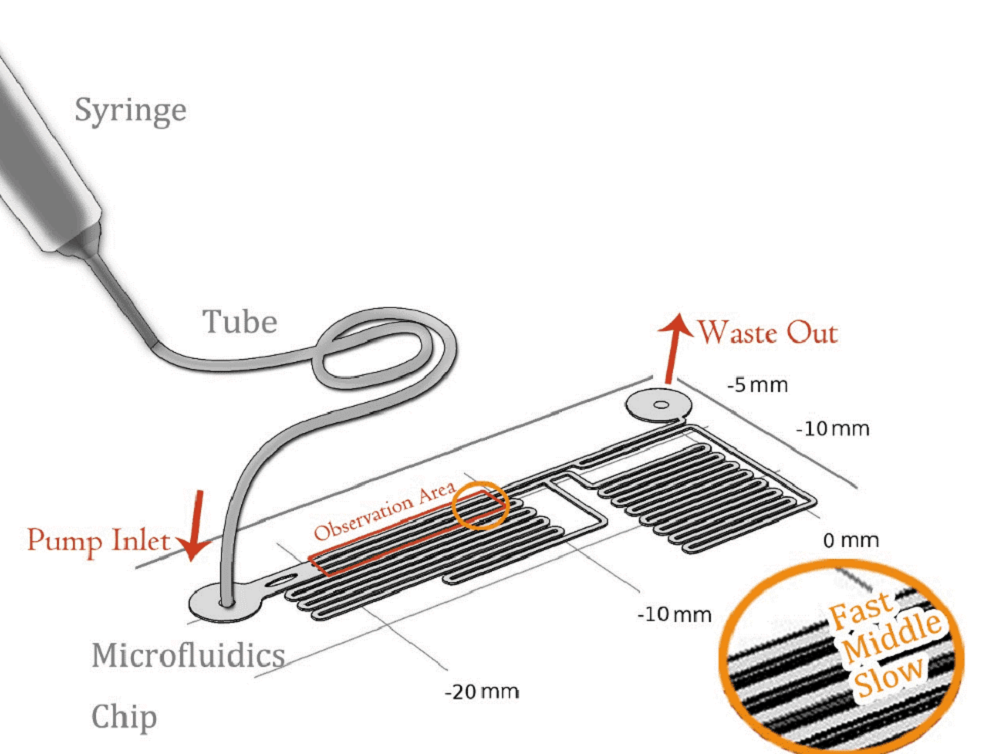
Our experiment was conducted by using microfluidic chip (Fig. 1)(The concept map is shown in Fig. 1). CHO-K1 cells were cultured on the surface of glass at the bottom of PDMS tunnel. When a steady culture media flows through, a stable shear force field could be formed. By controlling the pumped-inflow rate using syringe pump, we could also directly determine the properties of the force field(e.g. Intensity). Each time we applied a constant pumped inflow, cells in 3 different observation tunnel (0.285mm of width, 0.090mm of height) could receive corresponding force of 3 levels---small, middle, large(1: 9: 81). This is realized with the carful design of sequential channel branching and branching length. By changing the pumped flow rate, we could measure MS channel’s response under a series of forces and 3 levels magnitudes at a time. Another aspect of the design is that the three channels form an observation region match the microscopy parameters for simultaneous measurements of calcium signal dynamics, and. The third consideration is that the observation region are close to the inlet so that all the cells received the fresh culture media.
Mathematical Analysis
During our experiment, when fluid(culture media x flowed through the tunnel, the shear force was applied on a thin layer close to the wall. The culture medium can be treated as a Newtonian flow with a constant viscosity μ,0.012dyn·s/cm2[7]. The shear stress that medium generated on the wall is proportional to strain rate. As a result, we could relate the magnitude of stress to the velocity gradient along the transversal surface of each tunnel.
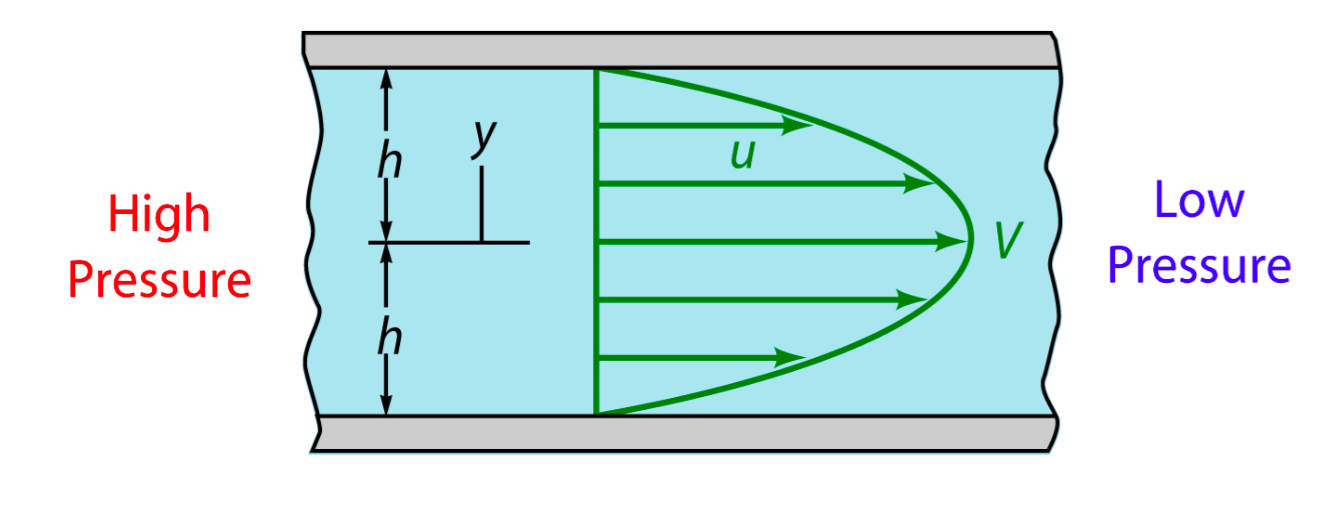
Due to the extremely small scale of microfluidic channel (only 0.285mm of width and 0.090mm of height), fluid in it exists as the Laminar flow. Turbulent flow is not possible within the physiological range of flow speed, even at the corners. The head loss of the pumped inflow is also negligible in our experiment. The modeling of flow between 2 parallel plates applies to such stable state, in which the magnitude of shear stress on the bottom is proportional to the maximum velocity (shown as the longitudinal central line in Fig. 2).
As the shear stress is proved proportional to the flow rate in the tunnel, we designed the chip to achieve that each of 3 tunnels in observation area has the same transversal surface but the gradient (81: 9: 1 from up to bottom) flow rate, also the average speed, as shown in Fig. 3
The lengths of straight tunnels between AB and AC (LAB, LAC) are 14.3mm and 12.0mm, and the curved tunnels between AB and BC(RAB, RBC) are 108.0 mm and 105.0mm.
Newtonian fluid flows between two wide, parallel plates Flow driven by pressure difference Parabolic velocity profile given by u = V[1-(y/h)^2] where V is the maximum velocity (along channel centerline y=0) Along bottom wall, y=-h, shear stress \tau=\mu \frac{du}{dy}=\mu(-2V\frac{y}{h^2})=\frac{2\mu V}{h} For a constant flow rate within the tunnel, the average speed remains same \bar V=\frac{Q}{A}=\frac{\int_A udA}{A}=\frac{1}{2}V
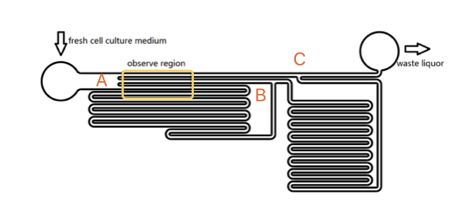
Based on the integral form of the continuity equation for an incompressible fluid, at any given time, the sum of flow volume in each branch is equal to the total volume pumped in the whole chamber. According to the Kirchhoff's law, the accumulation of flow speed at the joint point must be zero. It is easy to get the equation that\begin{matrix} L_{AC}V_1=L_{AB}V_2+R_{AB} V_3 \\ V_2:V_3=R_{AB}:L_{AB} \end{matrix}
Consequently, we could reach the conclusion that the maximum velocity, average flow rate and the shear force on the bottom of each tunnel is at a ratio of 81 : 9 : 1. To verify the back-of-the-napkin calculation, we performed experimental calibration in the real microfluidics chip, and the testing result is very close to designing value (about 75 : 8 : 1 of the maximum velocity ratio in each tunnel) and the simulation result ( 80 : 8 : 1).
Calibration
To experimentally measure the standard speed of the inflow, Rainbow beads (SPHEROTM Rainbow Calibration Particles, diameter: 6um) were dissolved in the cell culture medium. A series of pumped flow rate (5ul/min, 15ul/min, and 45ul/min) were applied to generate a steady fluid flow. The exposure time was set to 100ms (one representative image is shown in Fig. 4).
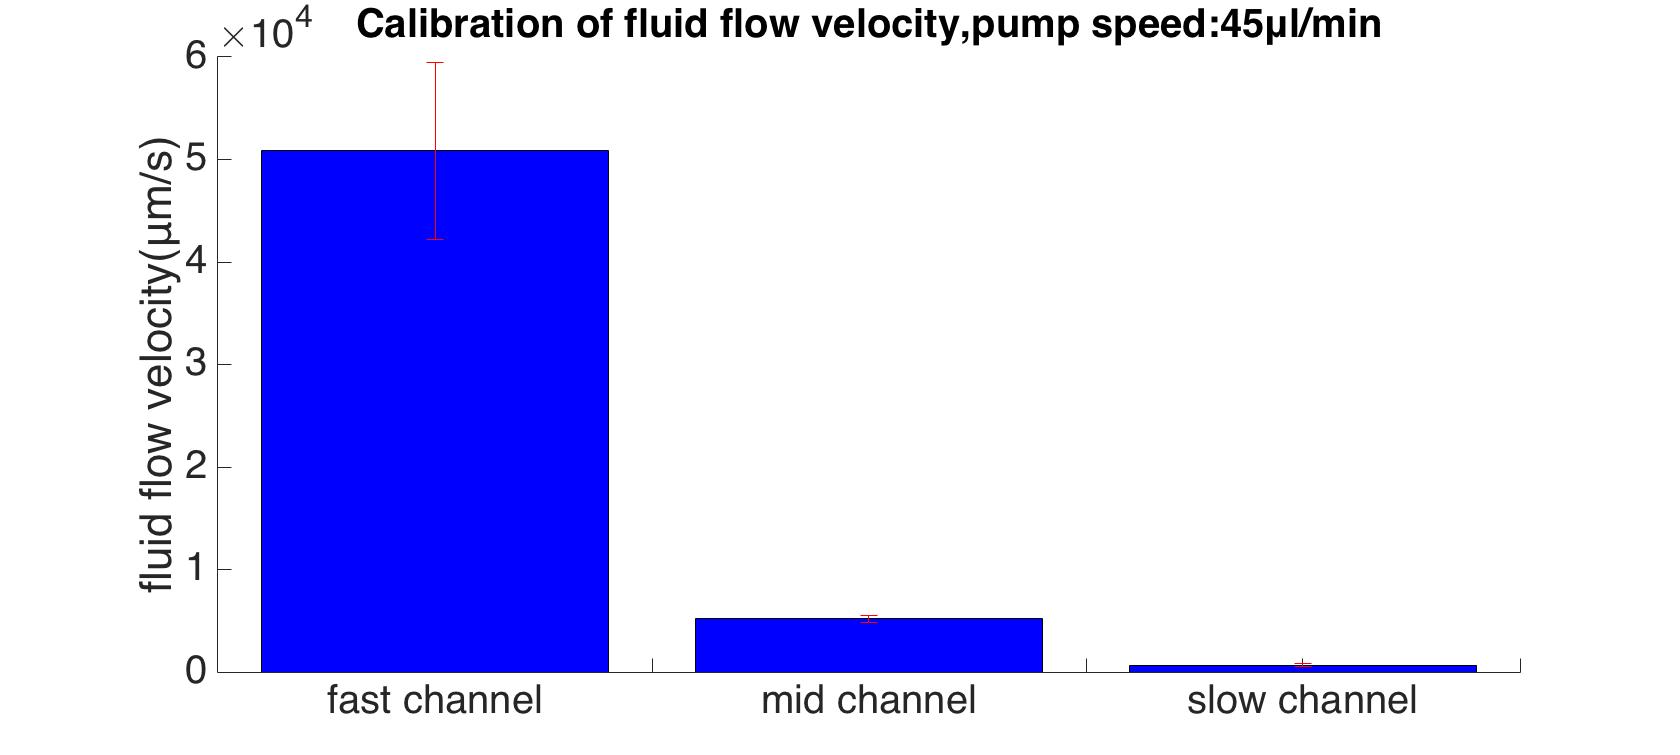
By using our custom MATLAB program, the ratio of maximum flow velocities were calculated as 13 : 100 : 978. The absolute speed with pump speed of 45 um/min is shown in Fig. 5.
Simulation
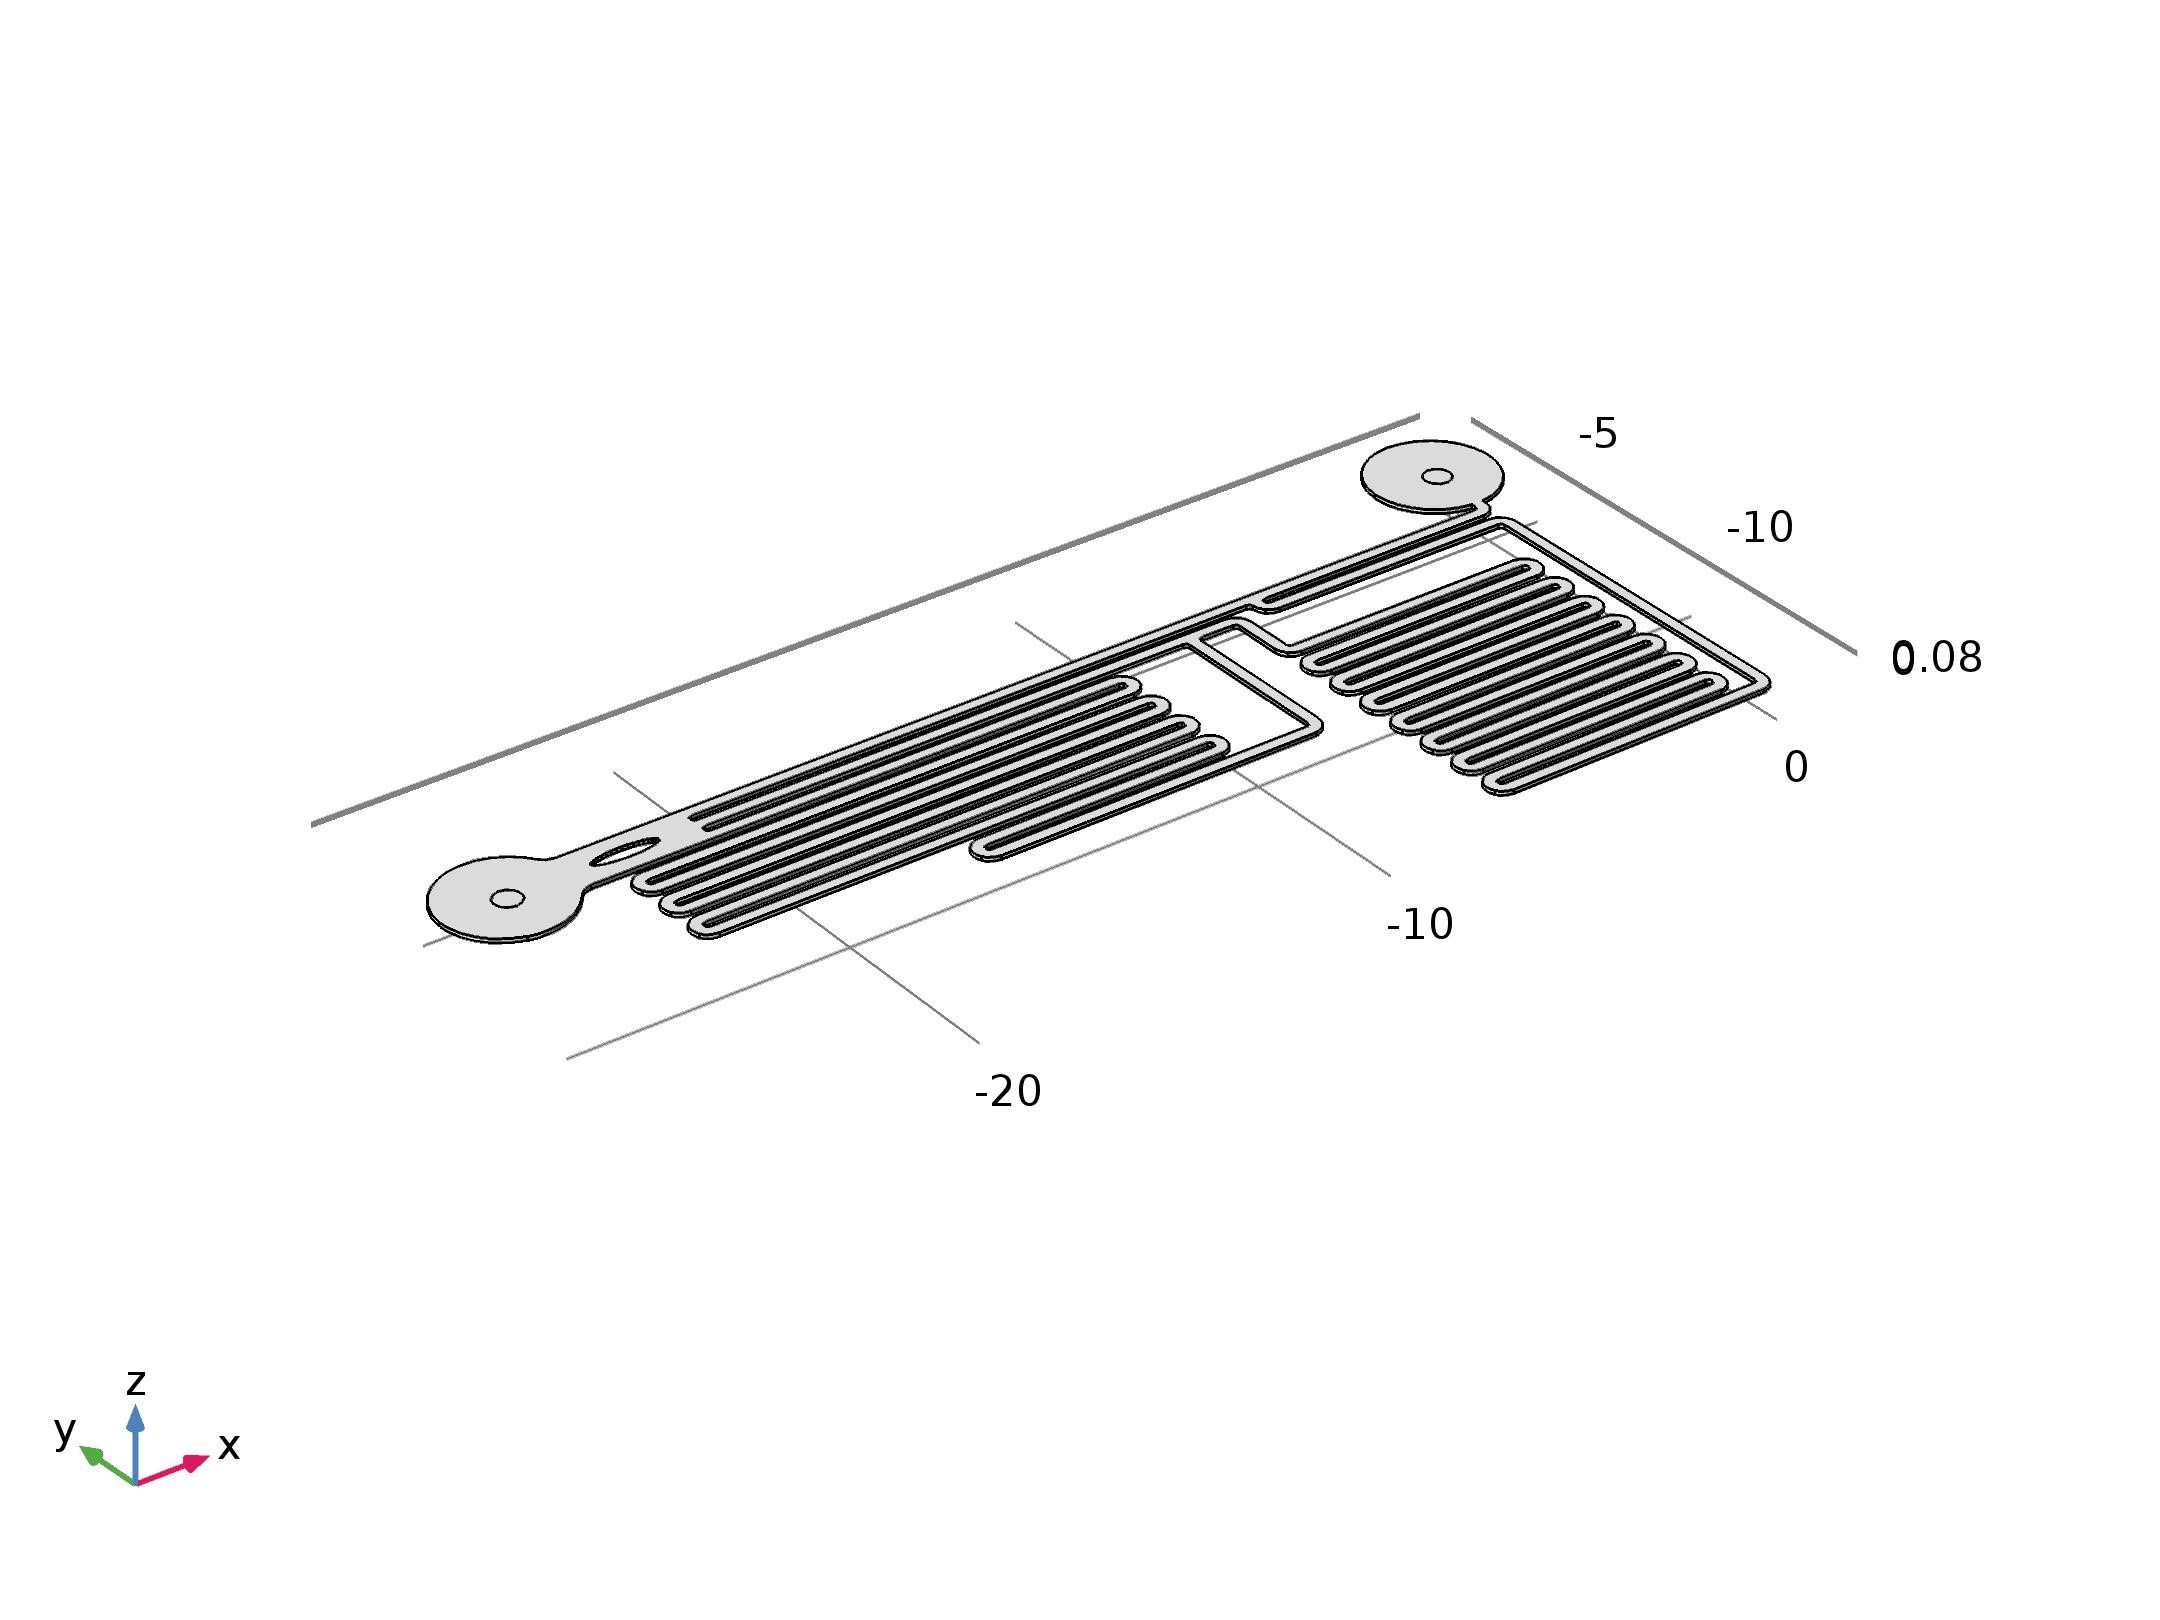
To further validate our design, we also performed the simulation using the Finite Element Method (FEM) to confirm that the field in microfluidic channel satisfies our expectation. FEM is a method for modeling and simulating physics-based problems. It divides a large problem into smaller elements, these smaller elements will be solved separately and then be assembled backed to the original model. A collection of smaller elements is called a “mesh”, the “mesh” is constructed by numerous elements, the smaller the size of the element is, the finer the “mesh” is, and the more accurate will the result be. The final geometry set up can be seen from below (Fig.6). [8]
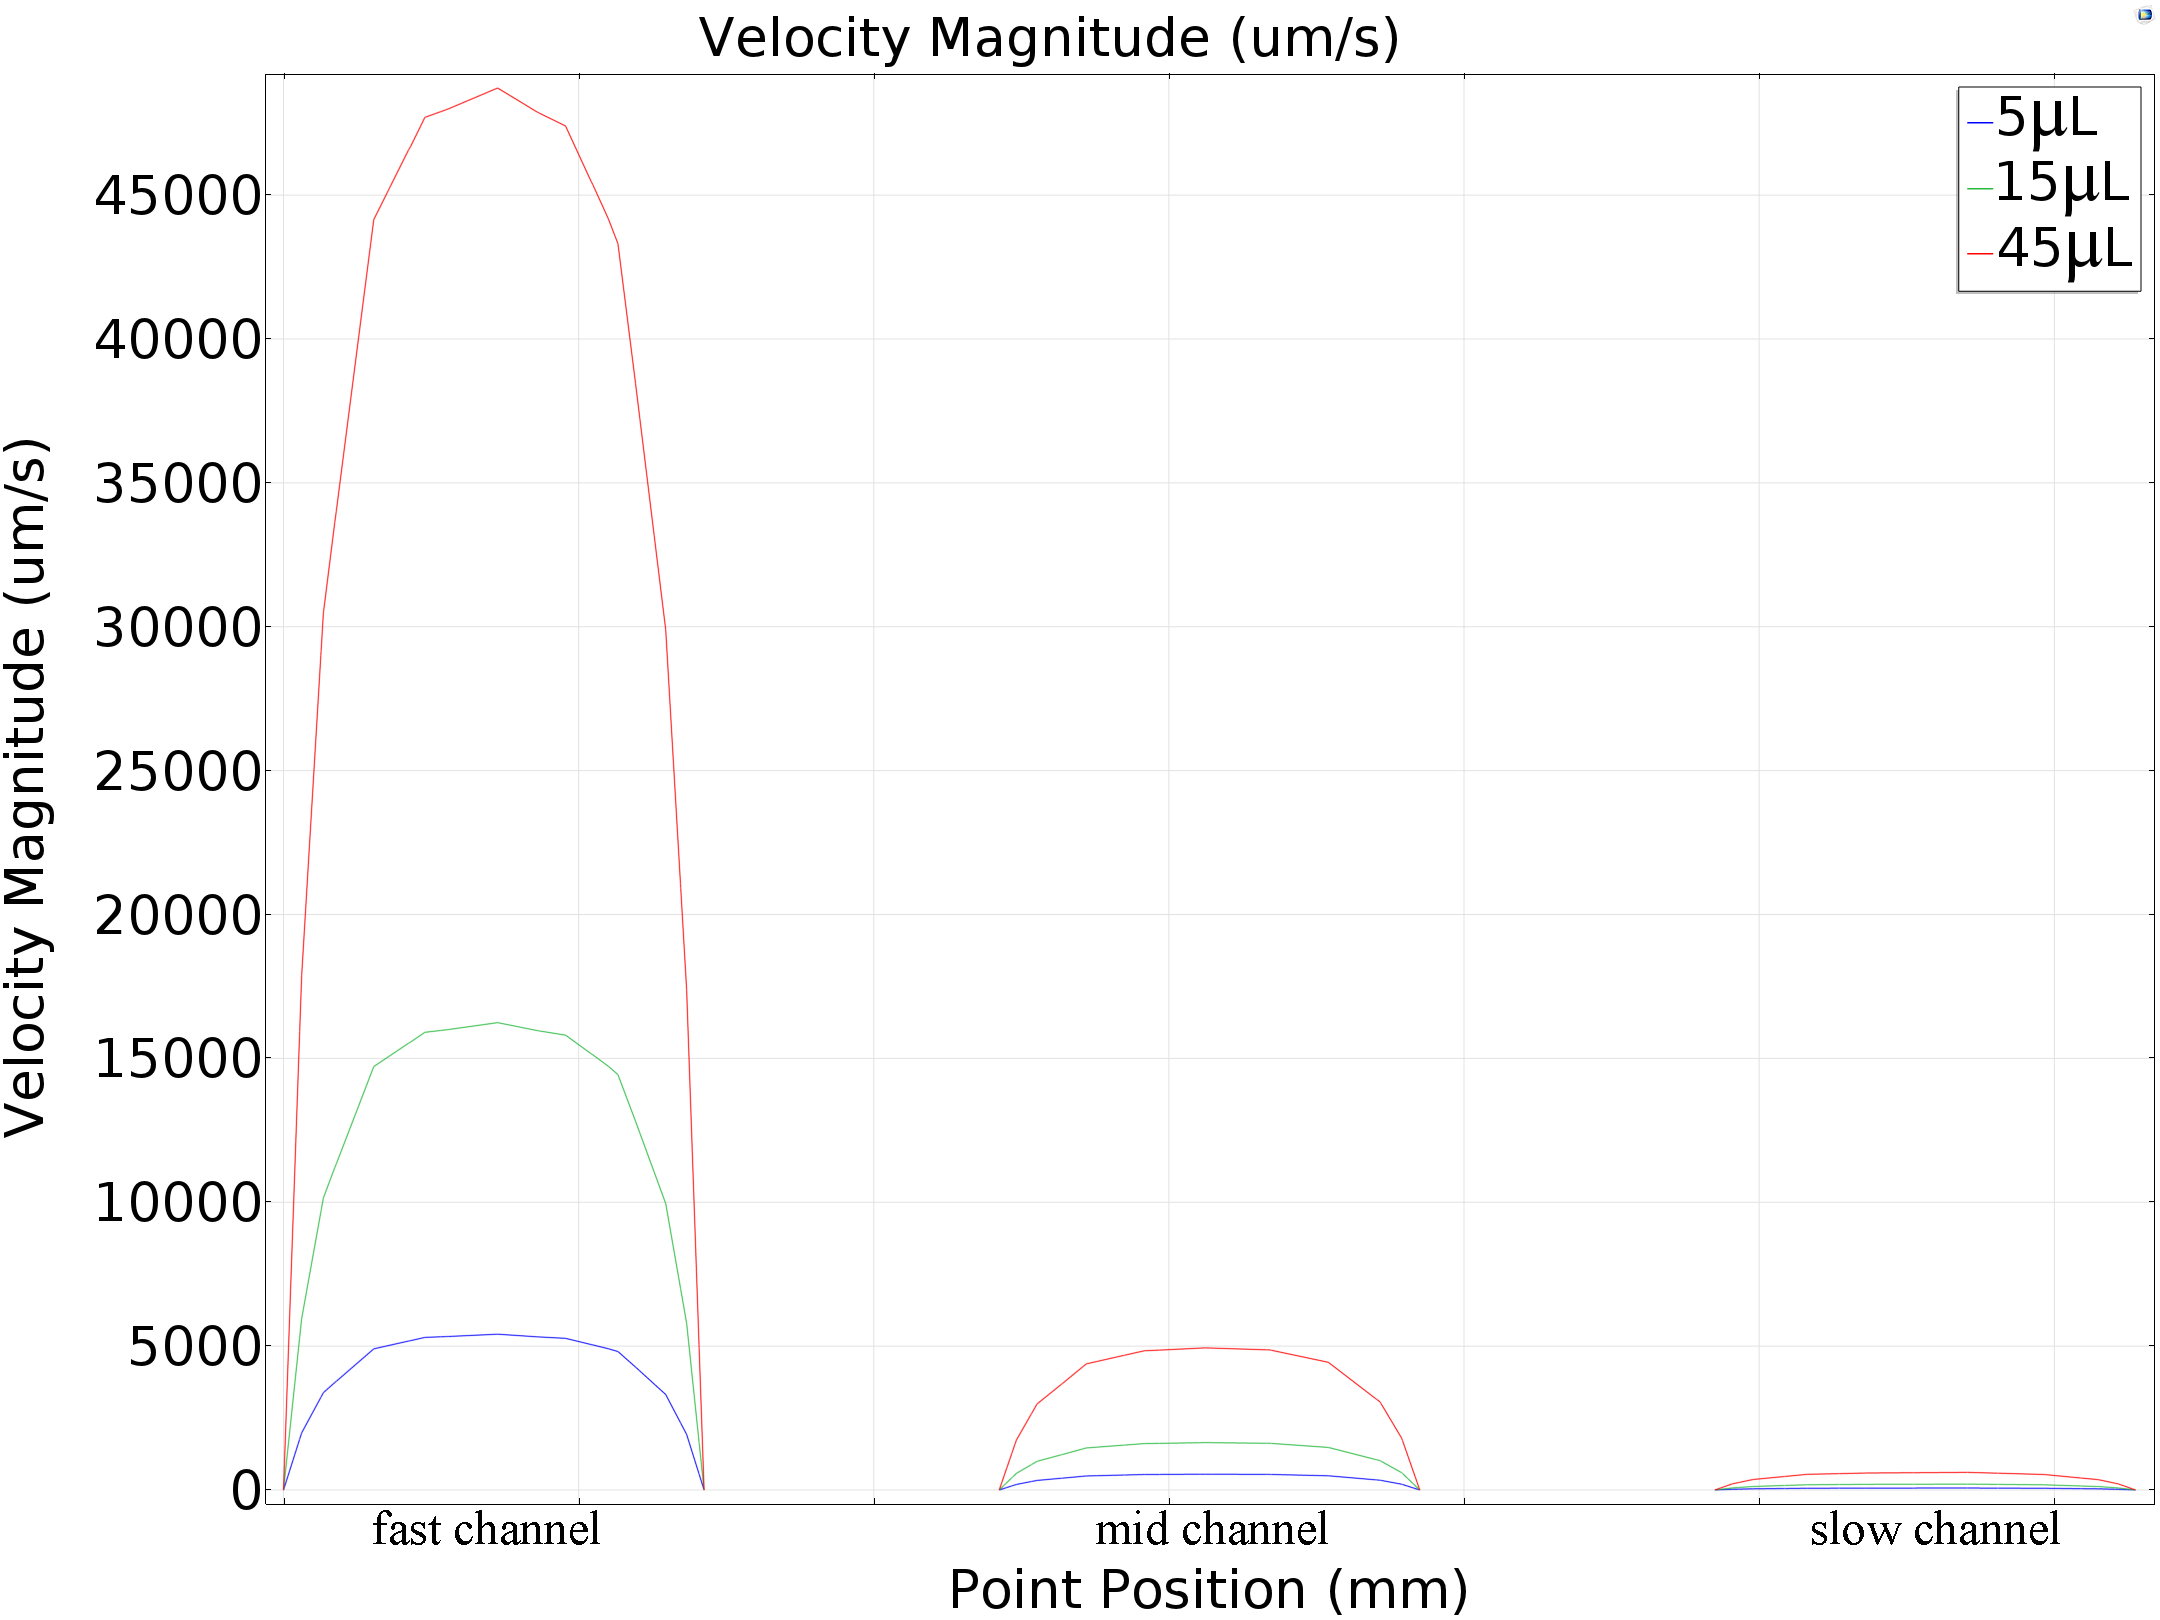
We calculated the velocity magnitude distribution was under different pumped inflow rates (5μL/min, 15μL/min and45μL/min). Results of maximum velocity and shear force that applied on the bottom matched the mathematics perfectly (around 80: 10: 1 in all the conditions, shown in the table below Fig.7).
|
Channel Flow Rate |
fast | middle | slow |
| 5μL/min | 5414μm/s | 549μm/s | 68μm/s |
| 15μL/min | 16242μm/s | 1646μm/s | 204μm/s |
| 45μL/min | 48724μm/s | 4938μm/s | 612μm/s |
Table 1 Simulation results of central line speed of each channel
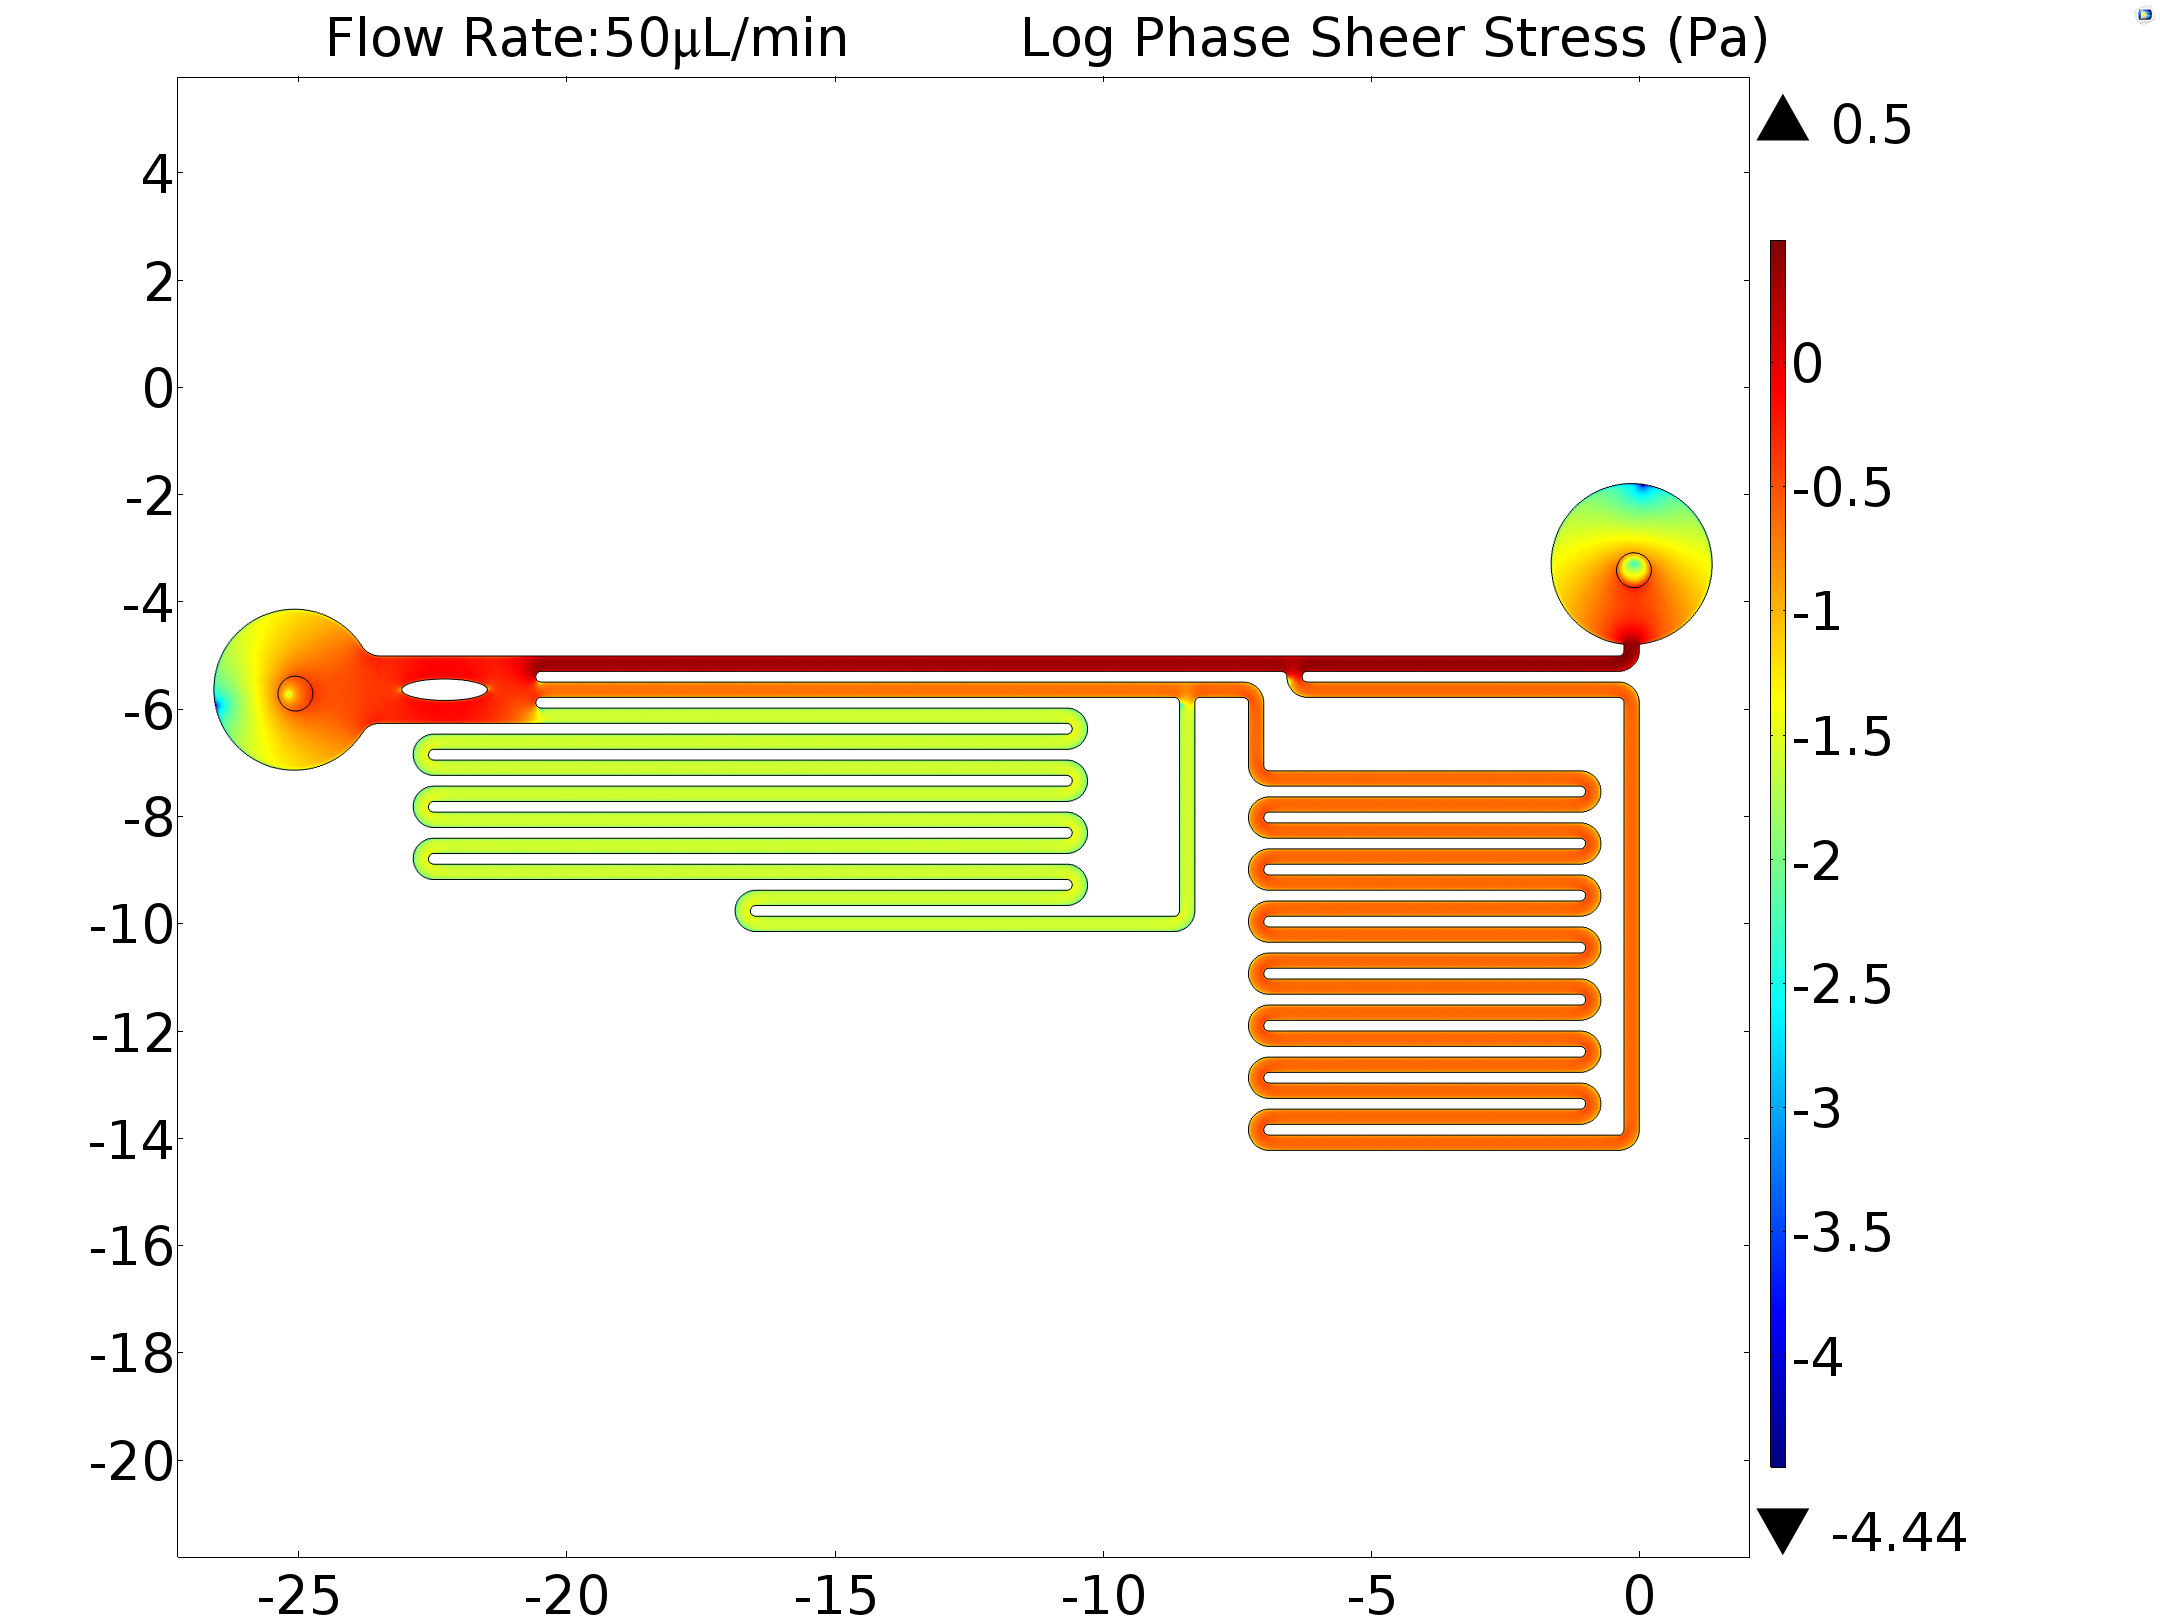
Results of mathematical demonstration (1: 9: 81), calibration (13: 100: 978) and simulation (1: 10: 80) are consistent with each other. This shows that the model is feasible for estimating the shear force that generated by microfluidics on cell membrane. In order to obtain the exact shear force, we inputted the experimentally used flow rate as a boundary condition (6.25μL/min,50μL/min) in our model. The shear stress was also calculated.
|
Channel Flow Rate |
fast | middle | slow |
| 6.25μL/min | 1.08Pa | 0.108Pa | 0.0033Pa |
| 50μL/min | 2.15Pa | 0.216Pa | 0.026Pa |
Table 2 Simulation results of central shear stress
Data Analysis Method And Software
Because most MS channels are permeable for calcium ion after activated, here we used a genetically encoded calcium indicator, R-GECO, for real-time and quantitatively measurement of intracellular calcium level. R-GECO is an artificial calcium indicator derived from GCaMP. After binding with calcium, it will emit red fluorescence at around 600nm [9]. Living cell imaging system (Nikon eclipse Ti) was used for time lapse fluorescent imaging recording the R-GECO fluorescence change when shear stress was applied on cells in microfluidics chips.
We chose five groups of cells in each observation channels (fast, mid and slow) and traced the changes of their mean fluorescence intensities of pixels over time. To reduce background noise on the analysis, we also chose a region with no cell as noise region to subtract the background fluorescence intensity for each image. In order to accurately and intuitively compare the fluorescence values changing over time, we normalized fluorescence intensity at the starting time to 0. Thus, we showed our data in the form of ΔF/F0. (ΔF: Increasing fluorescence value that relative to F0; F0: fluorescence value in the starting time point)
Result and interpretation
We obtained fluorescence images for Piezo1 channel, Piezo1 is a functionally diverse mechanosensitive cation channel. It plays significant role in multiple physiological processes, including sensing touching and shear stress of blood flow for proper blood vessel development, regulating red blood cell functions and controlling cell migration as well as differentiation. [10]
With the increasing importance of Mechanical sensing ion in pathology (many diseases are associated with them, including cardiac arrhythmia (such as atrial fibrillation)[11] cardiac hypertrophy, Duchenne muscular dystrophy, and other cardiovascular diseases[12]), there may be more and more researches that focus on it in the future. We hope that this preliminary exploration with quantitative measurement of MS channel’s sensibility will provide people with a better understand in the functions and mechanisms of it.
References
- ↑ Gottlieb, P.A., Cell biology: The sensation of stretch., Nature, Retrieved from https://www.researchgate.net/publication/221685148_Cell_biology_The_sensation_of_stretch.
- ↑ Markin, V.S., et al., Thermodynamics of mechanosensitivity., Phys Biol, Retrieved from https://www.ncbi.nlm.nih.gov/pubmed/16204828.
- ↑ Ranade, S.S., et al., Piezo1, a mechanically activated ion channel, is required for vascular development in mice., Proc Natl Acad Sci U S A, Retrieved from https://www.ncbi.nlm.nih.gov/pubmed/24958852.
- ↑ Shen, B., et al., Plasma membrane mechanical stress activates TRPC5 channels., PLoS One, Retrieved from https://www.ncbi.nlm.nih.gov/pubmed/25849346.
- ↑ Li, J., et al., Piezo1 integration of vascular architecture with physiological force., Nature, Retrieved from http://www.nature.com/nature/journal/v515/n7526/full/nature13701.html.
- ↑ Maneshi, M.M., F. Sachs, and S.Z. Hua, A Threshold Shear Force for Calcium Influx in an Astrocyte Model of Traumatic Brain Injury., J Neurotrauma, Retrieved from https://www.ncbi.nlm.nih.gov/pubmed/25442327.
- ↑ Booth R, Kim H., Characterization of a microfluidic in vitro model of the blood-brain barrier (μBBB)., Lab Chip., Retrieved from https://www.ncbi.nlm.nih.gov/pubmed/22422217.
- ↑ Nogawa, A., Study on the dynamic behavior of mandibular distal-extension removable partial denture utilizing finite element method. 1. Introduction of two-dimensional non-linear analysis., Nihon Hotetsu Shika Gakkai Zasshi, Retrieved from https://www.researchgate.net/publication/20665887_Study_on_the_dynamic_behavior_of_mandibular_distal-extension_removable_partial_denture_utilizing_finite_element_method_1_Introduction_of_two-dimensional_non-linear_analysis.
- ↑ Zhao, Y., et al., An expanded palette of genetically encoded Ca(2)(+) indicators., Science, Retrieved from http://science.sciencemag.org/content/333/6051/1888.
- ↑ Ge, J., et al., Architecture of the mammalian mechanosensitive Piezo1 channel., Nature, Retrieved from http://www.nature.com/nature/journal/v527/n7576/full/nature15247.html.
- ↑ Sachs, F., Stretch-activated ion channels: what are they?, Physiology (Bethesda), Retrieved from http://physiologyonline.physiology.org/content/25/1/50.
- ↑ Inoue, R., Z. Jian, and Y. Kawarabayashi, Mechanosensitive TRP channels in cardiovascular pathophysiology., Pharmacol Ther, Retrieved from https://www.ncbi.nlm.nih.gov/pubmed/19501617.

