(Created page with "{{:Team:SUSTech_Shenzhen/removeStyles}} {{:Team:SUSTech_Shenzhen/themeCss}} {{:Team:SUSTech_Shenzhen/nav}} {{:Team:SUSTech Shenzhen/templates/page-header| url=wiki/images/1/17...") |
|||
| (7 intermediate revisions by 3 users not shown) | |||
| Line 12: | Line 12: | ||
Firstly, a function was studied to give pressure on the surface of the ultrasonic transducer-water interface knowing the input voltage. Based on the interface pressure and physical properties of device, we constructed FEA models to simulate the ultrasonic radiant pressure field of the cell layer. Pressure field was studied in conditions of diverse power and distance between transducer interface and cell layer. | Firstly, a function was studied to give pressure on the surface of the ultrasonic transducer-water interface knowing the input voltage. Based on the interface pressure and physical properties of device, we constructed FEA models to simulate the ultrasonic radiant pressure field of the cell layer. Pressure field was studied in conditions of diverse power and distance between transducer interface and cell layer. | ||
| − | + | {{SUSTech_Image | filename=T--SUSTech Shenzhen--GECO-PIEZO-Ultrasound.png | caption=Fig. 1 Cell fluorescence response for 108KHz stimulation. The stimulation began at 10s and lasts for 20s. The fluorescence intensity increased to more than 5 times stronger than background. | width=1000px}} | |
| − | + | ||
| − | Fig. 1 Cell fluorescence response for 108KHz stimulation. The stimulation began at 10s and lasts for 20s. The fluorescence intensity increased to more than 5 times stronger than background. | + | |
'''108KHz Ultrasonic Pressure Modeling''' | '''108KHz Ultrasonic Pressure Modeling''' | ||
| Line 20: | Line 18: | ||
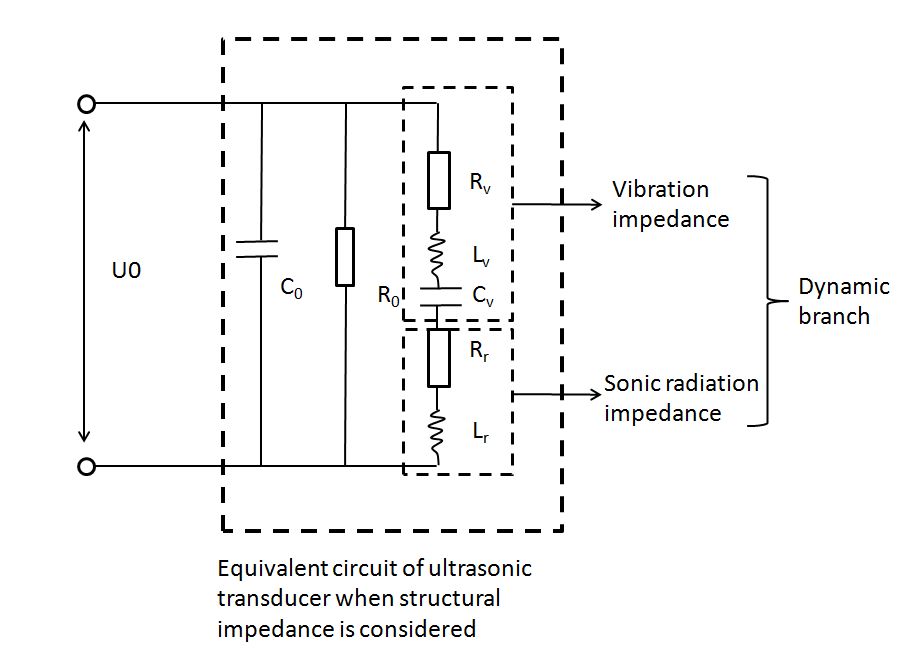
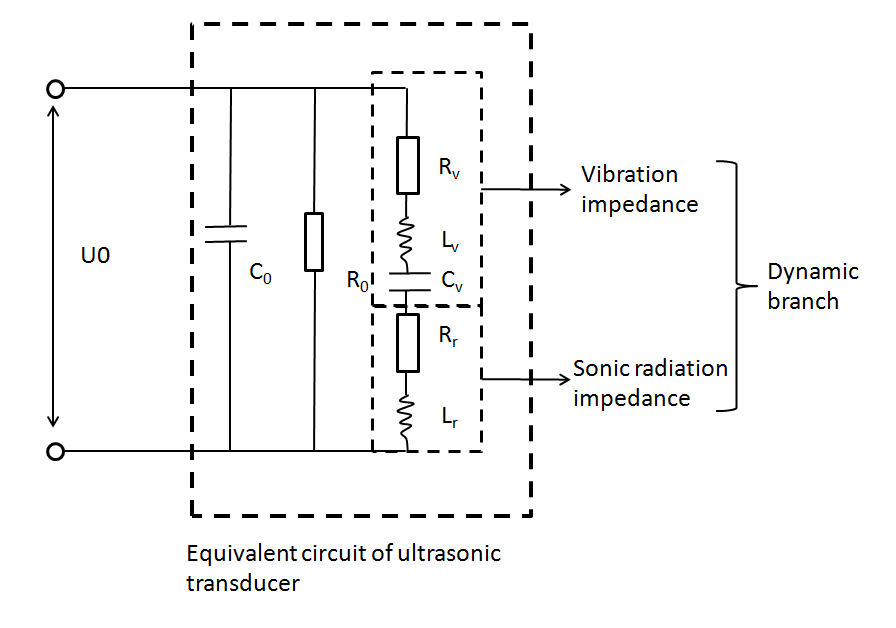
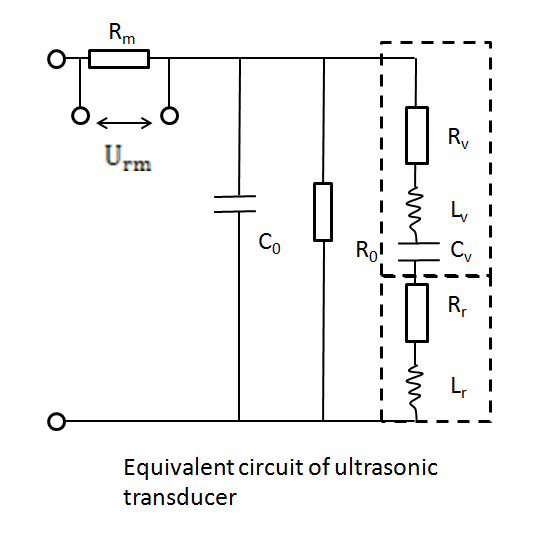
In this part, ultrasonic radiant pressure field for 108KHz transducer is modeled. In experiment, the 108KHz ultrasonic transducer was drenched into cell dish 1mm above cell layer for ultrasonic stimulation. The following is the equivalent circuit of an ultrasonic transducer. <ref name="moxip" /> | In this part, ultrasonic radiant pressure field for 108KHz transducer is modeled. In experiment, the 108KHz ultrasonic transducer was drenched into cell dish 1mm above cell layer for ultrasonic stimulation. The following is the equivalent circuit of an ultrasonic transducer. <ref name="moxip" /> | ||
| − | {{ | + | {{SUSTech_Image_Left | filename=T--SUSTech_Shenzhen--sound-modeling-det-2.png | caption='''Fig. 2''' A The equivalent circuit of ultrasonic transducer, for low power condition (<500W), R<sub>0</sub> is very large and C<sub>0</sub> very small. The ultrasoinc radiation power is consumed by sonic radiation impedance. Dielectric and mechanical power is consumed by vibration impedance.}}{{SUSTech_Image_Left | filename=T--SUSTech_Shenzhen--sound-modeling-det-3.png | caption='''Fig. 2''' B To measure the total power of transducer, U<sub>0</sub> and U<sub>rm</sub> in fig. B were measured using oscilloscope. Rm=100'''Ω.'''}} |
| − | + | ||
| − | '''Fig. 2''' A The equivalent circuit of ultrasonic transducer, for low power condition (<500W), R<sub>0</sub> is very large and C<sub>0</sub> very small. The ultrasoinc radiation power is consumed by sonic radiation impedance. Dielectric and mechanical power is consumed by vibration impedance. To measure the total power of transducer, U<sub>0</sub> and U<sub>rm</sub> in fig. B were measured using oscilloscope. Rm=100'''Ω.''' | + | |
To calculate the power of transducer, we measured voltages using oscilloscope. | To calculate the power of transducer, we measured voltages using oscilloscope. | ||
| Line 34: | Line 30: | ||
Thus, the effective voltage was | Thus, the effective voltage was | ||
| − | < | + | {{SUSTech_Shenzhen/bmath|equ=<nowiki>U_{\text{rm}} = \frac{1}{2T}\int_{0}^{\frac{T}{2}}{U_{\text{rm}}\text{dt}}</nowiki>}} |
| − | < | + | {{SUSTech_Shenzhen/bmath|equ=<nowiki>U_{\text{rm}} = \frac{1}{4T}\int_{0}^{\frac{T}{4}}{\frac{{4tU}_{p - p}}{T}\text{dt}}</nowiki>}} |
So, | So, | ||
| − | < | + | {{SUSTech_Shenzhen/bmath|equ=<nowiki>U_{\text{rm}} = \frac{U_{p - p}}{4} = 8.8V</nowiki>}} |
The effective current I<sub>eff</sub> | The effective current I<sub>eff</sub> | ||
| − | < | + | {{SUSTech_Shenzhen/bmath|equ=<nowiki>I_{\text{eff}} = \frac{U_{\text{rm}}}{R_{m}} = \frac{8.8V}{100\Omega} = 88mA</nowiki>}} |
As U<sub>o</sub>= 79.6V, and its waveform was close to sinusoidal wave. We have effective power | As U<sub>o</sub>= 79.6V, and its waveform was close to sinusoidal wave. We have effective power | ||
| − | < | + | {{SUSTech_Shenzhen/bmath|equ=<nowiki>W_{\text{total}} = \frac{U_{0}I_{\text{eff}}}{\sqrt{2}} = 4.8W</nowiki>}} |
For ultrasonic transducer, not all power is sonic radiation power. | For ultrasonic transducer, not all power is sonic radiation power. | ||
| − | < | + | {{SUSTech_Shenzhen/bmath|equ=<nowiki>W_{\text{total}} = W_{a} + W_{\text{el}} + W_{\text{ml}}</nowiki>}} |
W<sub>a</sub> , W<sub>el</sub>, W<sub>ml</sub> are respectively radiation power, dielectric power and mechanical power.<ref name="lins">Lin, S., & Zhang, F. (2000). Measurement of ultrasonic power and electro-acoustic efficiency of high power transducers. Ultrasonics, 37(8), 549-554.</ref> | W<sub>a</sub> , W<sub>el</sub>, W<sub>ml</sub> are respectively radiation power, dielectric power and mechanical power.<ref name="lins">Lin, S., & Zhang, F. (2000). Measurement of ultrasonic power and electro-acoustic efficiency of high power transducers. Ultrasonics, 37(8), 549-554.</ref> | ||
| Line 60: | Line 56: | ||
Then, we have the acoustic power W<sub>a</sub> | Then, we have the acoustic power W<sub>a</sub> | ||
| − | < | + | {{SUSTech_Shenzhen/bmath|equ=<nowiki>W_{a} = \eta_{\text{ae}}W_{\text{total}} = 0.85 \times 4.8W = 4.1W</nowiki>}} |
We assume the ultrasonic energy was evenly distributed on the transducer interface, that is:<ref>SHA Zhen-Xiao, Simulation and Visualization of the Radiated acoustic Field of Ultrasonic Transducer. Nondestructive examination (NDE), 33(5),2-6</ref> | We assume the ultrasonic energy was evenly distributed on the transducer interface, that is:<ref>SHA Zhen-Xiao, Simulation and Visualization of the Radiated acoustic Field of Ultrasonic Transducer. Nondestructive examination (NDE), 33(5),2-6</ref> | ||
| Line 73: | Line 69: | ||
For the interface, we have power intensity I<sub>0</sub>: | For the interface, we have power intensity I<sub>0</sub>: | ||
| − | < | + | {{SUSTech_Shenzhen/bmath|equ=<nowiki>I_{0} = \frac{W_{a}}{\pi R^{2}} = \frac{4.1W}{\pi \times {(8.0 \times 10^{- 3})}^{2}} = 2.04W/\text{cm}^{2}</nowiki>}} |
According to power intensity and pressure relation: | According to power intensity and pressure relation: | ||
| − | < | + | {{SUSTech_Shenzhen/bmath|equ=<nowiki>I_{0} = \frac{{P_{0}}^{2}}{2c\rho}</nowiki>}} |
| − | In which P<sub>0</sub> , c, < | + | In which P<sub>0</sub> , c, {{SUSTech_Shenzhen/bmath|equ=<nowiki>\text{ρ\ }</nowiki>}}are respectively absolute pressure, acoustic velocity and water density. |
| − | < | + | {{SUSTech_Shenzhen/bmath|equ=<nowiki>P_{0} = \sqrt{2c\rho I_{0}} =</nowiki>}}ectively pressure on the transducer interface, sound speed in water, water density. We have, {{SUSTech_Shenzhen/bmath|equ=<nowiki>\sqrt{2 \times 1488 \times 1000 \times 2.04 \times 10^{4}}Pa = 2.46 \times 10^{5}\text{Pa}</nowiki>}} |
Finite element analysis (FEA) was used to simulate the absolute pressure field on the cell layer. The following are the parameters set for simulation: | Finite element analysis (FEA) was used to simulate the absolute pressure field on the cell layer. The following are the parameters set for simulation: | ||
| − | {| | + | {|class="table table-striped" |
! Parameter | ! Parameter | ||
! Value | ! Value | ||
| Line 99: | Line 95: | ||
|- | |- | ||
| P<sub>0</sub> | | P<sub>0</sub> | ||
| − | | < | + | | {{SUSTech_Shenzhen/bmath|equ=<nowiki>2.46 \times 10^{5}\text{Pa}</nowiki>}} |
| Pressure on transducer interface | | Pressure on transducer interface | ||
|- | |- | ||
| Line 109: | Line 105: | ||
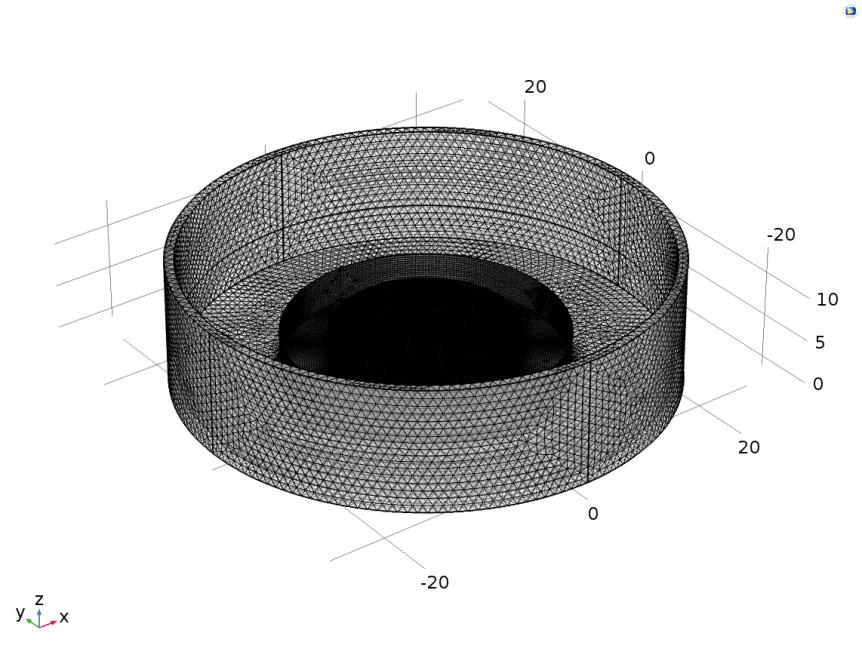
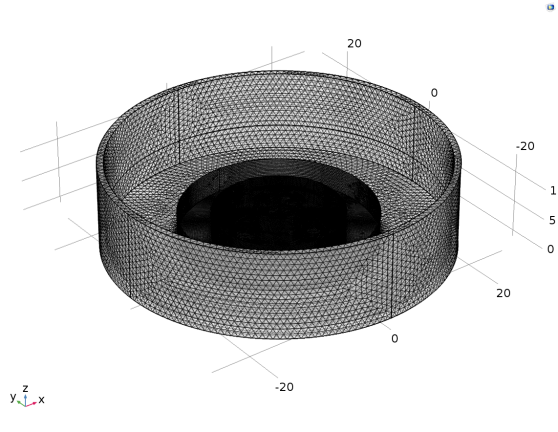
The mesh was set as following: | The mesh was set as following: | ||
| − | {{SUSTech_Image | filename=T--SUSTech_Shenzhen--sound-modeling-det-4.png}} | + | {{SUSTech_Image | filename=T--SUSTech_Shenzhen--sound-modeling-det-4.png | caption='''Fig. 3 Mesh for transducer drenched in cell dish, 1mm above cell layer.''}} |
| − | + | The region near the transducer was divided into very small grids keeping scale at least 5 times smaller than the wave length (1.5cm). While regions near the cell dish wall was modeled roughly for higher simulating speed. | |
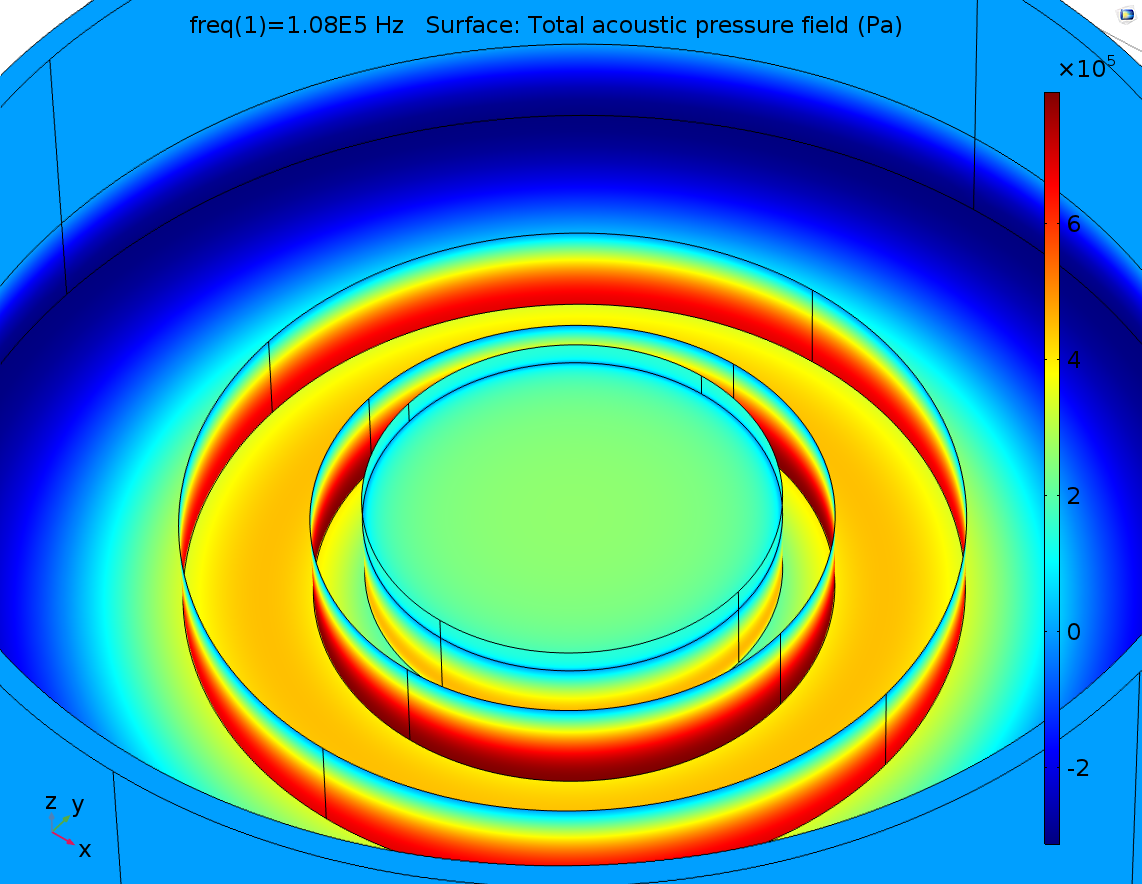
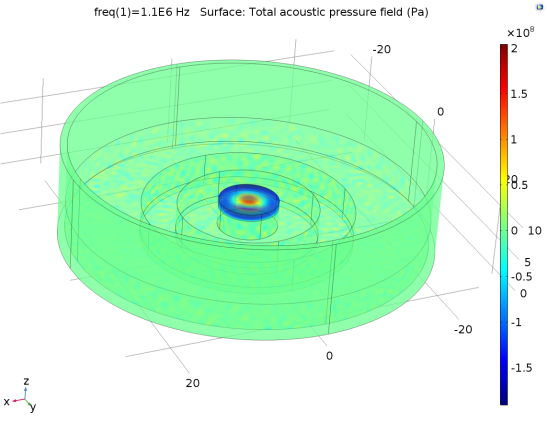
FEA simulation result: | FEA simulation result: | ||
| − | {{SUSTech_Image | filename=T--SUSTech_Shenzhen--sound-modeling-det-5.png}} | + | {{SUSTech_Image | filename=T--SUSTech_Shenzhen--sound-modeling-det-5.png | caption='''Fig. 4 3D pressure field distribution for 108KHz transducer device.'''}} |
| − | |||
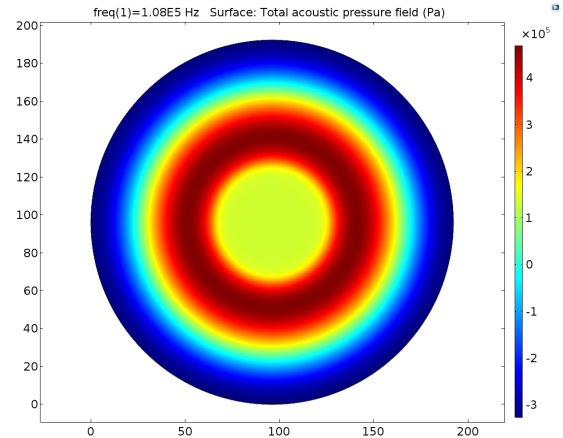
Pressure distribution on the bottom cell layer: | Pressure distribution on the bottom cell layer: | ||
| Line 123: | Line 118: | ||
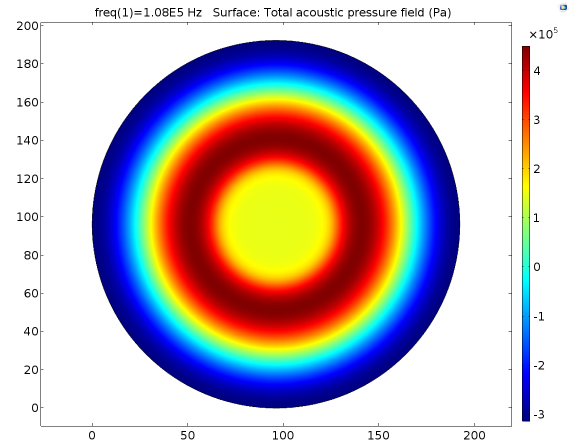
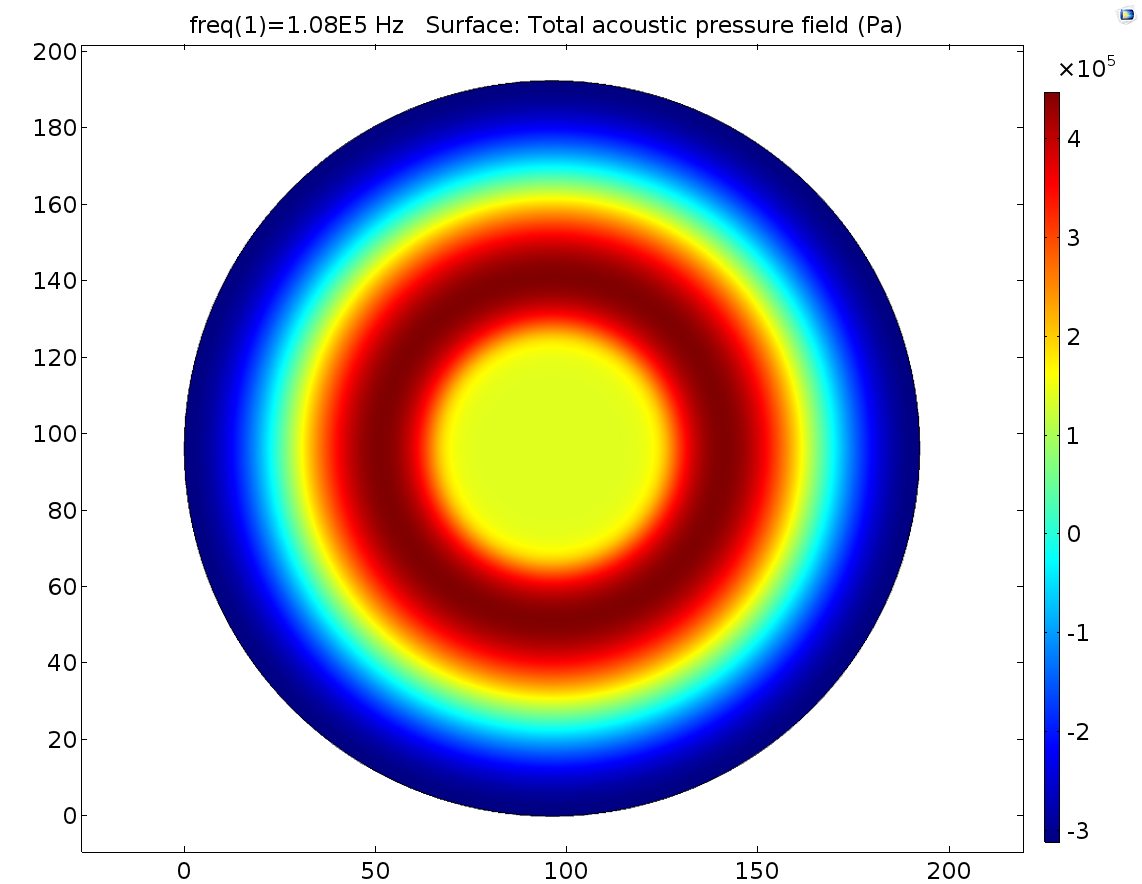
It was observed that pressure outside the transducer region reach a maximum value, which was not expected before simulation. In experiment we only observe the center of the cell dish that was just below the center of transducer. | It was observed that pressure outside the transducer region reach a maximum value, which was not expected before simulation. In experiment we only observe the center of the cell dish that was just below the center of transducer. | ||
| − | {{SUSTech_Image | filename=T--SUSTech_Shenzhen--sound-modeling-det-6.png}} | + | {{SUSTech_Image | filename=T--SUSTech_Shenzhen--sound-modeling-det-6.png | caption ='''Fig. 5 2D Pressure field distribution on the cell layer for 108KHz stimulation, and 251700 transducer-culture medium interface pressure.'''}} |
| − | |||
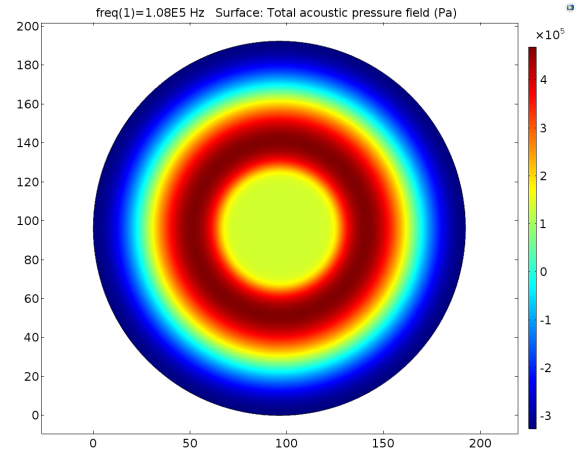
As the distance between transducer interface and cell layer may vary a little due to device configuration error, Pressure distribution patterns in condition of +-0.2mm distance error were also simulated to show the effect of distance error on pressure distribution pattern. | As the distance between transducer interface and cell layer may vary a little due to device configuration error, Pressure distribution patterns in condition of +-0.2mm distance error were also simulated to show the effect of distance error on pressure distribution pattern. | ||
| − | A {{ | + | A {{SUSTech_Image_Left | filename=T--SUSTech_Shenzhen--sound-modeling-det-7.png | caption='''Fig. 6 A''' | width=200}} B {{SUSTech_Image_Left | filename=T--SUSTech_Shenzhen--sound-modeling-det-8.png | caption='''Fig. 6 B''' | width=200}} C {{SUSTech_Image_Left | filename=T--SUSTech_Shenzhen--sound-modeling-det-9.png | caption='''Fig. 6 C''' | width=200}} |
Fig. 6 Pressure distribution of cell layer caused by 108KHz transducer, and its interface pressure were all set to be 251700Pa. The Transducer-water interface and cell layer were set as A 0.8mm, B 1.0mm, C 1.2mm respectively. The pressures of the center of cell layer were 1.35*10^5Pa, 1.40*10^5Pa, 1.48*10^5Pa respectively. So the error of distance for no more than 0.2mm may cause about 5.7% pressure change on the cell layer. | Fig. 6 Pressure distribution of cell layer caused by 108KHz transducer, and its interface pressure were all set to be 251700Pa. The Transducer-water interface and cell layer were set as A 0.8mm, B 1.0mm, C 1.2mm respectively. The pressures of the center of cell layer were 1.35*10^5Pa, 1.40*10^5Pa, 1.48*10^5Pa respectively. So the error of distance for no more than 0.2mm may cause about 5.7% pressure change on the cell layer. | ||
| Line 137: | Line 131: | ||
The pressure distribution of 1.1MHz ultrasonic transducer was also modeled. Unlike the model above that merely gives a pressure distribution in a certain power. This modeling gives a function between input voltage and ultrasonic pressure distribution pattern. The influence of distance error was also discussed in this modeling. The transducer we use had been calibrated that U=23V, I<sub>0</sub>=1.9W/cm<sup>2</sup> 3mm far from transducer surface. | The pressure distribution of 1.1MHz ultrasonic transducer was also modeled. Unlike the model above that merely gives a pressure distribution in a certain power. This modeling gives a function between input voltage and ultrasonic pressure distribution pattern. The influence of distance error was also discussed in this modeling. The transducer we use had been calibrated that U=23V, I<sub>0</sub>=1.9W/cm<sup>2</sup> 3mm far from transducer surface. | ||
| − | {{ | + | {{SUSTech_Image_Left | filename=T--SUSTech_Shenzhen--sound-modeling-det-10.png | caption='''Fig. 7 A''' | width=400}} {{SUSTech_Image_Left | filename=T--SUSTech_Shenzhen--sound-modeling-det-11.png | caption='''Fig. 7 B''' | width=400}} |
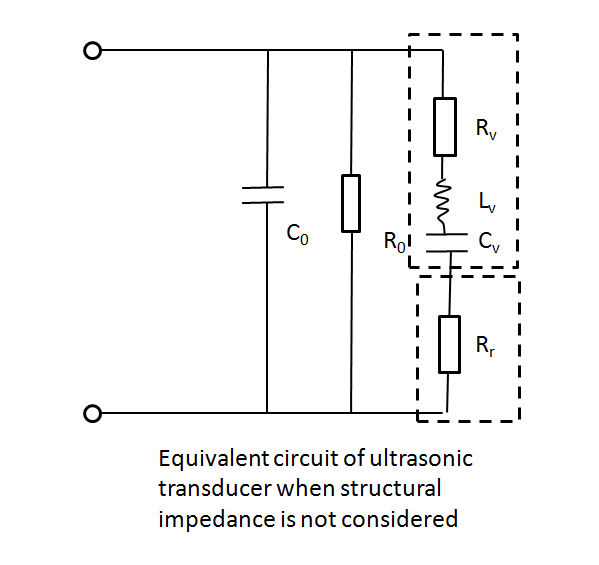
Fig. 7 Equivalent circuit of ultrasonic transducer in loading condition. A. Structural impedance is considered. B Structural impedance is considered. <ref name="moxip">MO Xi-ping (Institute of Acoustics,the Chinese Academy of Sciences,Beijing 100080,China);[http://en.cnki.com.cn/Article_en/CJFDTOTAL-SXJS200706047.htm Simulation and analysis of acoustics transducers using the ANSYS software][J];Technical Acoustics;2007-06</ref> | Fig. 7 Equivalent circuit of ultrasonic transducer in loading condition. A. Structural impedance is considered. B Structural impedance is considered. <ref name="moxip">MO Xi-ping (Institute of Acoustics,the Chinese Academy of Sciences,Beijing 100080,China);[http://en.cnki.com.cn/Article_en/CJFDTOTAL-SXJS200706047.htm Simulation and analysis of acoustics transducers using the ANSYS software][J];Technical Acoustics;2007-06</ref> | ||
| Line 145: | Line 139: | ||
The sonic radiation power W<sub>a</sub> is: | The sonic radiation power W<sub>a</sub> is: | ||
| − | < | + | {{SUSTech_Shenzhen/bmath|equ=<nowiki>W_{a} = \frac{U^{2}}{{(R_{v} + R_{r})}^{2}}R_{r}</nowiki>}} |
Ultrasound intensity: | Ultrasound intensity: | ||
| − | < | + | {{SUSTech_Shenzhen/bmath|equ=<nowiki>I_{0} = \frac{W_{a}}{\pi R^{2}}</nowiki>}} |
As we also have: | As we also have: | ||
| − | < | + | {{SUSTech_Shenzhen/bmath|equ=<nowiki>I_{0} = \frac{{P_{0}}^{2}}{2c\rho}</nowiki>}} |
| − | Let t=< | + | Let t={{SUSTech_Shenzhen/bmath|equ=<nowiki>\frac{R_{r}}{{(R_{v} + R_{r})}^{2}}</nowiki>}} |
| − | < | + | {{SUSTech_Shenzhen/bmath|equ=<nowiki>I = \frac{tU^{2}}{\pi R^{2}}</nowiki>}} |
According to the calibration: | According to the calibration: | ||
| Line 165: | Line 159: | ||
We have: | We have: | ||
| − | < | + | {{SUSTech_Shenzhen/bmath|equ=<nowiki>t = \frac{\pi R^{2}I}{U^{2}} = \frac{\pi \times {(4.25 \times 10^{- 3})}^{2} \times 1.9 \times 10^{4}}{23^{2}} = 2.038 \times 10^{- 3}\text{\ Ω}^{- 1}</nowiki>}} |
Here we assume the sound pressure 3mm far from the transducer interface is the same as that on the surface, which makes scene based on ANSYS simulation.<ref name="lins" /> | Here we assume the sound pressure 3mm far from the transducer interface is the same as that on the surface, which makes scene based on ANSYS simulation.<ref name="lins" /> | ||
| Line 171: | Line 165: | ||
So, | So, | ||
| − | < | + | {{SUSTech_Shenzhen/bmath|equ=<nowiki>p_{0} = \sqrt{\frac{2c\rho t}{\pi R^{2}}}U_{0} = \sqrt{\frac{2 \times 1488 \times 1000 \times 0.002038}{\pi \times {0.00425}^{2}}}U_{0} = 1.034 \times 10^{4}U_{0}\ Pa/V</nowiki>}} |
So we have pressure-voltage relationship: | So we have pressure-voltage relationship: | ||
| − | {| | + | {|class="table table-striped" |
! Voltage | ! Voltage | ||
! Pressure on transducer-water interface | ! Pressure on transducer-water interface | ||
| Line 195: | Line 189: | ||
Simulation parameters: | Simulation parameters: | ||
| − | {| | + | {|class="table table-striped" |
! Parameter | ! Parameter | ||
! Value | ! Value | ||
| Line 209: | Line 203: | ||
|- | |- | ||
| P<sub>0</sub> | | P<sub>0</sub> | ||
| − | | < | + | | {{SUSTech_Shenzhen/bmath|equ=<nowiki>2.38 \times 10^{5}\text{Pa}</nowiki>}} |
| Pressure on transducer interface | | Pressure on transducer interface | ||
|- | |- | ||
| | | | ||
| − | | < | + | | {{SUSTech_Shenzhen/bmath|equ=<nowiki>5.17 \times 10^{5}\text{Pa}</nowiki>}} |
| | | | ||
| Line 220: | Line 214: | ||
| | | | ||
| − | | < | + | | {{SUSTech_Shenzhen/bmath|equ=<nowiki>6.20 \times 10^{5}\text{Pa}</nowiki>}} |
| | | | ||
| Line 231: | Line 225: | ||
The mesh was set as following: | The mesh was set as following: | ||
| − | {{SUSTech_Image | filename=T--SUSTech_Shenzhen--sound-modeling-det-12.png}} | + | {{SUSTech_Image | filename=T--SUSTech_Shenzhen--sound-modeling-det-12.png | caption='''Fig. 8 Mesh established for 1.1MHz transducer stimulation model.''' }} |
| − | |||
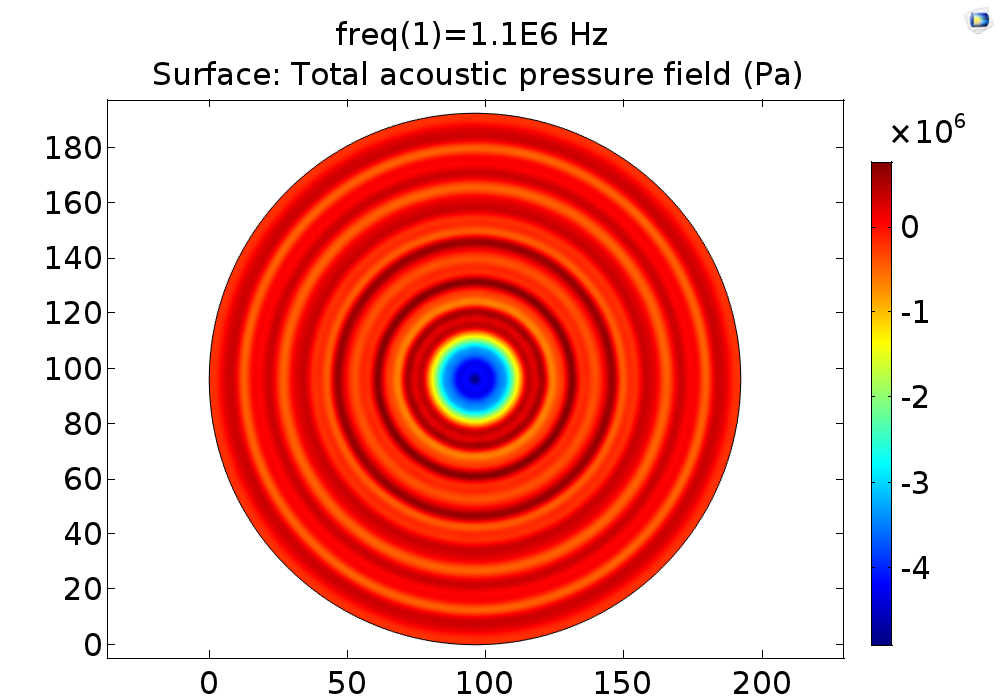
FEA simulation result: | FEA simulation result: | ||
| − | {{SUSTech_Image | filename=T--SUSTech_Shenzhen--sound-modeling-det-13.png}} | + | {{SUSTech_Image | filename=T--SUSTech_Shenzhen--sound-modeling-det-13.png | caption='''Fig. 9 3D pressure field distribution for 1.1MHz transducer device.'''}} |
| − | |||
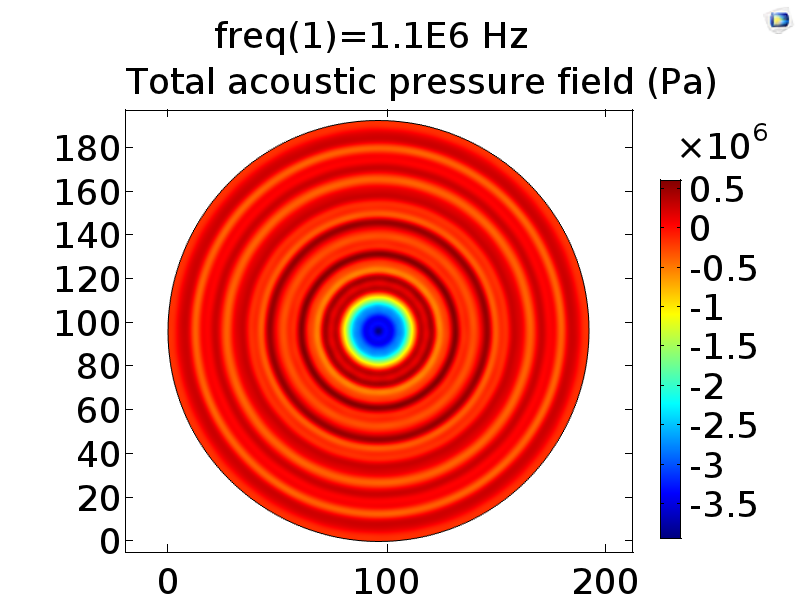
Pressure distribution on the bottom cell layer in conditions of different stimulation power: | Pressure distribution on the bottom cell layer in conditions of different stimulation power: | ||
| − | A {{ | + | A {{SUSTech_Image_Left | filename=T--SUSTech_Shenzhen--sound-modeling-det-14.png | caption='''Fig. 10 A''' | width=200}} B {{SUSTech_Image_Left | filename=T--SUSTech_Shenzhen--sound-modeling-det-15.png | caption='''Fig. 10 B''' | width=200}} |
| − | C {{ | + | C {{SUSTech_Image_Left | filename=T--SUSTech_Shenzhen--sound-modeling-det-16.png | caption='''Fig. 10 C''' | width=200}} |
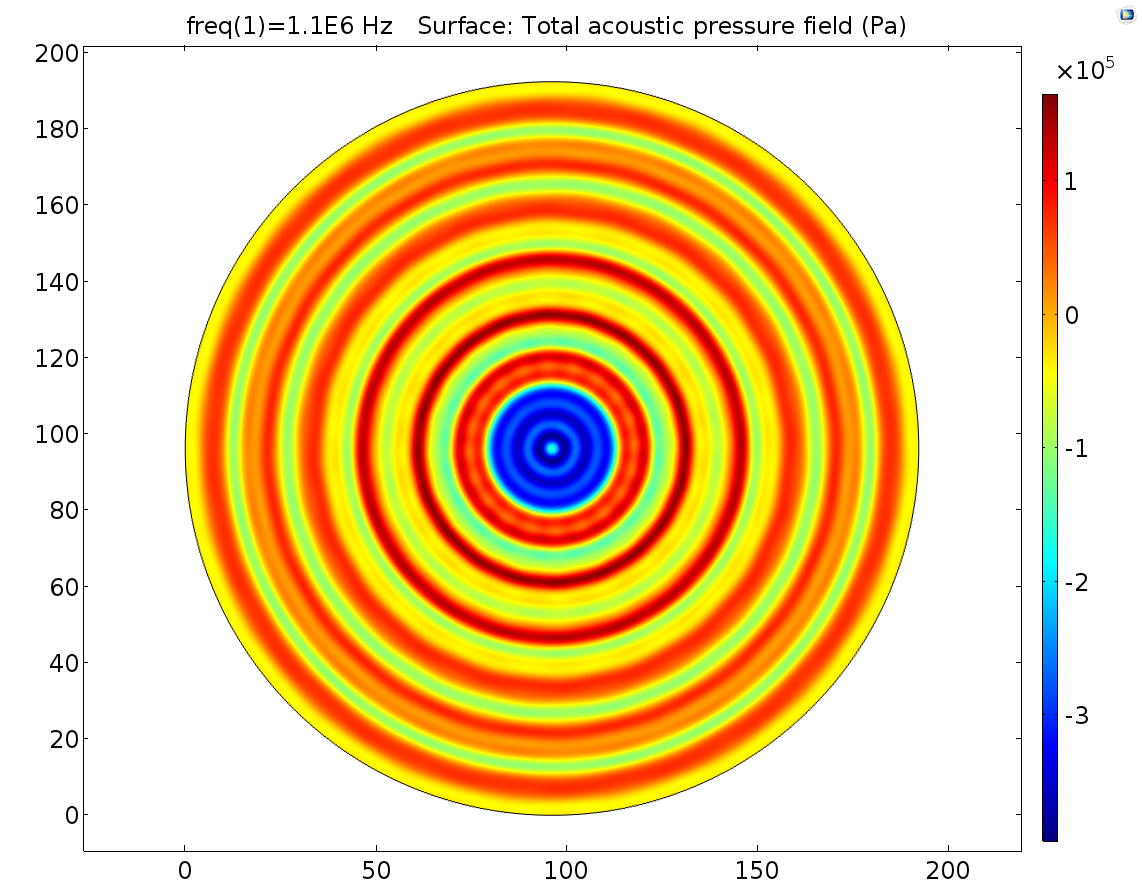
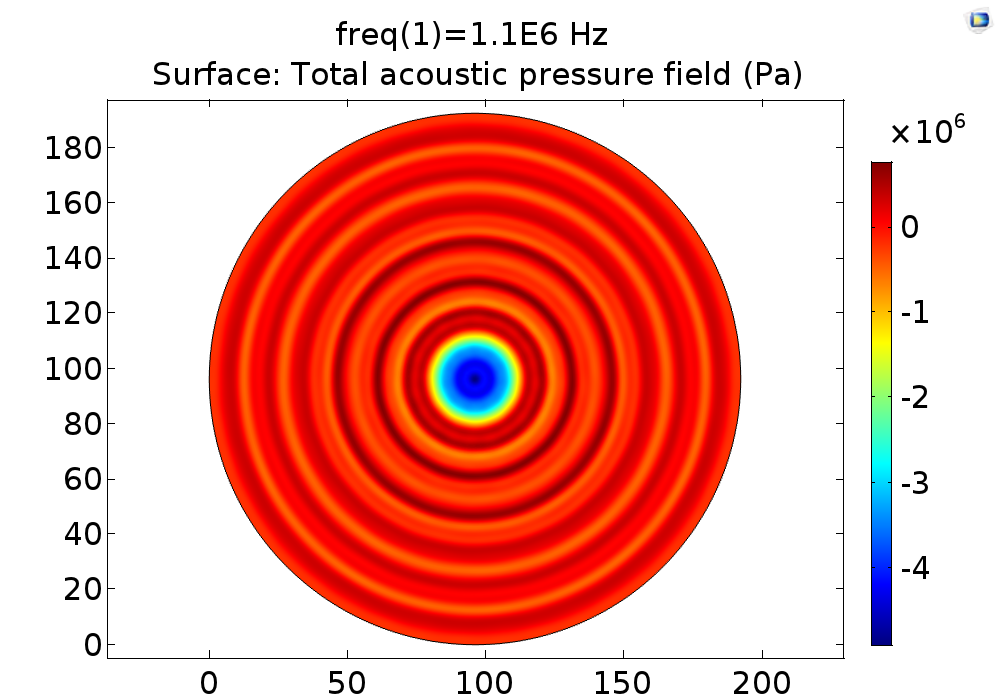
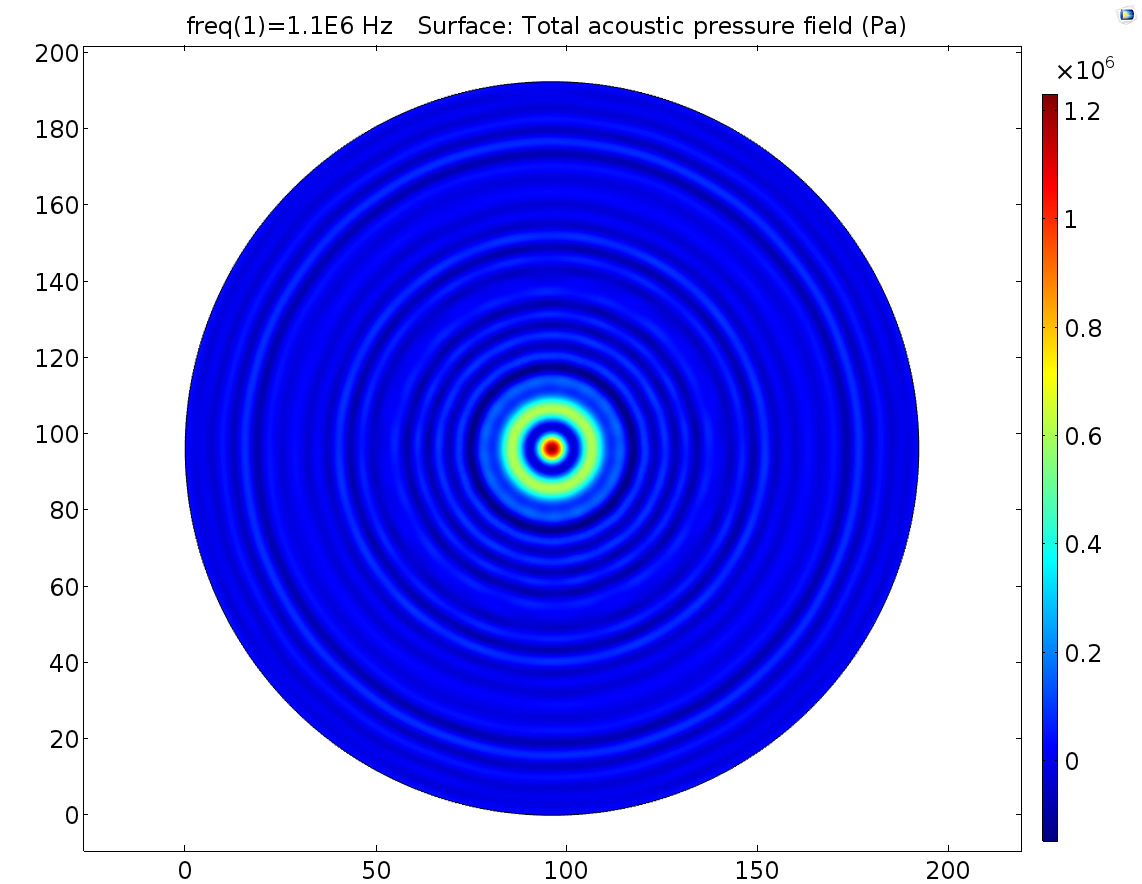
Fig. 10 Pressure field distribution on cell layer in conditions of 40V input, that is 4.2*10^5Pa on the transducer interface (A), 50V 5.3*10^5Pa (B), 60V 6.3*10^5Pa (C). It’s found that the increase of stimulation pressure does not change the pressure field distribution pattern and only the amplitude of pressure of each position was amplified proportionally to stimulation pressure. | Fig. 10 Pressure field distribution on cell layer in conditions of 40V input, that is 4.2*10^5Pa on the transducer interface (A), 50V 5.3*10^5Pa (B), 60V 6.3*10^5Pa (C). It’s found that the increase of stimulation pressure does not change the pressure field distribution pattern and only the amplitude of pressure of each position was amplified proportionally to stimulation pressure. | ||
| Line 250: | Line 242: | ||
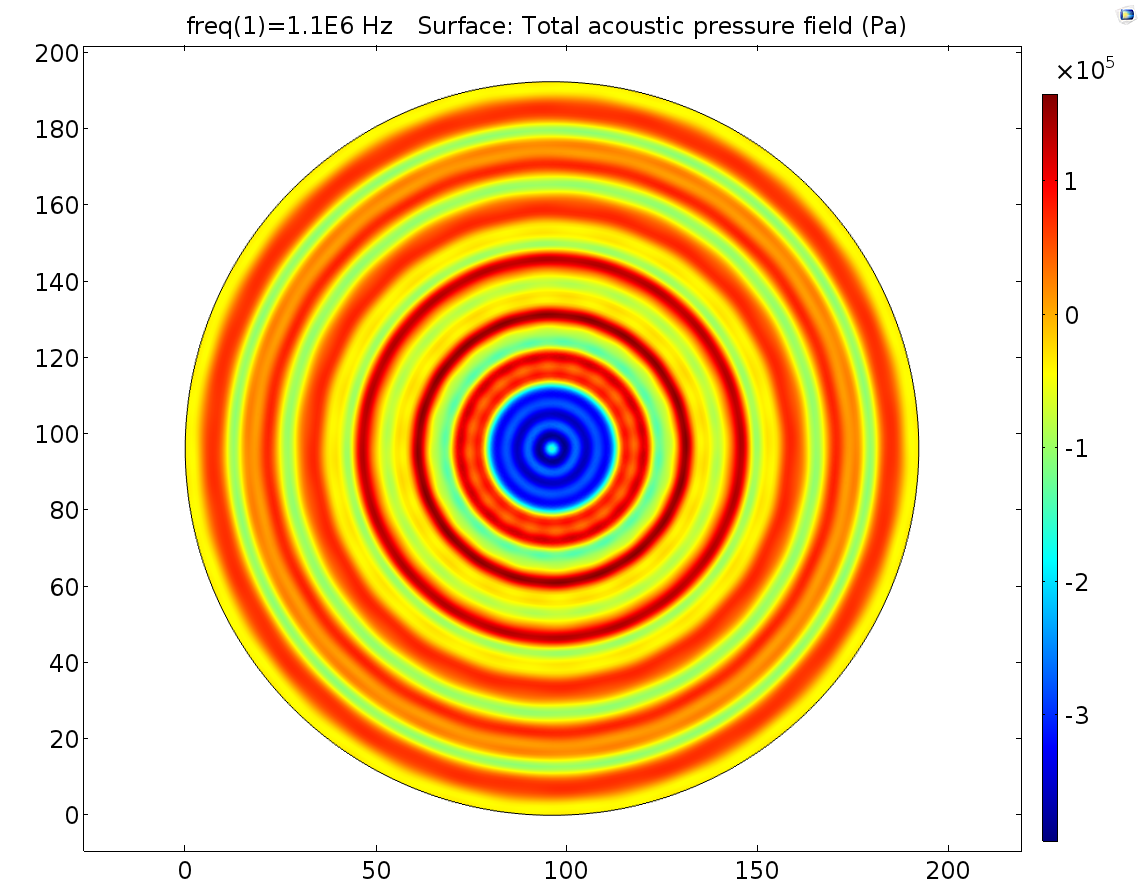
In experiment, it was impossible to keep the distance between transducer interface and cell layer being precisely 1.0mm. It’s important to study how sensitive the pressure field distribution was to the distance error. Thus, Pressure distribution patterns in condition of +-0.2mm distance error were simulated to show the influence of distance error on pressure distribution pattern. Here follows the simulation result. In these simulations, the transducer interface pressure and other parameters other than distance are all the same. | In experiment, it was impossible to keep the distance between transducer interface and cell layer being precisely 1.0mm. It’s important to study how sensitive the pressure field distribution was to the distance error. Thus, Pressure distribution patterns in condition of +-0.2mm distance error were simulated to show the influence of distance error on pressure distribution pattern. Here follows the simulation result. In these simulations, the transducer interface pressure and other parameters other than distance are all the same. | ||
| − | A {{ | + | A {{SUSTech_Image_Left | filename=T--SUSTech_Shenzhen--sound-modeling-det-17.png | caption='''Fig. 11 A, 0.8mm distance''' | width=200}} B {{SUSTech_Image_Left | filename=T--SUSTech_Shenzhen--sound-modeling-det-18.png | caption='''Fig. 11 B, 1.0mm distance''' | width=200}} C {{SUSTech_Image_Left | filename=T--SUSTech_Shenzhen--sound-modeling-det-19.png | caption='''Fig. 11 C, 1.2mm distance''' | width=200}} |
| − | Fig. 11 0.8mm distance and 1.2mm distance 2D cell dish. The distance in A is | + | Fig. 11 0.8mm distance and 1.2mm distance 2D cell dish. The distance in A is , in B is 1.0mm, in C is 1.2mm. Other parameters are all the same. |
From Fig. 11, we found that pressure distribution pattern of 1.1MHz ultrasound was a chaos. A little distance distortion can cause pressure distribution pattern changing greatly. The absolute pressure can’t be predicted by FEM simulation. 1.1MHz pressure is also not recommended for quantitative pressure-cell response relationship study. | From Fig. 11, we found that pressure distribution pattern of 1.1MHz ultrasound was a chaos. A little distance distortion can cause pressure distribution pattern changing greatly. The absolute pressure can’t be predicted by FEM simulation. 1.1MHz pressure is also not recommended for quantitative pressure-cell response relationship study. | ||
| − | |||
| − | |||
| − | |||
| − | |||
| − | |||
| − | |||
Conclusion: | Conclusion: | ||
| Line 268: | Line 254: | ||
= References = | = References = | ||
| − | < | + | <references /> |
Latest revision as of 03:55, 20 October 2016

Model
Sound Pressure Distribution
Contents
Introduction
Sonic and ultrasonic waves could generate a pressure field to the cells adhering to the bottom of the cell dish. In our study of the sensitivity of mechanosensitive (MS) channel, we really found a most efficient sound frequency using 108KHz ultrasonic transducer and around 80V driving voltage. However, to quantitatively define the relationship of channel opening (considering the influence of energy or force difference), it was important to know the pressure field distribution on the cell layer with a certain device configuration. Mathematical analysis and finite element analysis (FEA) were used to define the modeling.
Firstly, a function was studied to give pressure on the surface of the ultrasonic transducer-water interface knowing the input voltage. Based on the interface pressure and physical properties of device, we constructed FEA models to simulate the ultrasonic radiant pressure field of the cell layer. Pressure field was studied in conditions of diverse power and distance between transducer interface and cell layer.

108KHz Ultrasonic Pressure Modeling
In this part, ultrasonic radiant pressure field for 108KHz transducer is modeled. In experiment, the 108KHz ultrasonic transducer was drenched into cell dish 1mm above cell layer for ultrasonic stimulation. The following is the equivalent circuit of an ultrasonic transducer. [1]
To calculate the power of transducer, we measured voltages using oscilloscope.
Uo= 79.6V
Up-p=34.2V
Uo is the peak to peak voltage of transducer and its waveform was close to sinusoidal wave. Up-p is the peak to peak voltage between the two ends of Rm which was serial to the transducer, and its waveform was close to sinusoidal wave triangle wave.
Thus, the effective voltage was
U_{\text{rm}} = \frac{1}{2T}\int_{0}^{\frac{T}{2}}{U_{\text{rm}}\text{dt}}
U_{\text{rm}} = \frac{1}{4T}\int_{0}^{\frac{T}{4}}{\frac{{4tU}_{p - p}}{T}\text{dt}}
So,
U_{\text{rm}} = \frac{U_{p - p}}{4} = 8.8V
The effective current Ieff
I_{\text{eff}} = \frac{U_{\text{rm}}}{R_{m}} = \frac{8.8V}{100\Omega} = 88mA
As Uo= 79.6V, and its waveform was close to sinusoidal wave. We have effective power
W_{\text{total}} = \frac{U_{0}I_{\text{eff}}}{\sqrt{2}} = 4.8W
For ultrasonic transducer, not all power is sonic radiation power.
W_{\text{total}} = W_{a} + W_{\text{el}} + W_{\text{ml}}
Wa , Wel, Wml are respectively radiation power, dielectric power and mechanical power.[2]
According to references, we toke the acoustic-electric efficiencyηae=0.85.[2]
Then, we have the acoustic power Wa
W_{a} = \eta_{\text{ae}}W_{\text{total}} = 0.85 \times 4.8W = 4.1W
We assume the ultrasonic energy was evenly distributed on the transducer interface, that is:[3]
<math>I\left( x,y,z = 0 \right) = \left\{ \begin{matrix} I_{0},x^{2} + y^{2} \leq R^{2} \\ 0,x^{2} + y^{2} > R^{2} \\ \end{matrix} \right.\ </math>
Where I0 is the absolute ultrasound intensity, R is the radio of transducer interface, here R=8.0mm.
For the interface, we have power intensity I0:
I_{0} = \frac{W_{a}}{\pi R^{2}} = \frac{4.1W}{\pi \times {(8.0 \times 10^{- 3})}^{2}} = 2.04W/\text{cm}^{2}
According to power intensity and pressure relation:
I_{0} = \frac{{P_{0}}^{2}}{2c\rho}
In which P0 , c, \text{ρ\ }are respectively absolute pressure, acoustic velocity and water density.
P_{0} = \sqrt{2c\rho I_{0}} =ectively pressure on the transducer interface, sound speed in water, water density. We have, \sqrt{2 \times 1488 \times 1000 \times 2.04 \times 10^{4}}Pa = 2.46 \times 10^{5}\text{Pa}
Finite element analysis (FEA) was used to simulate the absolute pressure field on the cell layer. The following are the parameters set for simulation:
| Parameter | Value | Description |
|---|---|---|
| dis | 1.00mm | The distance between transducer interface and cell layer. |
| R | 8.00mm | Radio of transducer interface |
| P0 | 2.46 \times 10^{5}\text{Pa} | Pressure on transducer interface |
| F0 | 108KHz | Frequency |
The mesh was set as following:
The region near the transducer was divided into very small grids keeping scale at least 5 times smaller than the wave length (1.5cm). While regions near the cell dish wall was modeled roughly for higher simulating speed.
FEA simulation result:
Pressure distribution on the bottom cell layer:
It was observed that pressure outside the transducer region reach a maximum value, which was not expected before simulation. In experiment we only observe the center of the cell dish that was just below the center of transducer.
As the distance between transducer interface and cell layer may vary a little due to device configuration error, Pressure distribution patterns in condition of +-0.2mm distance error were also simulated to show the effect of distance error on pressure distribution pattern.
A
B CFig. 6 Pressure distribution of cell layer caused by 108KHz transducer, and its interface pressure were all set to be 251700Pa. The Transducer-water interface and cell layer were set as A 0.8mm, B 1.0mm, C 1.2mm respectively. The pressures of the center of cell layer were 1.35*10^5Pa, 1.40*10^5Pa, 1.48*10^5Pa respectively. So the error of distance for no more than 0.2mm may cause about 5.7% pressure change on the cell layer.
1.1MHz ultrasonic Pressure Modeling
The pressure distribution of 1.1MHz ultrasonic transducer was also modeled. Unlike the model above that merely gives a pressure distribution in a certain power. This modeling gives a function between input voltage and ultrasonic pressure distribution pattern. The influence of distance error was also discussed in this modeling. The transducer we use had been calibrated that U=23V, I0=1.9W/cm2 3mm far from transducer surface.
Fig. 7 Equivalent circuit of ultrasonic transducer in loading condition. A. Structural impedance is considered. B Structural impedance is considered. [1]
When the structural impedance is considered, the dynamic branch resistance is Rv+Rr. When the structural impedance is considered, the dynamic branch resistance is Rr.
The sonic radiation power Wa is:
W_{a} = \frac{U^{2}}{{(R_{v} + R_{r})}^{2}}R_{r}
Ultrasound intensity:
I_{0} = \frac{W_{a}}{\pi R^{2}}
As we also have:
I_{0} = \frac{{P_{0}}^{2}}{2c\rho}
Let t=\frac{R_{r}}{{(R_{v} + R_{r})}^{2}}
I = \frac{tU^{2}}{\pi R^{2}}
According to the calibration:
U=23V, I=1.9*10^4W/m^2
We have:
t = \frac{\pi R^{2}I}{U^{2}} = \frac{\pi \times {(4.25 \times 10^{- 3})}^{2} \times 1.9 \times 10^{4}}{23^{2}} = 2.038 \times 10^{- 3}\text{\ Ω}^{- 1}
Here we assume the sound pressure 3mm far from the transducer interface is the same as that on the surface, which makes scene based on ANSYS simulation.[2]
So,
p_{0} = \sqrt{\frac{2c\rho t}{\pi R^{2}}}U_{0} = \sqrt{\frac{2 \times 1488 \times 1000 \times 0.002038}{\pi \times {0.00425}^{2}}}U_{0} = 1.034 \times 10^{4}U_{0}\ Pa/V
So we have pressure-voltage relationship:
| Voltage | Pressure on transducer-water interface | Pressure distribution on cell layer. |
|---|---|---|
| 23V | 2.378*10^5Pa | Fig. 10 A |
| 50V | 5.17*10^5Pa | Fig. 10 B |
| 60V | 6.20*10^5Pa | Fig. 10 C |
Simulation parameters:
| Parameter | Value | Description |
|---|---|---|
| Dis | 1.00mm | The distance between transducer interface and cell layer. |
| R | 4.25mm | Radio of transducer interface |
| P0 | 2.38 \times 10^{5}\text{Pa} | Pressure on transducer interface |
| 5.17 \times 10^{5}\text{Pa} | ||
| 6.20 \times 10^{5}\text{Pa} | ||
| F0 | 1.1MHz | Frequency |
The mesh was set as following:
FEA simulation result:
Pressure distribution on the bottom cell layer in conditions of different stimulation power:
A
B CFig. 10 Pressure field distribution on cell layer in conditions of 40V input, that is 4.2*10^5Pa on the transducer interface (A), 50V 5.3*10^5Pa (B), 60V 6.3*10^5Pa (C). It’s found that the increase of stimulation pressure does not change the pressure field distribution pattern and only the amplitude of pressure of each position was amplified proportionally to stimulation pressure.
In experiment, it was impossible to keep the distance between transducer interface and cell layer being precisely 1.0mm. It’s important to study how sensitive the pressure field distribution was to the distance error. Thus, Pressure distribution patterns in condition of +-0.2mm distance error were simulated to show the influence of distance error on pressure distribution pattern. Here follows the simulation result. In these simulations, the transducer interface pressure and other parameters other than distance are all the same.
A
B CFig. 11 0.8mm distance and 1.2mm distance 2D cell dish. The distance in A is , in B is 1.0mm, in C is 1.2mm. Other parameters are all the same.
From Fig. 11, we found that pressure distribution pattern of 1.1MHz ultrasound was a chaos. A little distance distortion can cause pressure distribution pattern changing greatly. The absolute pressure can’t be predicted by FEM simulation. 1.1MHz pressure is also not recommended for quantitative pressure-cell response relationship study.
Conclusion:
In this modeling, two ultrasonic devices were modeled to get the pressure field distribution for 108KHz and 1.1MHz frequencies. The pressure distribution of 108KHz transducer device is quite smooth and uniform just beneath the transducer interface. +-0.2mm/1mm (20%) displacement only leads to no more than 6% pressure change. While for 1.1MHz transducer stimulator, +-0.2mm displacement leads to completely different pressure field pattern. In all, the 108KHz ultrasonic transducer was recommended as ultrasonic stimulator for quantitative measure cell response.
References
- ↑ 1.0 1.1 MO Xi-ping (Institute of Acoustics,the Chinese Academy of Sciences,Beijing 100080,China);[http://en.cnki.com.cn/Article_en/CJFDTOTAL-SXJS200706047.htm Simulation and analysis of acoustics transducers using the ANSYS software][J];Technical Acoustics;2007-06
- ↑ 2.0 2.1 2.2 Lin, S., & Zhang, F. (2000). Measurement of ultrasonic power and electro-acoustic efficiency of high power transducers. Ultrasonics, 37(8), 549-554.
- ↑ SHA Zhen-Xiao, Simulation and Visualization of the Radiated acoustic Field of Ultrasonic Transducer. Nondestructive examination (NDE), 33(5),2-6

