| Line 114: | Line 114: | ||
We used incompressible laminar flow interface to simulate our experiment, and the equations that the interface used is shown below. | We used incompressible laminar flow interface to simulate our experiment, and the equations that the interface used is shown below. | ||
| − | {{SUSTech_Shenzhen/bmath|equ=<nowiki>\rho(\mathbf{u}\cdot \nabla)=\nabla \cdot [-p\mathbf I + \mu (\nabla \mathbf{u}+\nabla \mathbf{u^T})]+\mathbf{F} \\ | + | {{SUSTech_Shenzhen/bmath|equ=<nowiki>\begin{matrix}\rho(\mathbf{u}\cdot \nabla)=\nabla \cdot [-p\mathbf I + \mu (\nabla \mathbf{u}+\nabla \mathbf{u^T})]+\mathbf{F} \\ |
| − | \rho(\nabla)\cdot\mathbf{u}=0</nowiki>}} | + | \rho(\nabla)\cdot\mathbf{u}=0\end{matrix}</nowiki>}} |
All boundaries except the inlet and the outlet circles were set to be no slipping walls. | All boundaries except the inlet and the outlet circles were set to be no slipping walls. | ||
Revision as of 11:15, 17 October 2016

Model
Contents
Overview
When we were discovering audio-genetics, to find correspondences between our mechanosensitive(MS) channels and different sound wavelengths, we needed the support of modeling and logical result ascription besides constructing a huge mutagenesis library and testing them in vitro continuously, although it is already very hard to do. We designed the experiment based on the discovery of the mechanism of MS channel and applying it on the regulation of downstream gene expression. Modeling has been our guide throughout the project and we finally got the result we initially expected.
In one part, we employed microfluidics to realize the stable force field controlled by fluidic velocity. In-vitro experiments were operated on the designed chips. On the other hand, we used various devices to generate sound field and tested cell response in different conditions.
Finite Element Analysis (FEA) was applied to modeling of the field generated by the microfluidic devices and the acoustic stimulators. Modeling reliability has been tested and confirmed by comparing the calculated result with raw results from the experiments.
Force of Field
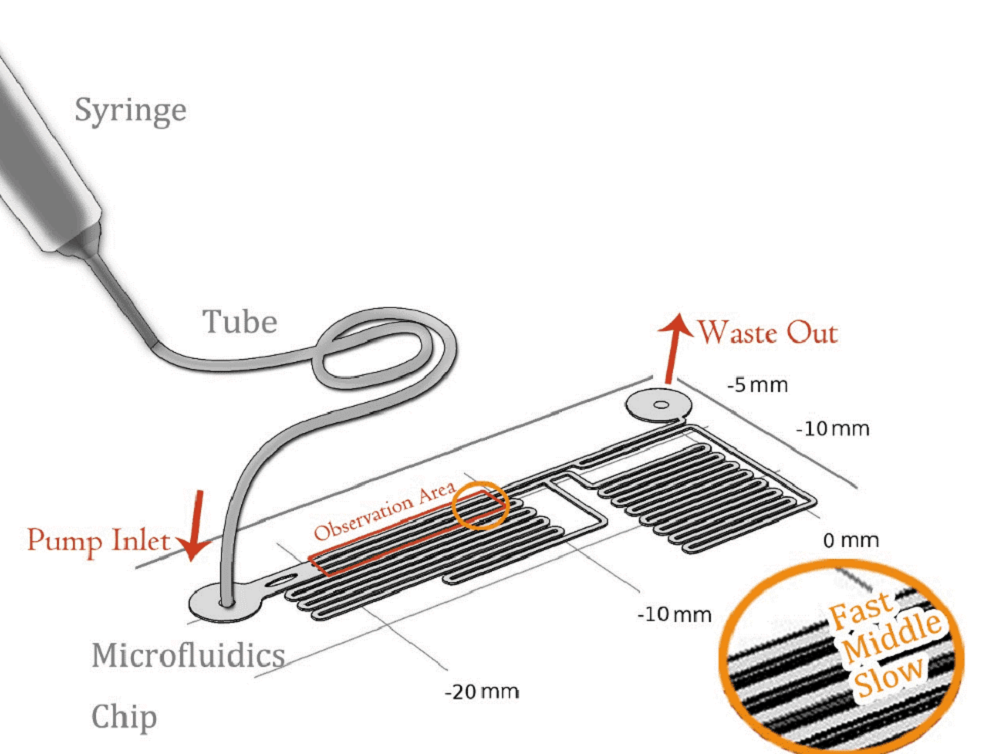
To quantitatively measure the response of MS channel on the cell membrane, we designed our experiment manipulated on microfluidic chip. CHO-K1 cells were cultured adherent on the bottom of PDMS tunnel. Stable and flexible force field could be formed surrounding cell, which directly controlled by the pumped-inflow rate. Each time when we applied a constant pumped inflow, cells in 3 different observation tunnel could receive corresponding small, middle, large, 3 level of force magnitude(1: 9: 81). By changing the pumped flow rate, we could measure MS channel response under a series of forces with different magnitude order.
Mathematical Demonstration
In experiment, when fluid(culture medium x flowed through the tunnel, the shear force was applied on the wall. Seeing the culture medium as a Newtonian flow, it has a constant viscosity μ,0.012dyn·s/cm2[1]. The shear stress that medium generated on the wall is proportional to strain rate. As a result, we could relate the magnitude of stress to the velocity gradient along the transversal surface of each tunnel.
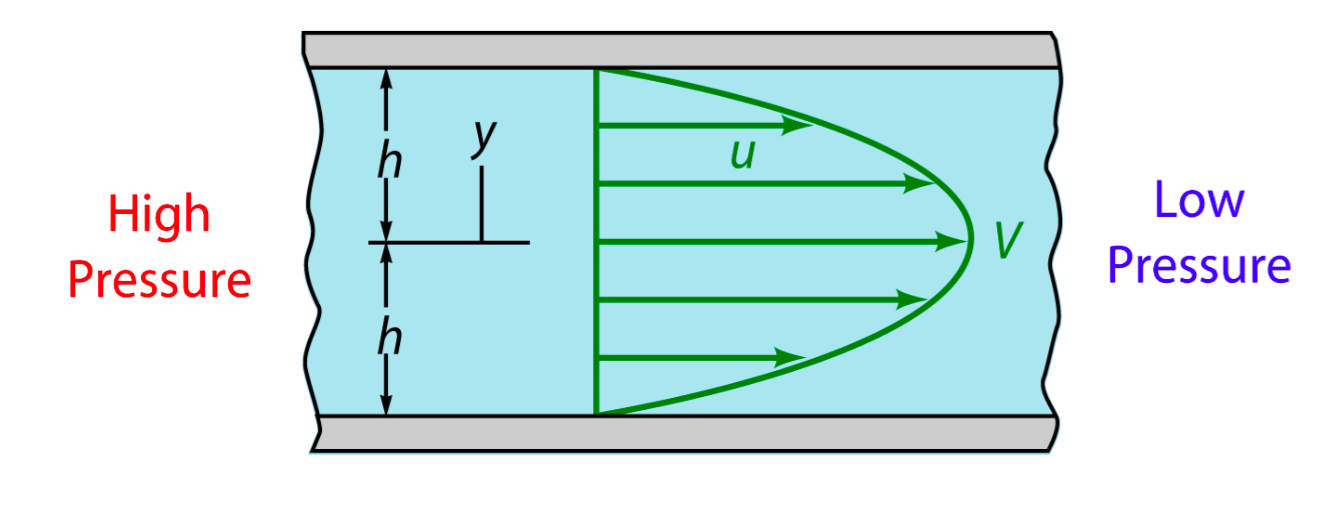
Due to the extremely small scale of microfluidic tunnel (only 0.285mm of width), fluid in it observes the Laminar flow. We could assume there is no turbulence when inflow applied constantly, even at the corners, and the head loss of the pumped inflow could also be ignored. The modeling of flow between 2 parallel plates applies to such stable state, in which the magnitude of shear stress on the bottom is proportional to the maximum velocity( at the longitudinal central line).
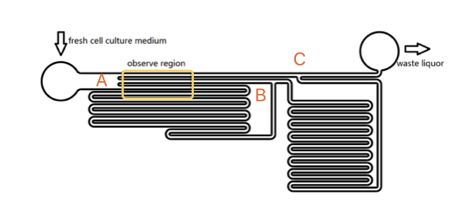
As the shear stress is proved proportional to the flow rate in the tunnel, we designed the chip to achieve that each of 3 tunnels in observation area has the same transversal surface but the gradient (81: 9: 1 from up to bottom) flow rate, also the average speed.
The lengths of straight tunnels between AB and AC (LAB, LAC)are 14.3mm and 12.0mm, and the curved tunnels between AB and BC(RAB, RBC) are 108.0 mm and 105.0mm.
Based on the integral form of the continuity equation for an incompressible fluid, during a given time, the sum of flow volume in each branch is equal to the total volume pumped in the whole chamber. According to the Kirchhoff's law, the accumulation of flow speed at the joint point must be zero. It is easy to get the equation that\begin{matrix} L_{AC}V_1=L_{AB}V_2+R_{AB} V_3 \\ V_2:V_3=R_{AB}:L_{AB} \end{matrix} Consequently, we could reach the conclusion that the maximum velocity, average flow rate and the shear force on the bottom of each tunnel is at a ratio of 81:9:1. To confirm the modeling result, we made calibration in real microfluidics chip, and the testing result is very close to designing value (about 80:10:1) (See the Measurement page)
Experimental result Analysis
On October 12th, we testify one of our MS channels, Piezo1, under the simulation of shear stress, with R-GECO fluorescent indicating its activation level. (results shown below)
Simulation
To make the analysis of experimental result is convincible, we also made the simulation using the Finite Element Method(FEM) to define that the field in microfluidic channel confirmed to our expectation.
FEM is a method for modeling and simulating physics-based problems. It divides a large problem into smaller elements, these smaller elements will be solved separately and then be assembled backed to the original model. A collection of smaller elements is called a “mesh”, the “mesh” is constructed by numerous elements, the smaller the size of the element is, the finer the “mesh” is, and the more accurate will the result be.
We made the simulation with the following procedures, and the result of maximum velocity and shear force applied on the bottom wall match with the mathematics perfectly.
a. Geometry
First we imported the designed CAD pattern file.
Then we draw two circles which have the diameter equal to the inner diameter of the fluid pipes that we used (0.65mm). The circles were placed around the center of the two circles we reserved for the fluid pipes. Since we used our bear hands to control the position of the holes for the fluid pipes in chip fabrication, the circles were just placed around the center parts like real cases.
Then we extruded the pattern to 90μm, and deleted the undesired parts. The final geometry was shown below.
b.Parameters
All geometry domains were applied with the build-in material "water" to represent the petro medium that we used in our experiment.
The material parameters can be seen from bellow.
| Description | Value |
| Dynamic viscosity | eta(T[1/K])[Pa*s] |
| Ratio of specific heats | 1.0 |
| Electrical conductivity | {{5.5e-6[S/m], 0, 0}, {0, 5.5e-6[S/m], 0}, {0, 0, 5.5e-6[S/m]}} |
| Heat capacity at constant pressure | Cp(T[1/K])[J/(kg*K)] |
| Density | rho(T[1/K])[kg/m^3] |
| Thermal conductivity | {{k(T[1/K])[W/(m*K)], 0, 0}, {0, k(T[1/K])[W/(m*K)], 0}, {0, 0, k(T[1/K])[W/(m*K)]}} |
| Speed of sound | cs(T[1/K])[m/s] |
Table 1 Material Properties of "water"
The parameters that we actually used was the dynamic viscosity (\eta(T)), and the density (\rho(T)). Their values with respect to the change of the temperature (K) can be seen form below.
\eta(T)=1.3799566804-0.021224019151*T^1+1.3604562827E-4*T^2-4.6454090319E-7*T^3+8.9042735735E-10*T^4-9.0790692686E-13*T^5+3.8457331488E-16*T^6 (273.15K\leq T\leq413.15K)
\eta(T)=0.00401235783-2.10746715E-5*T^1+3.85772275E-8*T^2-2.39730284E-11*T^3 (413.15 K\leq T \leq 553.75K)
rho(T)=838.466135+1.40050603*T^1-0.0030112376*T^2+3.71822313E-7*T^3 (273.15K\leq T \leq553.75K)
Since the temperature of our model is set to the reference temperature as 293.15K, the respect value of \eta(T) and \rho(T) are 0.00101 Pa*s and 999.61509 kg/m3.
We used incompressible laminar flow interface to simulate our experiment, and the equations that the interface used is shown below.
\begin{matrix}\rho(\mathbf{u}\cdot \nabla)=\nabla \cdot [-p\mathbf I + \mu (\nabla \mathbf{u}+\nabla \mathbf{u^T})]+\mathbf{F} \\ \rho(\nabla)\cdot\mathbf{u}=0\end{matrix}
All boundaries except the inlet and the outlet circles were set to be no slipping walls.
The inlet circle was given the velocity of 2.5113E-4 m/s, 7.534E-4 m/s and 0.0022602 m/s, which will give us the rate of flow values of 5μL/min, 15μL/min and 45μL/min.
The outlet circle was given the pressure of 0.
c. Mesh
Parameters of our mesh are shown below.
| Description | Value |
| Minimum element quality | 9.185E-4 |
| Average element quality | 0.4356 |
| Tetrahedral elements | 503702 |
| Pyramid elements | 260 |
| Prism elements | 363692 |
| Triangular elements | 182924 |
| Quadrilateral elements | 160 |
| Edge elements | 19326 |
| Vertex elements | 524 |
Table 2 Mesh Specifics
By choosing this mesh size, the mesh generated was fine enough to give six solution points with in the width of a single channel.
d. Solver Configuration
The solver was configured to compute for the stationary values under this specific model configuration. The relative tolerance was set to 0.000001, which means that the solver will only stop computing if the deviation of the result from the actual solution to the equations is under one in a million of the value of the actual solution.
e.Results
In the microfluidic channels the fluid will be applied a dragging force from the channel walls. So the fluid in the center line of the channel flows with the fastest speed.
In order to show the speed distribution inside the microfluidic channels, speed diagrams of the cut plane in the middle of the bottom plane and the top plane is shown below.
In order to further show the speed difference under three different parameters, we draw a line on the cut plane from (-16, -4) to (-16, -6.45) crossing through three microfluidic channels in the observation zone. and plot the flow speed on that line.
The speed at the central line in all three channels at three different flow rate is listed below.
|
Channel Flow Rate |
fast | middle | slow |
| 5μL/min | 5413.994μm/s | 548.52153μm/s | 67.9229μm/s |
| 15μL/min | 16241.73779μm/s | 1645.63652μm/s | 203.79536μm/s |
| 45μL/min | 48723.94763μm/s | 4937.93255μm/s | 611.65866μm/s |
Table 3 Simulation Results of Central Line Speed
g. Discussion
In this simulation, we consider all the channel walls are rigid, but in real cases, channel walls will deform when pressure applied. So the cross section area of the channel will be larger than what we have considered in this simulation.
In real cases, the microfluidic channels have a lot of defects at the edges of the channels. So the dragging force applied by these channels will be larger than what we have considered in this simulation, causing the fluid to have a lower speed. But due to the random distribution of the defects, at some points, the defects might accelerate the fluid flow by making the channel to be narrower than usual.
In this simulation, microfluidic channel width was set to 285μm as we designed, with channel walls exactly perpendicular to the bottom. While as in real cases, due to the low transmittance of SU-8 photoresist to the low-wavelength light, the photoresist at the top side of the channel will absorb higher energy than the photoresist at the bottom, causing a trapezoidal cross section profile. The flow speed change caused by this phenomenon is still unknown to us.
差大佬标定部分文档
In order to obtain the exact shear force applied to the cells by the fluid flow. We input the experimentally used flow rate as a boundary condition in our model, which have already been tested before, to calculate the shear stress on the bottom of the channel where the cells can adhere to.
The inlet circle was given the velocity of 0.0012557 m/s, 0.0025113 m/s and 0.0050226 m/s, which will give us the rate of flow values of 25μL/min, 50μL/min and 100μL/min. And the outlet circle was given the pressure of 0.
shear force of the shear stress on the bottom plane is shown below.
In order to further show the shear stress difference under different parameters, we draw a line on the bottom plane from (-16, -4) to (-16, -6.45) crossing through three microfluidic channels in the observation zone. and plot the shear stress on that line.
The speed at the central line in all three channels at three different flow rate is listed below.
|
Channel Flow Rate |
fast | middle | slow |
| 25μL/min | 1.07519Pa | 0.10819Pa | 0.0132Pa |
| 50μL/min | 2.15057Pa | 0.21642Pa | 0.02641Pa |
| 100μL/min | 4.30273Pa | 0.43314Pa | 0.05288Pa |
Table 4 Simulation Results of Central Line shear Stress
Audio-genetics
References
- ↑ Booth, R., & Kim, H. (2012). Characterization of a microfluidic in vitro model of the blood-brain barrier (μBBB). Lab on a Chip, 12(10), 1784-1792.


