Proof of Concept
Project
Contents
Overview
To implement audio-genetics, we chose two (Piezo1 and TRPC5) from hundreds of mechanosensitive(MS) channels that are relevant to sensing mechanical stress such as sound wave, because they are more sensitive to mechanical stress and more selectively permeable to calcium ion compared with others. Additionally, we used calcium indicator (R-GECO) to quantitatively examine the sensibility of Piezo1 and TRPC5 with the help of microfluidics and hypo-osmolality, the former one was to exert shear force on our transgenic CHO-K1 cell's membrane, the latter one was to exert tension on cell's membrane.
We also examined the intracellular calcium response to sound wave with different combination of frequency and intensity in advance, then we quantitatively analyzed the regulation ability of audio-genetics in long term by using special promoter (pNFAT) with its downstream GFP gene.
Finally, to ensure a required sensitivity to mechanical stress and select a series of audio respondent channels, we used protein engineering by directed evolution to get mutated sTRPC5 (super TRPC5) with high sensitivity to mechanical stress. All in all, our project is well organized. Each procedure is indispensable. The whole project can strongly prove the possibility of using sound wave energy as the extracellular input signal to induce intracellular downstream signal.
Testing the PiggyBac System
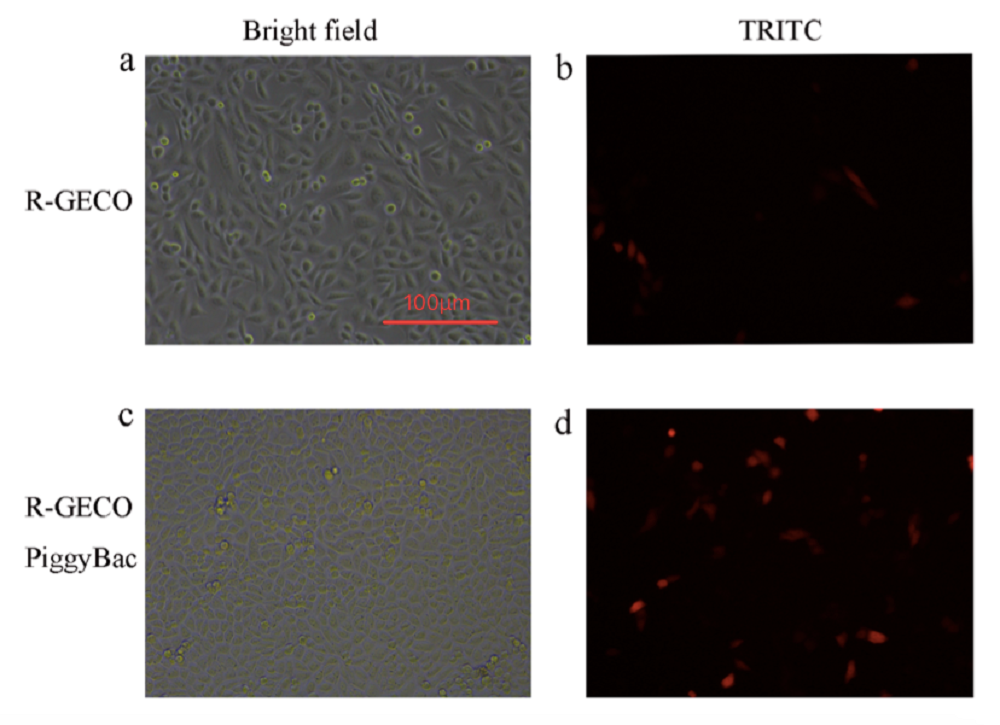
In order to quantitatively test the function of PiggyBac system, we made two groups of transfection using Lipofectamine® 3000. One was a group of CHO-K1 cells transfected with R-GECO, and the other group was the cells transfected with R-GECO and PiggyBac.
Fig. Result of quantitatively test the function of PiggyBac system, all pictures was capture by Nikon microscope (Nikon TS100) with 20 magnification times on the second day after transfection. a) Bright field image of the cells only transfected with R-GECO. b) Fluorescence image of the cell only transfected with R-GECO. c) Bright field image of the cells transfected with R-GECO and PiggyBac. d) Fluorescence image of the cell only transfected with R-GECO and PiggyBac.
Comparing the fluorescence image of the cell transfected with R-GECO (Fig. 1B) with R-GECO + PiggyBac (Fig. 1D) on the second day after transfection, we can observe that the group with PiggyBac has more fluorescent cells. It proves that PiggyBac transposon system can help the insertion of R-GECO gene into CHO-K1 genomes.
Examination of R-GECO Function
To quantitatively test the function of R-GECO, two experiments, potassium chloride (KCl) induced calcium influx and ionomycin induced calcium influx, were conducted under the live cell imaging.
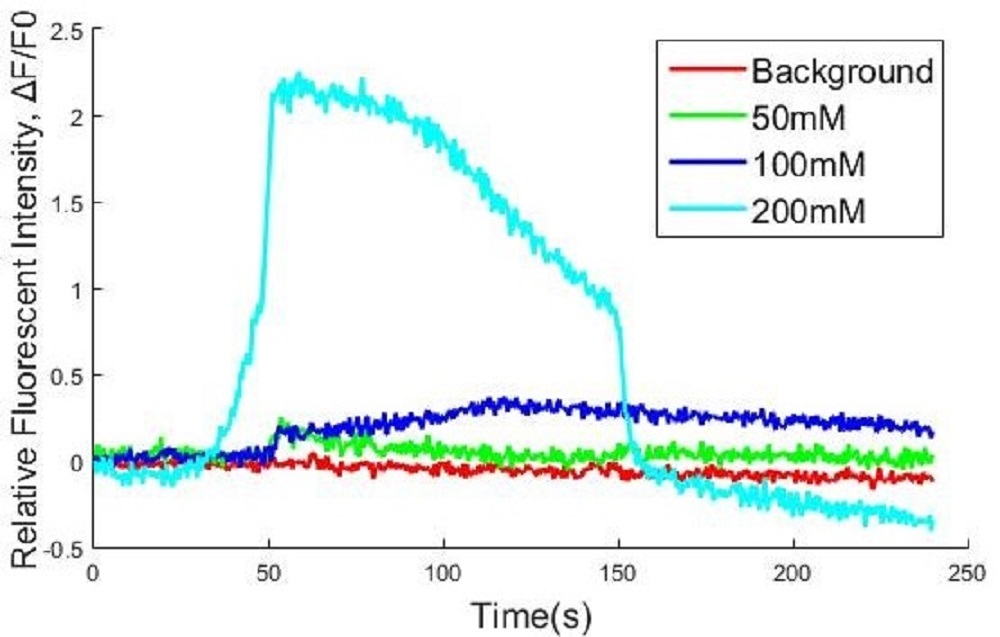
Fig. KCl induced Ca2+ influx result. KCl was added at 40s. Fluorescence intensity over time is shown as signal per pixel (the initial intensity has been normalized to 0). The data above are shown as mean ± SEM, n = 5 for 0 mM control, 12.5 mM, 50 mM, 200 mM.
Calcium influx due to depolarization of cell membrane was induced by different concentration of KCl. Different volume of KCl was added by drops into cell culture wells to reach the different final concentrations of KCl (0mM control, 12.5mM, 50mM, 200mM, respectively) at 40 second.
There was no distinct fluorescent increasing at 12.5mM KCl comparing with the control group. The cells under 50mM and 200mM KCl conditions both emitted high fluorescence, and the fluorescence of cells at 200mM was higher than cell at 50mM along with oscillation. It was proved quantitatively that R-GECO could be excited by KCl induced calcium influx.
A B
Fig. Ionomycin induced Ca2+ influx result. Fluorescence intensity over time is shown as signal per pixel (the initial intensity has been normalized to 0). The data are shown as mean ± SEM, n = 5 for control, 10 μM ionomycin.
R-GECO’s response to calcium influx was also tested by ionomycin which was added at 20s. After adding ionomycin (10μM final concentration), the increase of R-GECO fluorescence was distinct. Because the ionomycin was dropped beside the observed region of cells, the direction of fluorescence gradient (shown in the movie) was in accordance with the direction of ionomycin diffusion.
Measure Piezo1 and TRPC5 Sensitivity
We designed two experiments to quantitatively examine the sensibility of Piezo1 and TRPC5. Microfluidics and hypoosmolality were employed to exert shear force and tension on our transgenic CHO-K1 cell's membrane separately.
Microfluidics
Fig.1 a Schematic structure of microfluidics channel
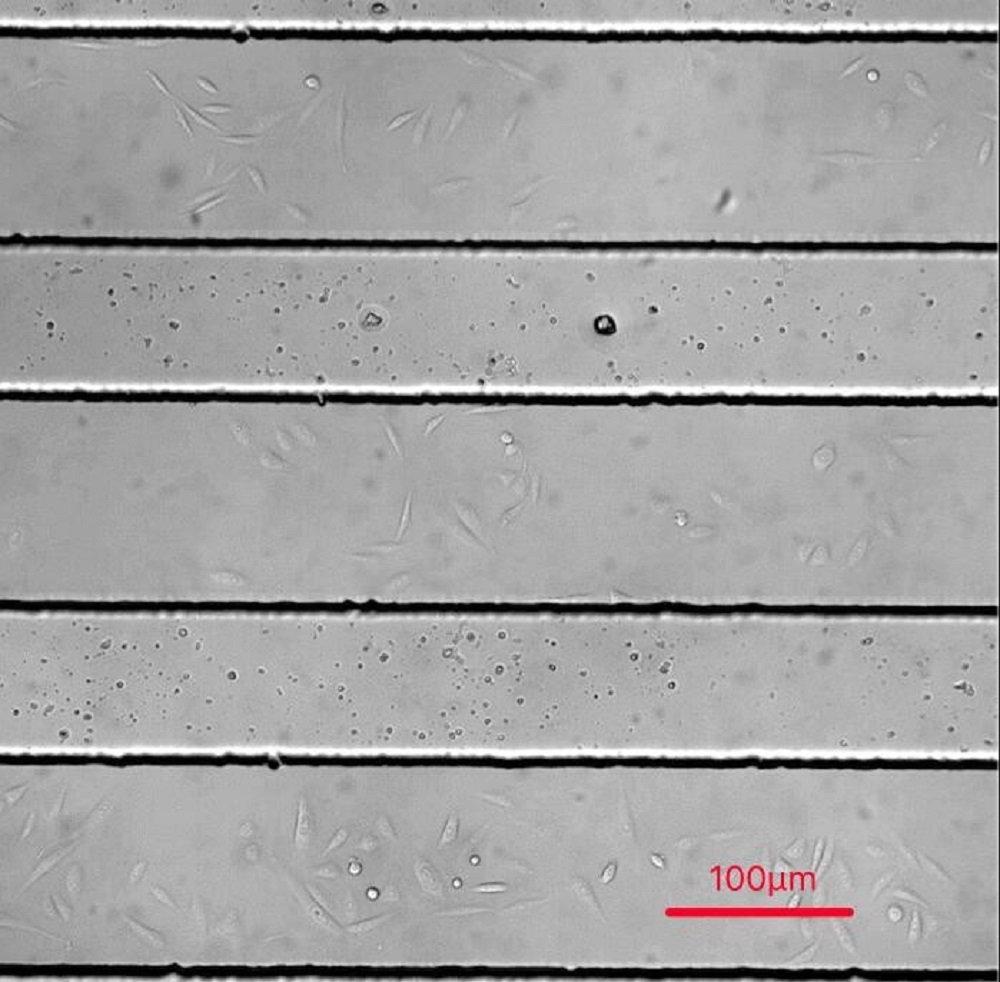
Fig. Cells in microfluidics chips 24hrs after seeding (待换图,用live cell 拍的)
CHO-K1 cells were cultured adherent on the bottom glass of PDMS tunnel. Stable and flexible force field was formed surrounding cell, directly controlled by the pumped-inflow rate.
See the design of microfluidics chip and the simulation of force field at https://2016.igem.org/Team:SUSTech_Shenzhen/Model
Fig. Fluorescent intensity (待补图)
CHO-K1 cell suspension was injected into gelatin treated microfluidics chips and incubated at 37°C, 5% CO2 incubator for 24 hours. Then the culture medium was injected into the chip channels (with the inflow rate of 25μL/min, 50μL/min and100μL/min controlled by micro syringe pump). The pump of culture medium started at t=10s. Cells’ response towards different shear force was measured by R-GECO fluorescence intensity under live cell imaging. (waiting result)
discussion! (modeling)
Hypoosmolarity
A
B
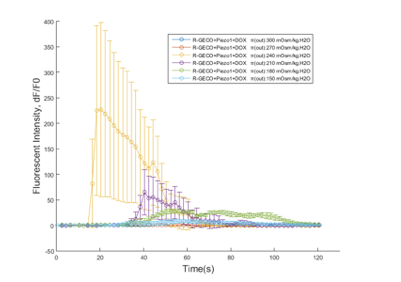
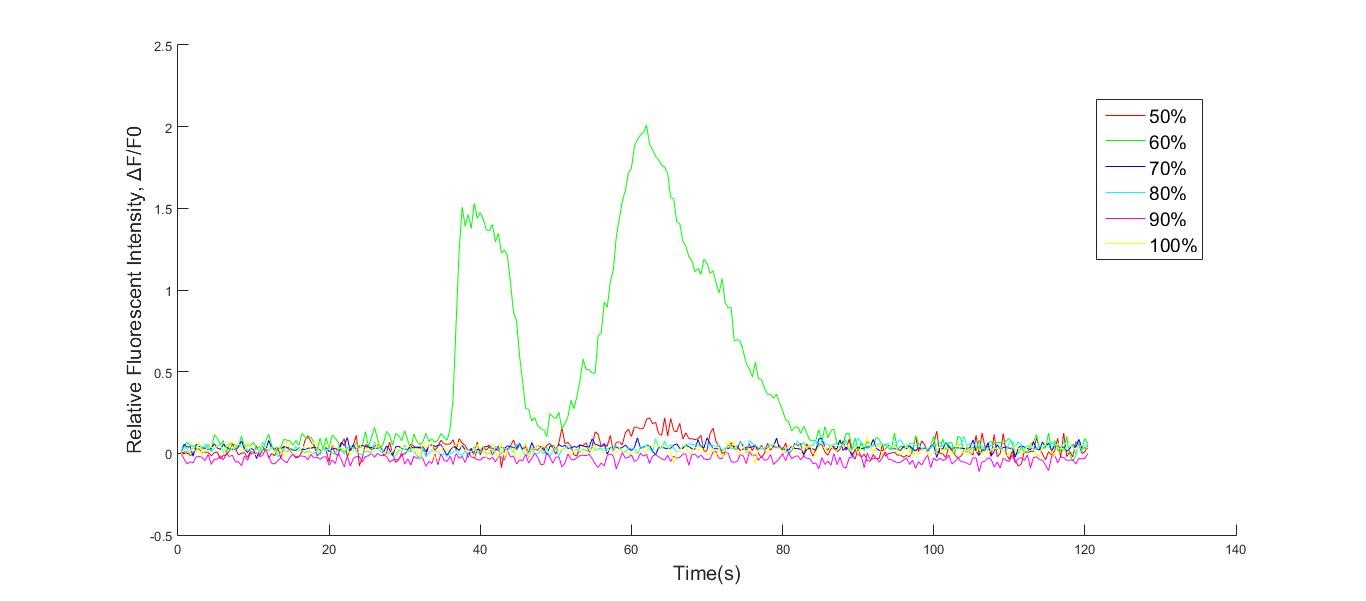
Fig. Osmotic pressure test result. Fluorescence intensity over time is shown as signal per pixel (the initial intensity has been normalized to 0). The data are shown as mean ± SEM, n = 5 for 3 groups of 100%, 90%, 80%, 70%, 60% or 50%.
Calcium influx was indicated by R-GECO fluorescence intensity. Culture medium was replaced by HHBSS before using live cell imaging. Three groups of cells were seeded into 18 wells: 6 wells of R-GECO, 6 wells of Piezo1 (without doxycycline inducement) and 6 wells of Piezo1 (with doxycycline inducement). Distilled water (added with CaCl2) was added into wells to make concentration of HHBSS into 100%, 90%, 80%, 70%, 60% or 50% for 3 groups.
Analyze the regulatory ability of audiogenetics
(高大山 高大山 )
Select through Cre-loxp system
Cre-loxp system played an important role in directed evolution, because we needed to screen a single cell colony only with one loxp site in the genome of each CHO-K1 cell for single copy insert of mutated TRPC5. Here we tested the function of cre-loxp system by making 3 different groups of transfection in the cells that already inserted with loxp gene on genomes using Lipofectamine® 3000.
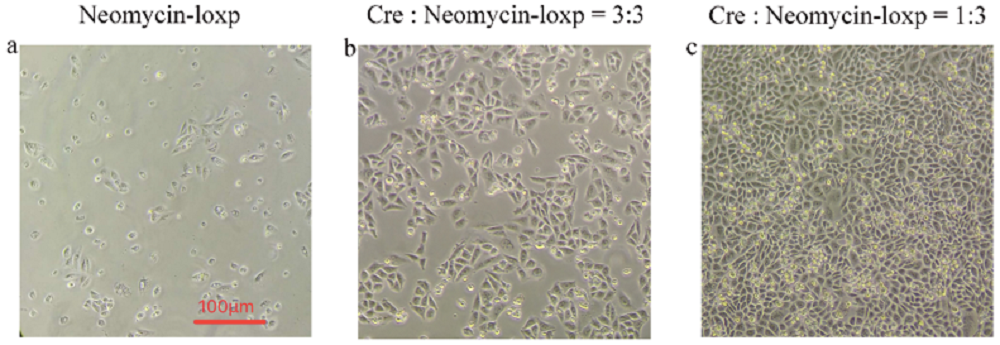
Few cells survives (Fig1. a) after antibiotics screening without transfecting Cre recombinase gene, which means that there is a small possibility that loxp gene can insert into genomes by interior transposase in cells. To find out the optimal ratio of Cre recombinase gene to Neomycin-loxp gene in the process of transfection, we compared two different ratio, 3:3 (Fig1. b) and 1:3 (Fig1. c), with equal amount of Neomycin-loxp gene but different amount of Cre recombinase gene.
From observation, we know that excess Cre recombinase is not appropriate in transfection process. The most possible reason is that surplus Cre recombinase is harmful for cells, so they may random cut and recombine genes in cell’s genome. Thus, we finally chose 1:3 as the ratio of Cre recombinase gene to Neomycin-loxp gene in transfection.

