Modeling Discoveries
Overview
In the whole experiment, we tested one mechanosensitive channel, Piezo1, with different mechanical forces using various devices. Surprisingly, there seems to be the interdependences and associations among these results.
Microfluidics
Different magnitude orders of shear force fields were generated in microfluidic channels controlled by the pumped-inflow rate. We quantify the cell responses in different levels of shear stress.
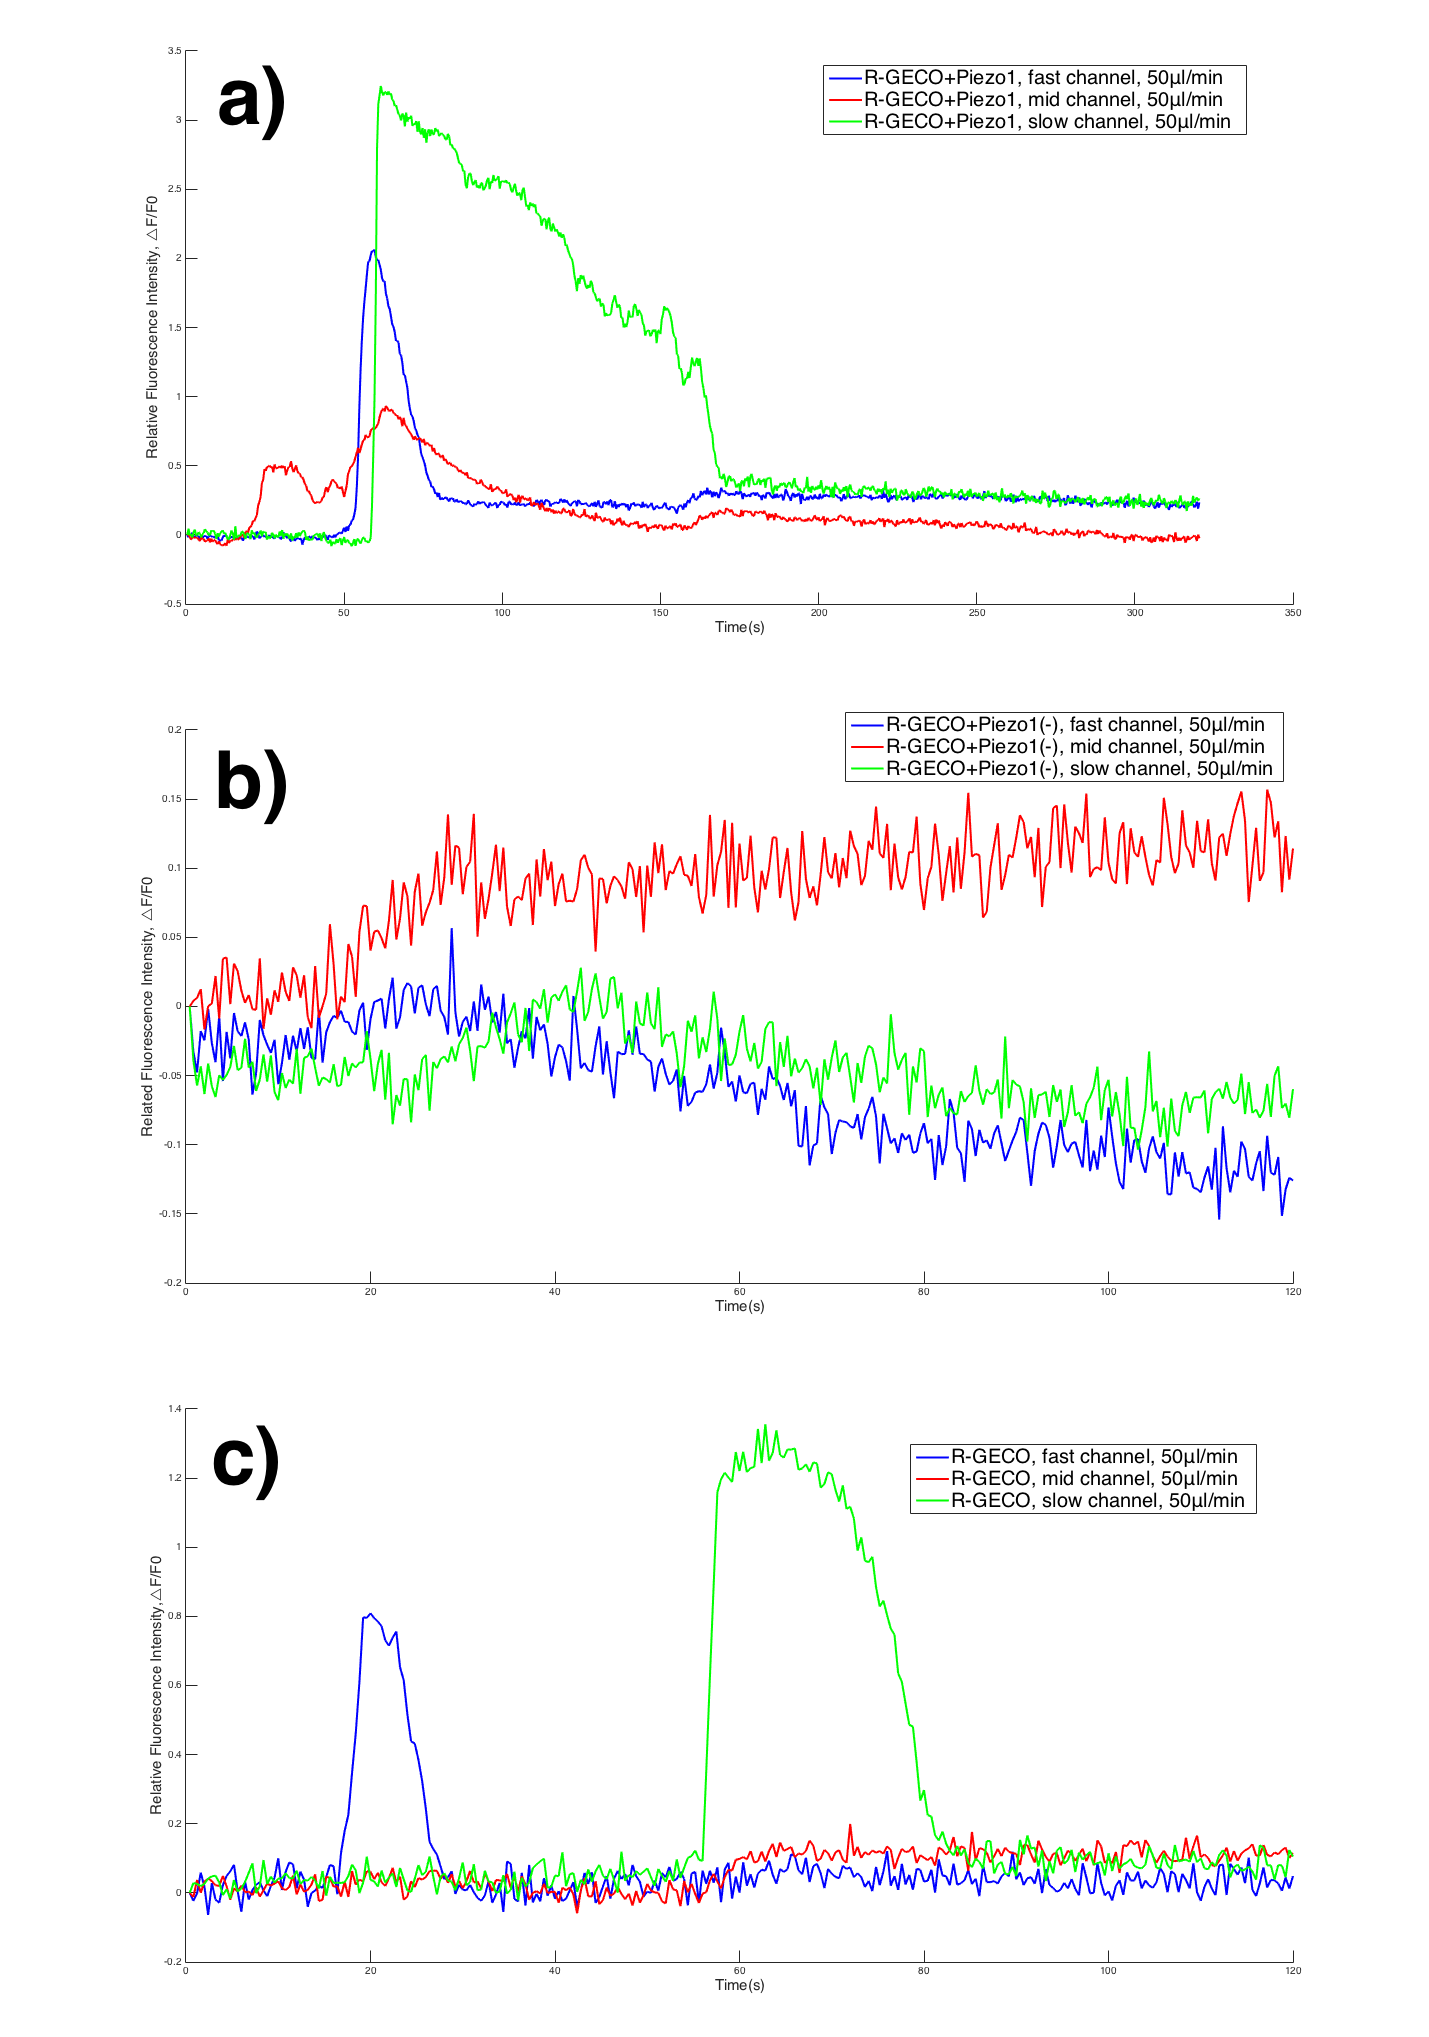
1. The fluorescence intensity emitted by Piezo1+R-GECO cells was much higher than the R-GECO cells after applying shear force. It reflected the Piezo1’s role of sensing mechanical force.
2. Wave patterns shows divergence between the Piezo1+R-GECO cell group and R-GECO cell group. The response of R-GECO is directly associated with the accumulation of Ca2+ in cytoplasm, with a steep increase ascend and a decline by degrees( see Fig.1b). The response level of cells with MS channel Piezo1 shows oscillation and a feed back, with a doublet peek in each response period( Fig.1 a).
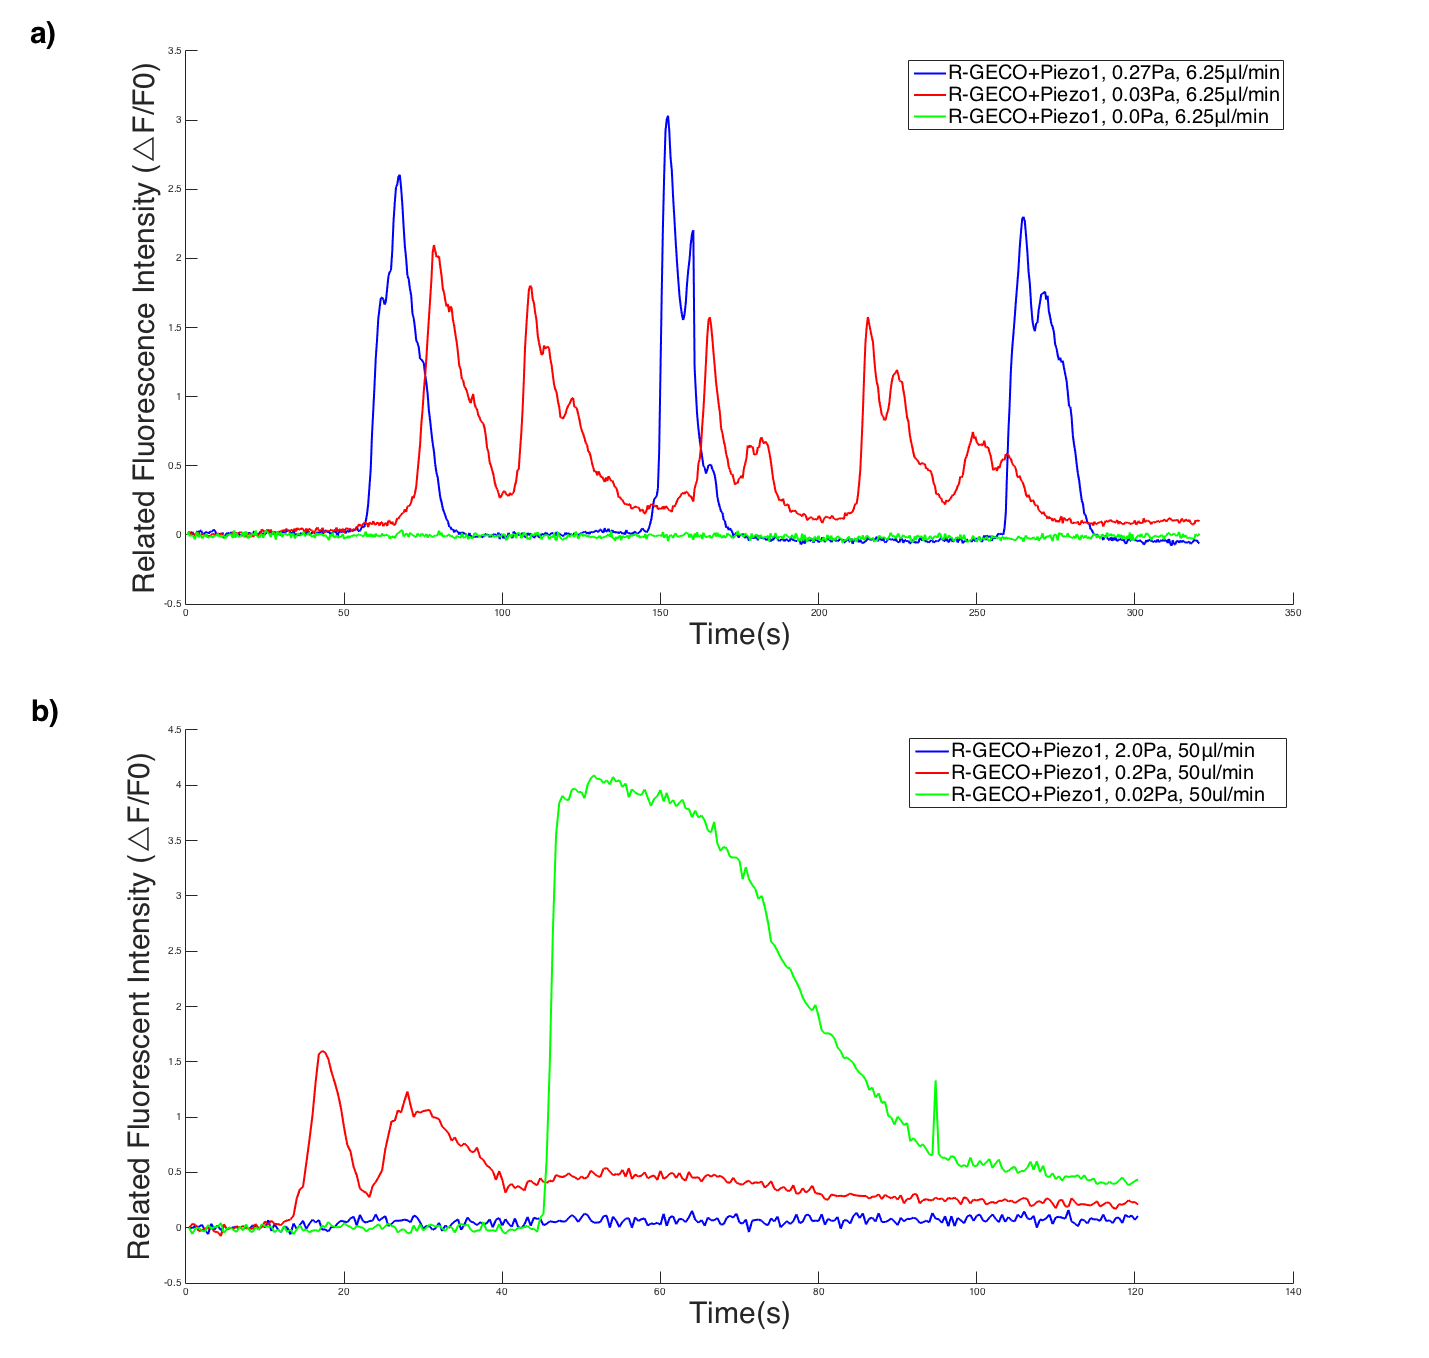
3. Comparing the fluorescence intensity amplitudes corresponded to the shear stress ranged from 0 Pa to 5 Pa, we found a best response at around 0.01-0.1 Pa.
4. No response has been observed when the shear stress is larger than 2 Pa.


(c, d) The movie shows the fluorescence intensity of cells within a pumped period (a,b).
< > < >
Fig. 3 Comparing the result of 6.25μL/min, middle channel(0.03Pa) (a)and the result of 50μL/min, slow channel(0.02Pa)(b). In different manipulation conditions but with the same stress magnitude, cells behave similarly.
Audible Sound Experiment
By analyzing the primary cause of cell response in Buzzer’s experiment, we proposed that the channel opening was induced by the shear stress on the dish wall. Besides, the magnitude order of the stress(0.01 Pa by calculation) with the most efficient frequency applied is within to the valid shear stress magnitude in microfluidics. See detailed calculation section in our model.
< > Fig. 4 The cell response level at Buzzer’s 15kHz experiment. The amplitude of fluorescence intensity is close to the result in the 6.25μL/min, mid channel condition(Fig. 3 a) and the in the 50μL/min, slow channel condition in microfluidics chip(Fig. 3 b) .

