Difference between revisions of "Team:British Columbia/Model"
| Line 110: | Line 110: | ||
<section id="Results" class="anchor"> | <section id="Results" class="anchor"> | ||
<h2>Results</h2> | <h2>Results</h2> | ||
| − | <p>The developed differential equations can be combined and solved using the ode45 function in MATLAB to produce predictions for different initial concentrations of <i>E.coli</i> and <i>C.crescentus</i>. One code, consortium.m, was created to specify constants and the relationships between variables in the form of ordinary differential equations. For a given time range, the differential equations would be discretized and solved producing the species and substrate concentrations as a function of time. A second code, variables.m, was created to specify initial conditions, send equations specified in consortium.m to the built-in MATLAB function ode45, and plot the resulting predictions. The developed codes can be obtained <a href ="https://2016.igem.org/File:British_Columbia_Modeling.zip">as a zip file here</a>, or <a href =" | + | <p>The developed differential equations can be combined and solved using the ode45 function in MATLAB to produce predictions for different initial concentrations of <i>E.coli</i> and <i>C.crescentus</i>. One code, consortium.m, was created to specify constants and the relationships between variables in the form of ordinary differential equations. For a given time range, the differential equations would be discretized and solved producing the species and substrate concentrations as a function of time. A second code, variables.m, was created to specify initial conditions, send equations specified in consortium.m to the built-in MATLAB function ode45, and plot the resulting predictions. The developed codes can be obtained <a href ="https://2016.igem.org/File:British_Columbia_Modeling.zip">as a zip file here</a>, or <a href ="https://2016.igem.org/File:British_Columbia_Modeling.txt">as a text file here </a>. |
</p> | </p> | ||
<p>For growth where dissolved oxygen concentration is not limiting, and glucose is the primary substrate, <i>E.coli</i> will be the dominant species for the duration of the culture, seen in Figure 5. Seen in our consortium results, a co-culture of <i>E.coli</i> and <i>C.crescentus</i> indicated that it's likely that the assumption of oxygen limitation is no longer valid. </p> | <p>For growth where dissolved oxygen concentration is not limiting, and glucose is the primary substrate, <i>E.coli</i> will be the dominant species for the duration of the culture, seen in Figure 5. Seen in our consortium results, a co-culture of <i>E.coli</i> and <i>C.crescentus</i> indicated that it's likely that the assumption of oxygen limitation is no longer valid. </p> | ||
Revision as of 20:45, 19 October 2016
Modelling
Introduction
A model was developed to describe a mixed culture of C. crescentus and E.coli with cellulose and glucose as the primary feedstocks. In mixed culture systems, the dynamics between the species can impact the complexity of the model, with more sophisticated dynamics requiring significant effort. Two mixed culture dynamics exist in the consortia: competition, in which species compete for substrate, and commensalism, where one species requires the existence of another to survive. The commensalism is passive and has been assumed to have negligible impact on the growth of either culture.
The culture dynamics have been modelled using a system of four ordinary differential equations: one for each species, one for glucose consumption and formation, and one for cellulose degradation. To model our environment, the individual species growth, enzyme expression, and enzyme activity were experimentally determined at optimum co-culture conditions of 30 degrees Celsius. Using these values, ordinary differential equations for a mixed culture were developed assuming that both E. coli and C. crescentus behaved competitively and that cellulose degradation by expressed cellulase enzymes on the C. crescentus surface did not favor C. crescentus due to diffusion gradients.
Model Development
To model substrate limited growth, Monod kinetics provided a relationship between substrate concentration and species growth. Two constants, maximum specific growth rate and the saturation constant, are required to use the relationship. The maximum specific growth rate of the culture, μmax, is the growth rate when substrate is in excess. The saturation constant, Ks, is the concentration at which the specific growth rate is half the maximum specific growth rate.
Equation 1: Monod Kinetics for Substrate Limited Growth
The maximum specific growth rate and saturation constant can be obtained for our system by evaluating the growth rates for a range of initial substrate concentrations for each strain desired in the model. With a series of biomass concentration values over a range of time, plotting the natural logarithm of each biomass concentration produces a linear plot with a slope equal to the strain growth rate on substrate. With several growth rates as a function of substrate concentrations, the inverse of both the rate and the substrate concentration can be plotted to produce a Lineweaver-Burk plot. The slope of this plot is equal to Ks/μmax, while the intercept is equal to 1/μmax. The C. crescentus data is obtained using this method, seen in Figure 1. An analysis of this plot produced μmax of 0.156 hr-1 and a Ks of 0.403 mM.
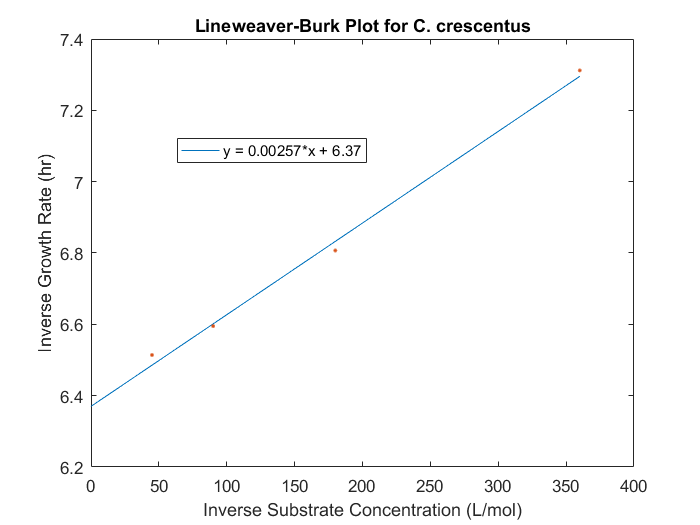
Figure 1: Lineweaver-Burk plot for C.crescentus with initial glucose concentrations of 2.77, 5.56, 11.1, 22.2 M
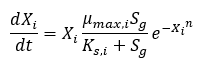
Differential equations using the Monod growth rate can be made for the change in species concentration as a function of time, seen in Equation 2. The experimentally determined growth rate seemed to decrease as a function of cell density, and as a result, a damping function of the inverse natural exponent to the power of cell density was included in the differential equation. The inclusion of a damping function improved the relationship between modelled values and experimentally obtained values. The final model correlation can be seen in Figure 2.
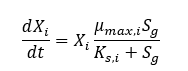
Equation 2: Differential Equation for Species Growth
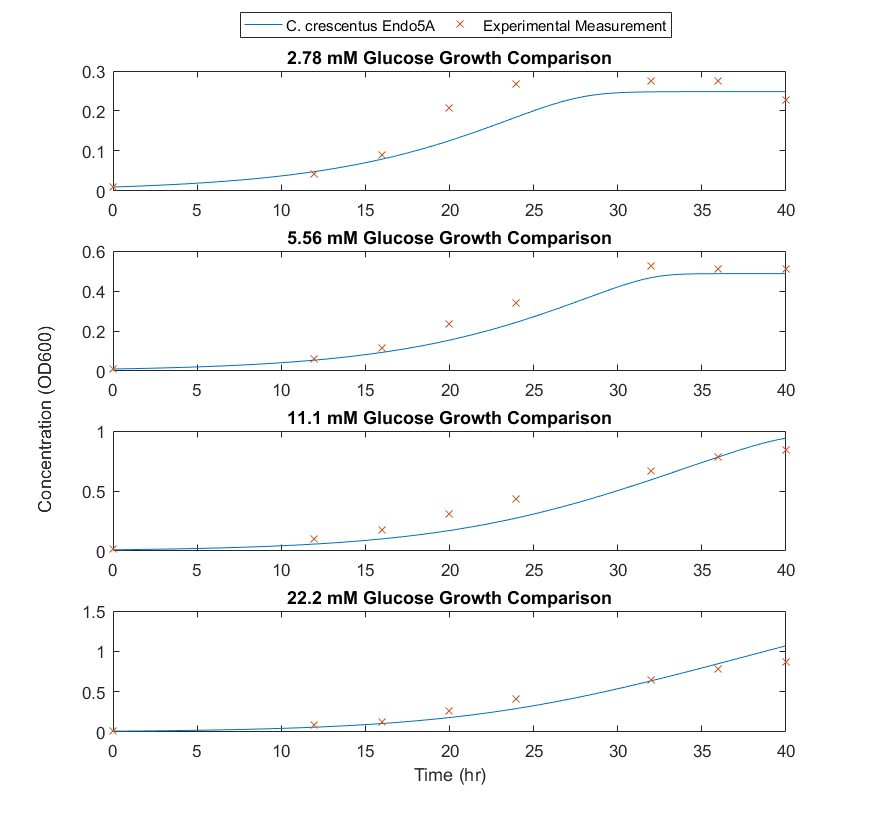
Figure 2: Comparison of experimental data to modelled results for C.crescentus with initial glucose concentrations of 2.77, 5.56, 11.1, 22.2 M
To obtain the maximum growth rate for the E.coli species, several E.coli cultures were compared to C. crescentus cultures grown at the same temperature and substrate conditions. In the absence of substrate limiting growth kinetics, with the same initial substrate concentration, the growth kinetics should differ based on the μmax of either species. Analysis of three triplicates for either species indicated that E.coli grew at a rate 2.58 times greater than C. crescentus in the same conditions, a result that can be directly related to μmax. The comparative growth curves can be seen in Figure 3. Based on these curves, the growth rate for E.coli is 3.1 times the growth rate for C. crescentus. The Ks for E.coli was assumed to be similar to C.crescentus. The species differential equation, seen in Equation 2, is also used for E.coli development. A damping function was also used for E.coli, allowing E.coli growth to match experimental data.
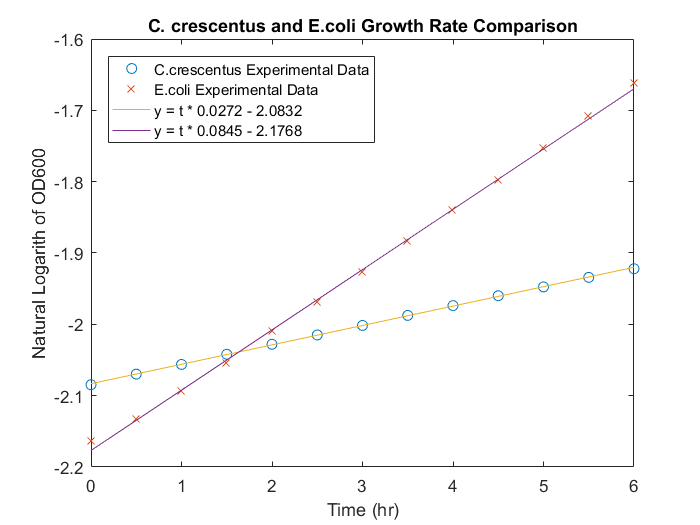
Figure 3: Comparison of E .coli and C. crescentus growth rates in M2 media, with 22.2mM glucose in microwells.
To model the rate of cellulose degradation into glucose through the expressed enzyme activity, a modified Michaelis-Menten relationship is used. Since cellulase enzymes are expressed on the surface of C. Crescentus, a relationship between glucose formation, cell concentration and enzyme expression must be made. To accomplish this, cellulase activity was tracked for two different cell concentrations, for a number of different substrate concentrations. The inverse of substrate degradation rate can be plotted against the inverse initial substrate concentrations to produce a Lineweaver-Burk plot. The slope of this plot is the Michaelis-Menten constant, KM, divided by the maximum rate of consumption, Vmax. Typically, Vmax is a constant related to enzyme concentration and kinetics, however in the consortium system, enzyme concentration changes as a function of time based on the concentration of C. crescentus in the system. Instead, Vmax is a combination of enzyme activity, the number of enzymes expressed per C. crescentus, and the concentration of C. crescentus. The activity and expression number can be assumed constant, represented by β. To determine the constants in our Michaeles-Menten kinetics, two Lineweaver-Burk plots are created using experimental data with two different cell concentrations and the average of the constants are used. The difference between the y axis intercept values can be used to determine the constant β, and the slope can be used to determine KM. Using this information, the ordinary differential equation describing cellulose degradation can be developed, Equation 3.
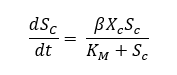
Equation 3: Differential equation for Michaelis-Menten kinetics including modification for growth rate dependency.
To determine cellulose activity as a function of cell density and substrate concentration, an absorbance based assay with initial DNP-cellubioside concentrations of 0.1 mg/mL, 0.05 mg/mL, and 0.02mg/mL was inoculated with C.crescentus at optical densities at 600nm of 0.3 and 0.6. When the Lineweaver-Burk plots are compared for either concentration, seen in Figure 4, there is no clear difference between them, indicating that concentration has negligible impact on the rate of cellulose degradation after a certain culture concentration has been reached. The Vmax obtained was 0.003 hr-1, while the Km obtained is 0.024 mM. These results indicate that the growth of activity of cellulases is quite slow. These values were incorporated into the model to complete the required constants for operation.

Figure 4: Cellulase rate determination through plotting substrate concentration as a function of time against initial substrate concentration.
When the production of glucose through cellulose degradation and the consumption due to the growth of E. coli and C. crescentus are combined, the ordinary differential equation describing glucose utilization can be developed. In addition to these production and consumption rates, yields of cells on glucose substrate must be obtained. These equations have been written in terms of OD600, and as a result, the yield terms can be obtained in terms of OD600 per gram or mole glucose. By performing glucose assys alongside experimentation, the yields can be obtained simply. The combined differential equation for glucose feed stock in the system can be seen in Equation 4. A stoichiometric factor is included before the production term to compensate for the number of moles of glucose released from cellulose or cellubiose.
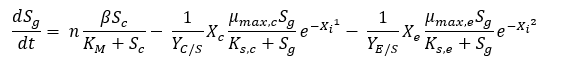
Equation 4: Differential equation for glucose generation and consumption as a function of time and species concentration.
Results
The developed differential equations can be combined and solved using the ode45 function in MATLAB to produce predictions for different initial concentrations of E.coli and C.crescentus. One code, consortium.m, was created to specify constants and the relationships between variables in the form of ordinary differential equations. For a given time range, the differential equations would be discretized and solved producing the species and substrate concentrations as a function of time. A second code, variables.m, was created to specify initial conditions, send equations specified in consortium.m to the built-in MATLAB function ode45, and plot the resulting predictions. The developed codes can be obtained as a zip file here, or as a text file here .
For growth where dissolved oxygen concentration is not limiting, and glucose is the primary substrate, E.coli will be the dominant species for the duration of the culture, seen in Figure 5. Seen in our consortium results, a co-culture of E.coli and C.crescentus indicated that it's likely that the assumption of oxygen limitation is no longer valid.
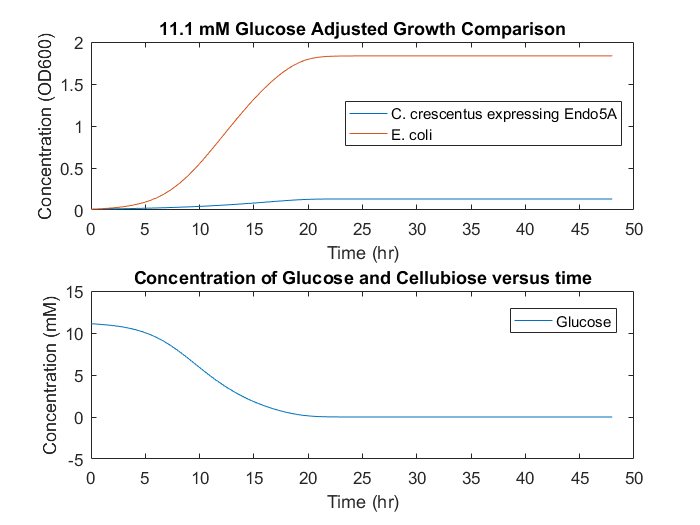
Figure 5: Initial model predictions based on growth rates without consortium data.
Based on co-culture experiments, the damping factor for E.coli growth rate was increased by second power. This adjustment allows the initial E.coli growth rates to achieve maximum values while growth rate over longer time periods is reduced. This growth rate reduction is possibly due to oxygen limitation in shake flasks and microwell cultures. When the model is changed to accommodate the damping factor, dynamics similar to the experimental dynamics are obtainable. A prediction with modified damping factors to accomodate oxygen limitation can be seen in Figure 6.
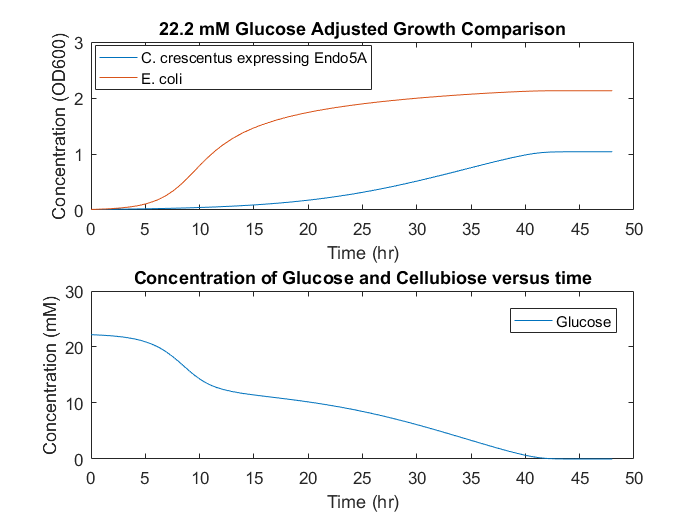
Figure 6: Adjusted model predictions based on consortium data.
In a system with cellulose as the only feedstock, growth would occur slowly and diffusion limitations could cause different growth mechanisms to be non-negligible, seen in Figure 7. This result indicates that a consortium based on cellulose as the only feedstock is unlikely to be successful, as the cell accumulation will be low over long time periods. To supplement initial E.coli growth, a small initial glucose concentration could provide initial cell numbers, and allow increased growth overall, seen in Figure 8.
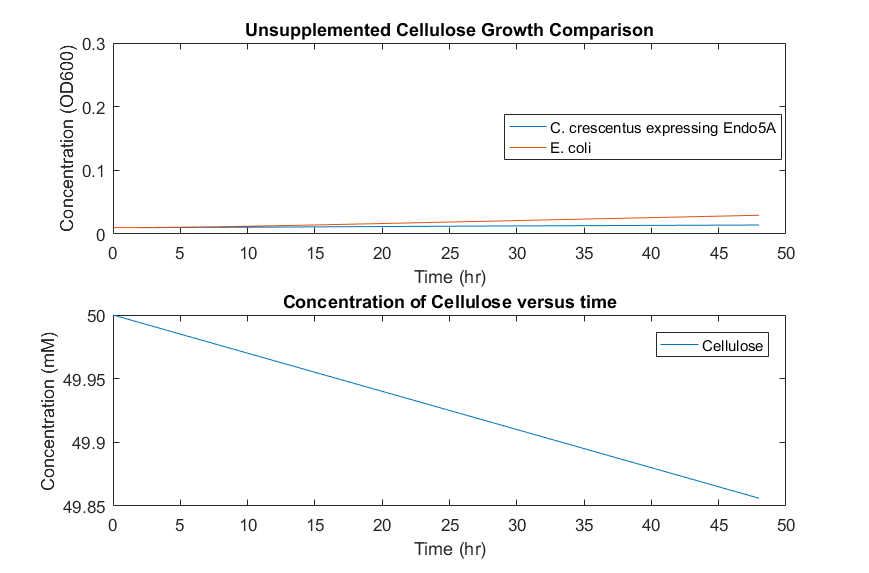
Figure 7: Consortia model predictions with cellulose as the only substrate.
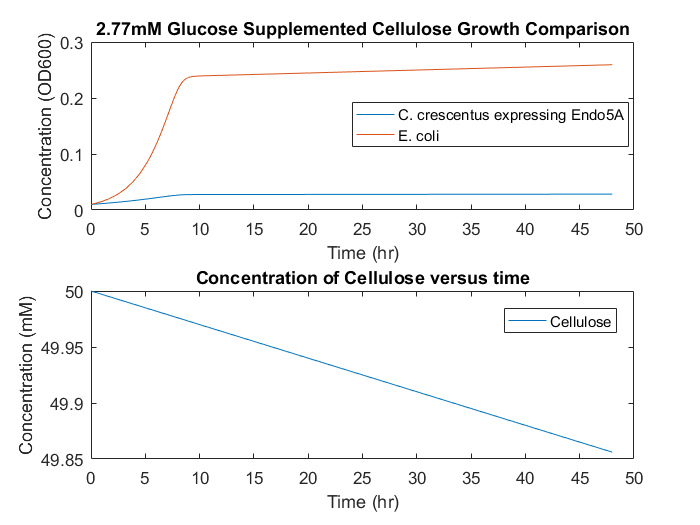
Figure 8: Consortia model predictions with cellulose as the primary substrate and small initial glucose concentration of 2.77mM.
In order to improve the selectivity and yield of E. coli compared to C. crescentus, several alternative routes are possible. First, the rate of cellulose degradation can be increased through temperature or other further cellulase development to produce higher concentrations of glucose in the media, increasing the growth rate of E.coli directly. Additionally, improving oxygen transfer may allow E.coli to produce higher concentrations of cell mass by removing the impact of the damping function.
Conclusion
Check out other parts of our project below!

