Difference between revisions of "Team:XMU-China/Proof"
| (36 intermediate revisions by 5 users not shown) | |||
| Line 60: | Line 60: | ||
<style type="text/css"> | <style type="text/css"> | ||
#btn{ | #btn{ | ||
| − | width: | + | width:90px; height:90px;position:fixed;right:0.1%; |
| − | + | bottom:30px;background:url(https://static.igem.org/mediawiki/2016/b/ba/T--XMU-China--lightbulb_and_.png);no-repeat left top;display:none; | |
border:currenColor; | border:currenColor; | ||
} | } | ||
#btn:hover{ | #btn:hover{ | ||
| − | background:url(https://static.igem.org/mediawiki/2016/b/ba/T--XMU-China--lightbulb_and_.png) no-repeat left - | + | background:url(https://static.igem.org/mediawiki/2016/b/ba/T--XMU-China--lightbulb_and_.png) no-repeat left -90px; |
} | } | ||
.nav>li>a{ | .nav>li>a{ | ||
| Line 111: | Line 111: | ||
<p style="padding-left:16px; padding-bottom: 15px; | <p style="padding-left:16px; padding-bottom: 15px; | ||
font-size: 21px; | font-size: 21px; | ||
| − | font-weight: 200;color:#333;text-shadow: 0 0 1px black;" id="section-1"> | + | font-weight: 200;color:#333;text-shadow: 0 0 1px black;" id="section-1">Verities never lie.</p> |
</div> | </div> | ||
</div> | </div> | ||
| Line 200: | Line 200: | ||
<ul class="nav nav-tabs nav-stacked" data-spy="affix" data-offset-top="300"> | <ul class="nav nav-tabs nav-stacked" data-spy="affix" data-offset-top="300"> | ||
<li id="sidehead">Proof Of Concept</li> | <li id="sidehead">Proof Of Concept</li> | ||
| − | <li class="active"><a href="#section-1" > | + | <li class="active"><a href="#section-1" >Entire circuits test</a></li> |
| − | + | ||
<li><a href="#section-3">Responder test</a></li> | <li><a href="#section-3">Responder test</a></li> | ||
<li><a href="#section-4">Model</a></li> | <li><a href="#section-4">Model</a></li> | ||
| Line 213: | Line 212: | ||
<ul style="color:#000;list-style:none;list-decoration:none;margin-left:3.4%;"> | <ul style="color:#000;list-style:none;list-decoration:none;margin-left:3.4%;"> | ||
<li style="font-size:20px;color:#8968CD;border-bottom: 0.5px solid #aaa;width:95%;">Proof Of Concept</li> | <li style="font-size:20px;color:#8968CD;border-bottom: 0.5px solid #aaa;width:95%;">Proof Of Concept</li> | ||
| − | <li ><a style="color:#aaa;" href="#section-1" > | + | <li ><a style="color:#aaa;" href="#section-1" >Entire circuits test</a></li> |
| − | + | ||
<li><a style="color:#aaa;" href="#section-3">Responder test</a></li> | <li><a style="color:#aaa;" href="#section-3">Responder test</a></li> | ||
<li><a style="color:#aaa;" href="#section-4">Model</a></li> | <li><a style="color:#aaa;" href="#section-4">Model</a></li> | ||
| Line 226: | Line 224: | ||
<div class="col-md-10" style="overflow:hidden;"> | <div class="col-md-10" style="overflow:hidden;"> | ||
<h1 id="section-1"; style="border-bottom: 1px solid #aaa;color: #8968CD;text-shadow: 0 0 1px black;margin-bottom:.6em;padding-top: 0; | <h1 id="section-1"; style="border-bottom: 1px solid #aaa;color: #8968CD;text-shadow: 0 0 1px black;margin-bottom:.6em;padding-top: 0; | ||
| − | padding-bottom: -5%;"> | + | padding-bottom: -5%;">Entire circuits test |
</h1> | </h1> | ||
| − | |||
<center><img src="https://static.igem.org/mediawiki/2016/5/5b/T--XMU-China--result_CG_.png" width="80%;" align="center"; style="margin-bottom:20px;"/></center> | <center><img src="https://static.igem.org/mediawiki/2016/5/5b/T--XMU-China--result_CG_.png" width="80%;" align="center"; style="margin-bottom:20px;"/></center> | ||
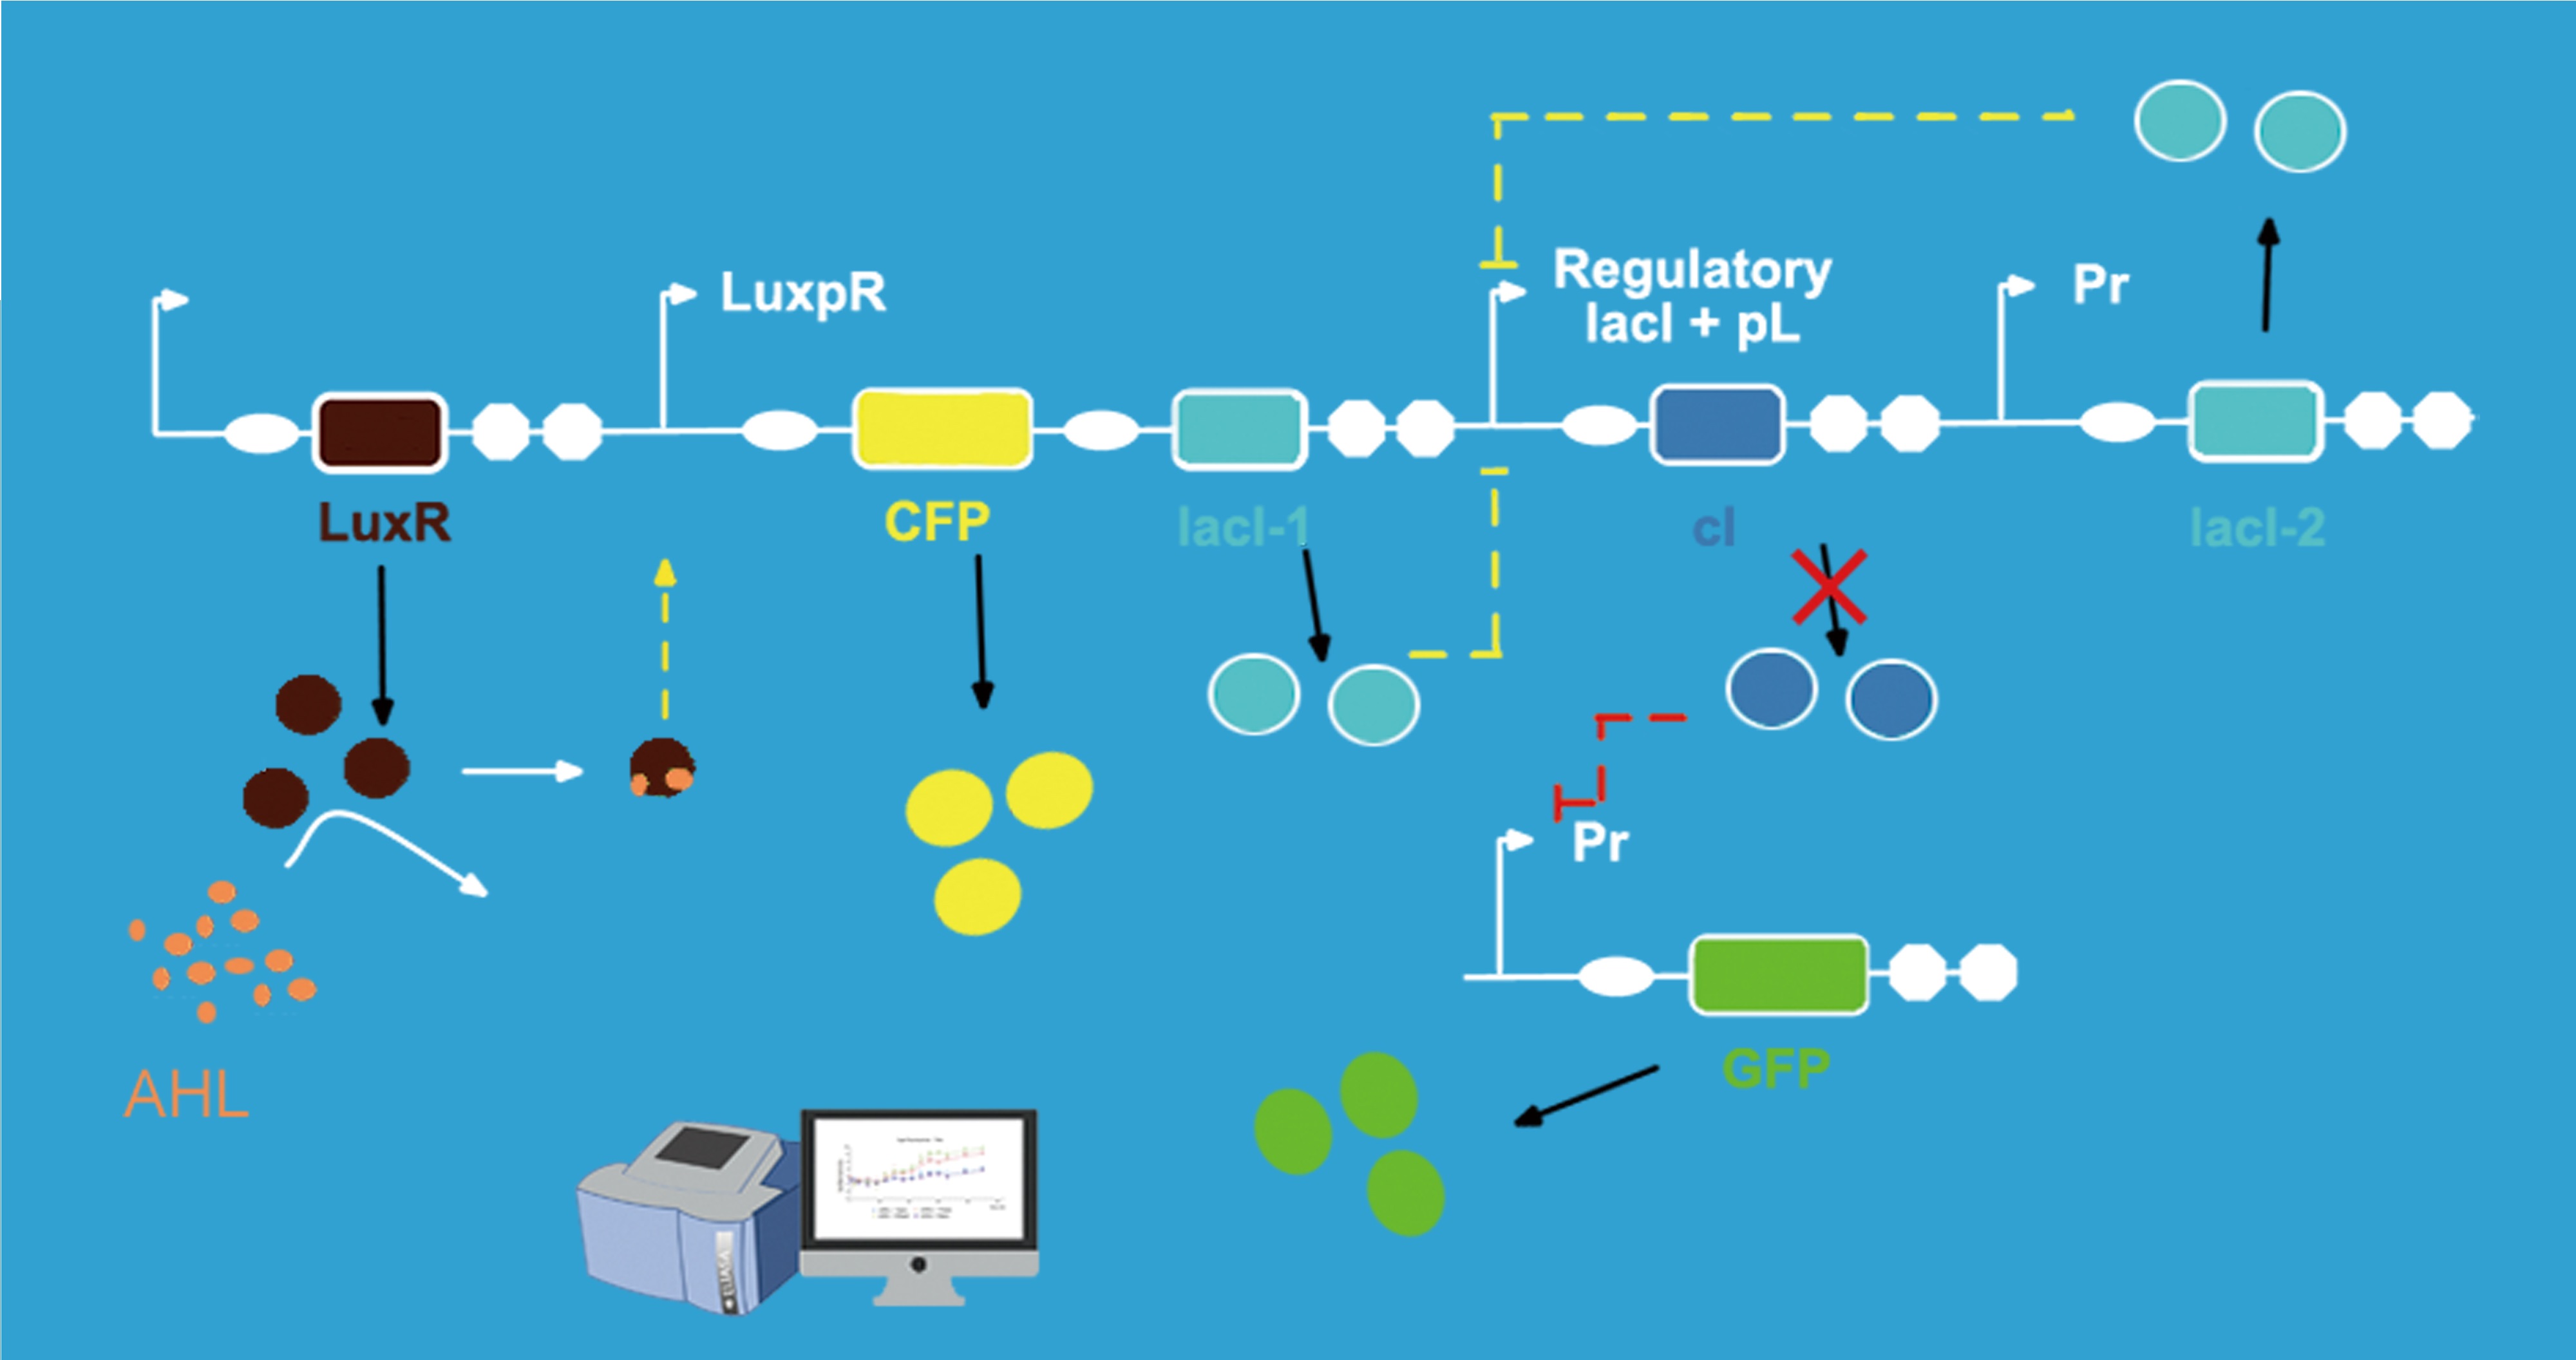
| − | <p>In our experiment, for testing our circuit more conveniently, we use | + | <p>In our experiment, for testing our circuit more conveniently, we use <i>CFP</i> to replace the responder and use <i>GFP</i> to replace lysis. Because the fluorescence intensity is easier to be measured. Also, the intensity of the fluorescence can stand for the intensity of the corresponding genes' expression.</p> |
| − | <p>When | + | <p>When the concentration of AHL is at low concentration, AHL cannot be detected by the quorum sensing system. And as a consequence, there is no enough inhibitor lacI to repress promoter P<sub>lac</sub>. So the <em>cI</em> gene is expressing at the wild-type levels. While lacI-2 and GFP are repressed since the CI protein is at high concentration. When AHL around the engineered bacteria reached a certain concentration or a threshold value, AHL could be detected by the sensing molecules Lux R. Then, Lux R interacted with AHL and form activating molecules to activate promoter Lux pR. CFP and lacI-1 express, and CFP protein could be detected by fluorescence measurement. And the lacI-1's product-lacR protein could inhibit the expression of <em>cI</em> gene. As a result, lacI-2 and GFP expressed. The lacI-2's product could further repress <em>cI</em> gene's expression, which was a negative feedback system. GFP could be measured by fluorescence detection to represent the level of lysis gene's expression. The time of initial expression of <span id="section-2">CFP</span> and GFP were different. As a result, the interval of time could represent the delay time which the switch give for responder expression.</p> |
| − | + | <h3>1. AHL Gradient Induction</h3> | |
| − | + | <p>As we can see, quorum sensing system could be induced by AHL. As for our gene circuits, when AHL raised to its threshold value and was detected by the sensor part, the promoter Lux PR can be activated, CFP and GFP are expressed. In order to find out the relationship, we decided to make an AHL gradient induction for our gene circuits. </p> | |
| − | + | <p>During our experiment, we first constructed our gene circuit successfully, then we transformed the plasmids into chemical competent cell (DH5α). And then our engineering bacteria were divided into four groups: experimental group 1, 10 and 20 (c(AHL) = 1 ng/μL, 10 ng/μL, and 20 ng/μL) and blank control group. Then we measured OD600 of the <i>E.coli</i> and the fluorescence intensity of CFP and GFP for 900 minutes. The OD600 showed the growth trend of the engineering bacteria. And the fluorescence intensity of each group showed the relationship between AHL and the expression of our circuits. </p> | |
| − | <h3>1.AHL Gradient Induction</h3> | + | |
| − | <p> | + | |
| − | + | ||
| − | <p> | + | |
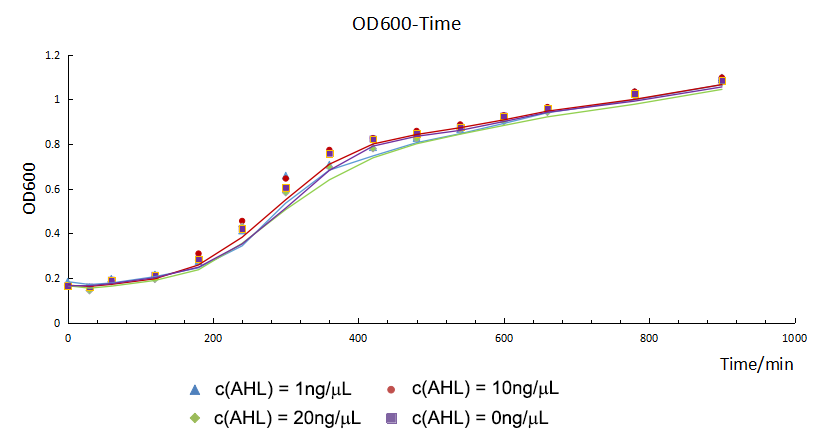
<figure><center><img src="https://static.igem.org/mediawiki/2016/7/7e/T--XMU-China--result_fig1_1_.png" width="80%;" align="center"; style="margin-bottom:20px;"/></center> | <figure><center><img src="https://static.igem.org/mediawiki/2016/7/7e/T--XMU-China--result_fig1_1_.png" width="80%;" align="center"; style="margin-bottom:20px;"/></center> | ||
| − | <figcaption><center><strong>Figure 1.1</strong> The OD600 of | + | <figcaption><center><strong>Figure 1.1</strong> The OD600 of versus time of experimental group 1, 10, 20 and control</center></figcaption></figure><br/> |
| − | <p> | + | <p>From figure 1.1, we found that the growth curves of each group don't show much difference. It suggested that they had the same growth trend, so the difference of fluorescence intensity was mainly from the expression of circuits or other factors.</p> |
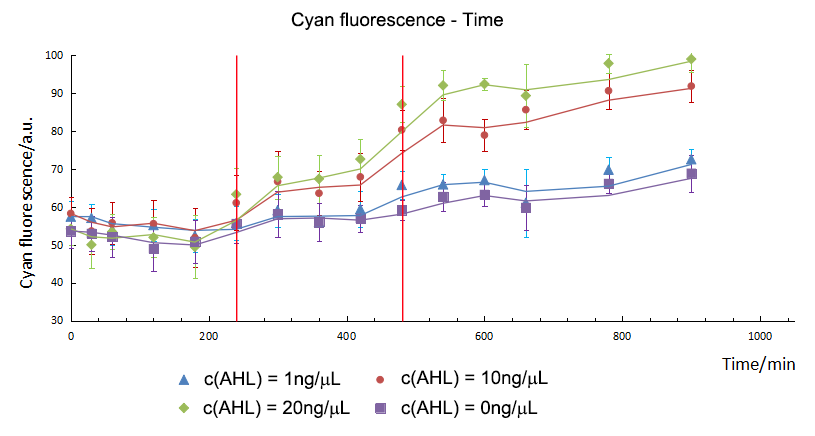
<figure><center><img src="https://static.igem.org/mediawiki/2016/f/fa/T--XMU-China--result_fig1_2_.png" width="80%;" align="center"; style="margin-bottom:20px;"/></center> | <figure><center><img src="https://static.igem.org/mediawiki/2016/f/fa/T--XMU-China--result_fig1_2_.png" width="80%;" align="center"; style="margin-bottom:20px;"/></center> | ||
| − | <figcaption><center><strong>Figure 1.2</strong> The | + | <figcaption><center><strong>Figure 1.2</strong>The average cyan fluorescence intensity versus time of experimental group 1, 10, 20 and control.</center> </figcaption> |
| − | </figure> | + | </figure><br/> |
| − | <p> | + | <p>So we did experiments at the same condition except the concentration of AHL. As showed in figure 1.2, with the increase of the AHL, the expression of the CFP showed an upper trend. In addition, by means of independent t-test, we compared the fluorescence intensity between the group 1, 10, 20 and control. We found the initial expression time of CFP was different. For group 10 and 20, CFP expressed initially and could be detected in the 240th minute. However, for group 1, CFP started to express in the 480th minute.</p> |
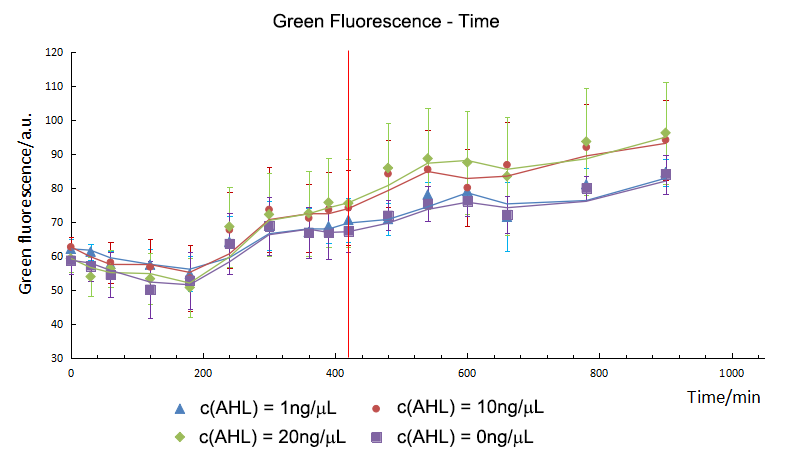
<center><img src="https://static.igem.org/mediawiki/2016/8/8b/T--XMU-China--result_fig1_3_.png" width="80%;" align="center"; style="margin-bottom:20px;"/></center> | <center><img src="https://static.igem.org/mediawiki/2016/8/8b/T--XMU-China--result_fig1_3_.png" width="80%;" align="center"; style="margin-bottom:20px;"/></center> | ||
| − | <p><center><strong> Figure 1.3 </strong>The | + | <p><center><strong> Figure 1.3 </strong>The average green fluorescence intensity versus time of experimental group 1, 10, 20 and control. </center></p><br/> |
| − | <p> | + | <p>T-test showed that AHL didn't influence the expression of GFP directly. Group 10 and 20 expressed initially in the 420th minute and green fluorescence intensity had no significant difference in expression level. However, as for group 1, green fluorescence intensity didn’t show much difference comparing with control group, which meant that 1 ng/μL of AHL was not enough to activated the sensor successfully. As a result, the repression on the P<sub>lac</sub> cannot be released, and the expression of <i>gfp</i> still stayed in a low level. So the sensor part is an specific and smart device. </p> |
| − | <h3> | + | <h3>2. The Delayed Effect</h3> |
<center><img src="https://static.igem.org/mediawiki/2016/5/53/T--XMU-China--result_fig1_4_1.png" width="80%;" align="center"; style="margin-bottom:20px;"/></center> | <center><img src="https://static.igem.org/mediawiki/2016/5/53/T--XMU-China--result_fig1_4_1.png" width="80%;" align="center"; style="margin-bottom:20px;"/></center> | ||
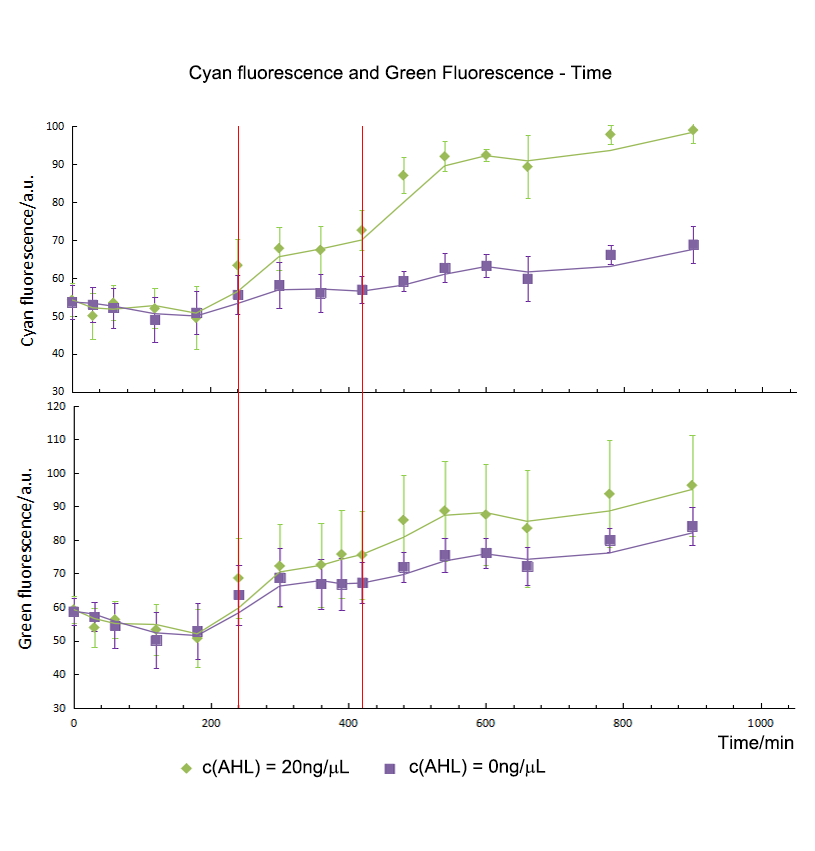
| − | <p><center><strong> Figure 1.4 </strong>The | + | <p><center><strong> Figure 1.4 </strong>The average cyan and green fluorescence intensity versus time of experimental group 20 and control.</center></p> |
<center><img src="https://static.igem.org/mediawiki/2016/0/06/T--XMU-China--result_fig1_5_1.png" width="80%;" align="center"; style="margin-bottom:20px;"/></center> | <center><img src="https://static.igem.org/mediawiki/2016/0/06/T--XMU-China--result_fig1_5_1.png" width="80%;" align="center"; style="margin-bottom:20px;"/></center> | ||
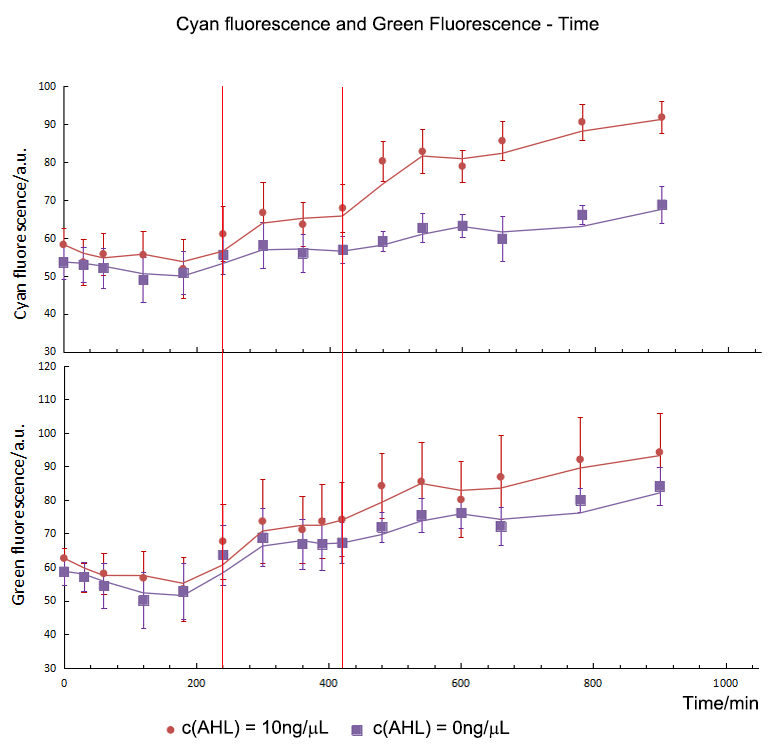
| − | <p><center><strong> Figure 1.5 </strong>The | + | <p><center><strong> Figure 1.5 </strong>The average cyan and green fluorescence intensity versus time of experimental group 10 and control.</center></p><br/> |
| − | + | ||
| − | < | + | |
| − | + | ||
| + | <p>As mentioned above, we did analyze the fluorescence intensity data by means of t-test to show that if there was a significant variation between experiment groups and control. And then, we get the initial expression time of CFP/ GFP in experiment groups and control. For group 10 and 20, the initial expression time of CFP was the 240th minute and GFP was detected at the 420th minute. From the results, we could draw the conclusion that the expression time of GFP was delayed to 180mins post CFP, which was the same as our expectation. So the <strong>Sensor</strong> and <strong>switch</strong> expressed as expected and match with each other very well. </p> | ||
<h1 style="border-bottom: 1px solid #aaa;color: #8968CD;text-shadow: 0 0 1px black;margin-bottom:.6em;padding-top: 0; | <h1 style="border-bottom: 1px solid #aaa;color: #8968CD;text-shadow: 0 0 1px black;margin-bottom:.6em;padding-top: 0; | ||
padding-bottom: -5%;">Responder test | padding-bottom: -5%;">Responder test | ||
</h1> | </h1> | ||
| + | <p>Against the backdrop of today's widely spread of drug-resistant bacteria, small regulatory RNA (sRNA) offers a new clinical therapy approach to repress the target drug-resistant genes and then it can enhance the effect of antibiotic in the clinical. Here we designed synthetic sRNA to target the antibiotic resistance gene chloramphenicol acetyltransferase (CAT) to generate representative data and to quantify knockdown effectiveness.</p> | ||
| + | <p>We designed and synthetized RNA silencing cassettes (<strong>Table 1</strong>) and constructed it into pSB1AC3, an official plasmid which contained ampicillin resistance gene and chloramphenicol resistance gene. Also, we used pSB1AC3+mRFP as control.</p> | ||
| + | <center><img src="https://static.igem.org/mediawiki/2016/3/3a/T--XMU-China--result_fig1_2_1.png" width="80%;" align="center"; style="margin-bottom:20px;"/></center> | ||
| + | <p><center><strong> Figure 2.1 </strong>The diagram of synthetized RNA silencing cassettes and control.</center></p> | ||
| + | <div class="table-responsive"><br/> | ||
| + | <table class="table table-hover table-striped" width="100%" style="color:#8968CD;font-size:14px"> | ||
| + | <thead> | ||
| + | <tr> | ||
| + | <th>Part</th> | ||
| + | <th>Sequence</th> | ||
| + | </tr> | ||
| + | </thead> | ||
| + | <tbody> | ||
| + | <tr> | ||
| + | <td>pR promoter</td> | ||
| + | <td>TAACACCGTGCGTGTTGACTATTTTACCTCTGGCGGTGATAATGGTTGC</td> | ||
| + | </tr> | ||
| − | < | + | <tr> |
| + | <td>GUIDE sequence</td> | ||
| + | <td>ATATCCAGTGATTTTTTTCTCCAT</td> | ||
| + | </tr> | ||
| + | |||
| + | <tr> | ||
| + | <td>Hfq binding domain</td> | ||
| + | <td>TTTCTGTTGGGCCATTGCATTGCCACTGATTTTCCAACATATAAAAAGA<br/>CAAGCCCGAACAGTCGTCCGGGCTTTTTTTCTCGAG</td> | ||
| + | </tr> | ||
| + | |||
| + | <tr> | ||
| + | <td>T1/TE terminator</td> | ||
| + | <td>TTTCGTTTTATCTGTTTTTGTCGGTGAACGCTCTCTACTAGAGTCACACT<br/>GGCTCACCTTCGGGTGGGCCTTTCTGCGTTTATA</td> | ||
| + | </tr> | ||
| + | |||
| + | </tbody> | ||
| + | </table> | ||
| + | </div> | ||
| + | <p><center><strong>Table 1</strong> The sequence of synthetized RNA silencing cassettes</center></p> | ||
| + | <p>Firstly, we designed and synthetized RNA silencing cassettes and construct it into pSB1AC3, an official plasmid which contains amp and cm resistance gene. Also, we used pSB1AC3+mRFP as control. Then we transfer the plasmids into chemical competent cell (DH5α) and add chloramphenicol of 50μg/ml to detect the knockdown effectiveness through the phenotype of survival index. We continuously measured the OD600 through the Bioscreen.</p> | ||
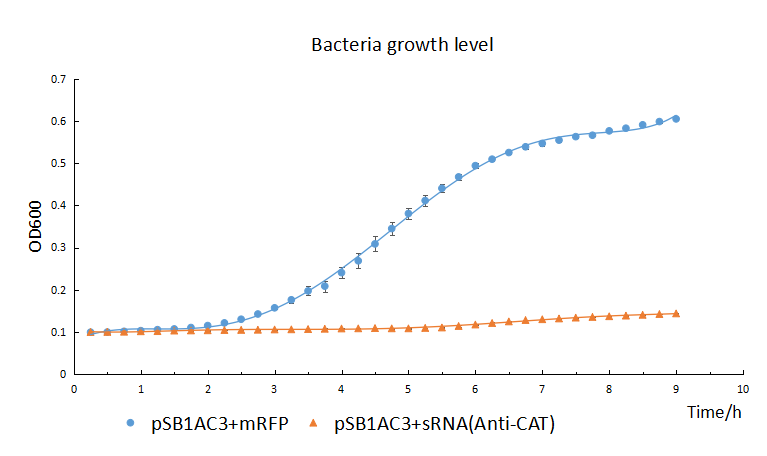
| + | <center><img src="https://static.igem.org/mediawiki/2016/0/0f/T--XMU-China--result_fig1_2_2.png" width="80%;" align="center"; style="margin-bottom:20px;"/></center> | ||
| + | <p><center><strong> Figure 2.2 </strong>The growth curves of bacteria with the sRNA cassettes or mRFP on the chloramphenicol of 50ng/μL.</center></p><br/> | ||
| + | <p>The growth of chemical competent cells(DH5α) with pSB1AC3+sRNA is significant repressed by the chloramphenicol (50μg/mL) compared with the control with pSB1AC3+mRFP (The blue line). It indicated the sRNA’s highly knockdown effectiveness.</p> | ||
| + | <p>From the result, we can found the OD600 of control group shows S-type growth trend. But the experimental group shows a low level all the time. It <span id="section-4">suggests</span> the growth of the bacteria which contain the sRNA cassettes significantly repressed by the chloramphenicol, which indicates the sRNA’s highly knockdown effectiveness.</p> | ||
| + | <h1 style="border-bottom: 1px solid #aaa;color: #8968CD;text-shadow: 0 0 1px black;margin-bottom:.6em;padding-top: 0; | ||
padding-bottom: -5%;">Model | padding-bottom: -5%;">Model | ||
</h1> | </h1> | ||
| Line 280: | Line 312: | ||
<center>$$\frac{dr}{dt} = K - D_{r}*r$$</center> | <center>$$\frac{dr}{dt} = K - D_{r}*r$$</center> | ||
| − | <p>\(K\) represents the transcription rate, which is a constant parameter, in molecules of RNA per second, \(D_{r}\) is the degradation rate expressed in units per seconds as it depends on how much mRNA is actually present on the cell, expressed by the variable | + | <p>\(K\) represents the transcription rate, which is a constant parameter, in molecules of RNA per second, \(D_{r}\) is the degradation rate expressed in units per seconds as it depends on how much mRNA is actually present on the cell, expressed by the variable "\(r\)" in units of molecules of mRNA produced.</p> |
<center>$$r = \frac{K}{D_{r}}+Ce^{-D_{r}t}$$</center> | <center>$$r = \frac{K}{D_{r}}+Ce^{-D_{r}t}$$</center> | ||
| Line 296: | Line 328: | ||
<h3><strong>Productive cells inside the system</strong></h3> | <h3><strong>Productive cells inside the system</strong></h3> | ||
| − | <p>The number of <em>E. coli</em> cells within the system can not be considered as a constant, neither as a linear function due to the exponential nature of cellular division. Given normal growth of the cell culture, it is possible to describe the number of <em>E. coli</em> cells as a function of time. Nevertheless, the <em>E. coli</em> concerning the model produces toxins that alter the number of <em>E. coli</em> cells itself, also there is a natural decrease in the number of bacteria caused by cellular death, resulting in the addition of new terms to the traditional equation. An equation considering all the previous factors is shown below. | + | <p>The number of <em>E. coli</em> cells within the system can not be considered as a constant, neither as a linear function due to the exponential nature of cellular division. Given normal growth of the cell culture, it is possible to describe the number of <em>E. coli</em> cells as a function of time. Nevertheless, the <em>E. coli</em> concerning the model produces toxins that alter the number of <em>E. coli</em> cells itself, also there is a natural decrease in the number of bacteria caused by cellular death, resulting in the addition of new terms to the traditional equation. An equation considering all the previous factors is shown below.</p> |
| + | |||
<center>$$C(t)=C_{0}e^{Gt}(1-D)-M*C$$</center> | <center>$$C(t)=C_{0}e^{Gt}(1-D)-M*C$$</center> | ||
<center>$$C(t)=C_{0}e^{Gt}(1-D)-M*C_{0}e^{Gt}(1-D)$$</center> | <center>$$C(t)=C_{0}e^{Gt}(1-D)-M*C_{0}e^{Gt}(1-D)$$</center> | ||
<center>$$C(t)=C_{0}e^{Gt}(1-D)(1-M)$$</center> | <center>$$C(t)=C_{0}e^{Gt}(1-D)(1-M)$$</center> | ||
| − | + | ||
<p>Where:<br/> | <p>Where:<br/> | ||
\(C_{0}\): Initial population [=] cells<br/> | \(C_{0}\): Initial population [=] cells<br/> | ||
| Line 329: | Line 362: | ||
padding-bottom: -5%;">Discussion | padding-bottom: -5%;">Discussion | ||
</h1> | </h1> | ||
| − | < | + | <p>From the experiment results, we found that the entire gene circuits can express well. <strong>Sensor</strong> was a specific and smart device, which could detect the quorum sensing molecules AHL and activated the following gene circuits when AHL reached threshold value and stayed “off” state under the threshold value. <strong>Switch</strong> was a perfect device, which delay the expression of lysis (represented by <i>gfp</i>) so that responder (represented by <i>cfp</i>) had enough time to express. Also, responder test showed that sRNA is a dramatically weapon with high knockdown effectiveness. So if we connected these perfect parts into a synthetic biological device and transformed it into chemical competent cell (DH5α), we can get powerful bacterial soldier to fight and beat antibiotic resistant bacteria.</p> |
| + | <h1 style="border-bottom: 1px solid #aaa;color: #8968CD;text-shadow: 0 0 1px black;margin-bottom:.6em;padding-top: 0; | ||
padding-bottom: -5%;">Reference | padding-bottom: -5%;">Reference | ||
</h1> | </h1> | ||
| + | <p>[1] Bernheim, A. G., Libis, V. K., Lindner, A. B. & Wintermute, E. H. Phage-mediated Delivery of Targeted sRNA Constructs to Knock Down Gene Expression in <i>E.coli</i>. <i>J. Vis. Exp.</i> <strong>109</strong>, 1–10(2016). <br/> | ||
| + | [2] Kobayashi, H., Kærn, M. & Araki, M. et al. Programmable cells: Interfacing natural and engineered gene networks. <i>PNAS</i> <strong>101</strong>, 8414-8419(2004). | ||
| + | </p> | ||
</div> | </div> | ||
</div> | </div> | ||
| Line 347: | Line 384: | ||
<img src="https://static.igem.org/mediawiki/2016/5/55/T--XMU-China--main-logo_and_.png" style="width: 10%; display: inline-block; margin-left: 6%;margin-top:-7%;" /> | <img src="https://static.igem.org/mediawiki/2016/5/55/T--XMU-China--main-logo_and_.png" style="width: 10%; display: inline-block; margin-left: 6%;margin-top:-7%;" /> | ||
| − | <a href="http:// | + | <a href="http://en.xmu.edu.cn/" target="_blank"><img src="https://static.igem.org/mediawiki/2016/d/de/T--XMU-China--xmulogo_and_.png" style="width: 9%; display: inline-block; margin-left: 6%;margin-top:-6%;" /></a> |
<img src="https://static.igem.org/mediawiki/2016/f/f0/T--XMU-China--foot-xmuname_and_.png" style="width: 15%; display: inline-block; margin-left: 1%;margin-top:-6%;" /> | <img src="https://static.igem.org/mediawiki/2016/f/f0/T--XMU-China--foot-xmuname_and_.png" style="width: 15%; display: inline-block; margin-left: 1%;margin-top:-6%;" /> | ||
| Line 361: | Line 398: | ||
<span style="font-size: 14px; color: #fff; margin-top: 10%; margin-bottom: 0px;padding-left:3%;">igemxmu@gmail.com</span> | <span style="font-size: 14px; color: #fff; margin-top: 10%; margin-bottom: 0px;padding-left:3%;">igemxmu@gmail.com</span> | ||
</div> | </div> | ||
| − | |||
| − | |||
</div> | </div> | ||
</div> | </div> | ||
| Line 406: | Line 441: | ||
setTimeout("$('#loader').fadeOut('fast')",1000) | setTimeout("$('#loader').fadeOut('fast')",1000) | ||
var obtn=document.getElementById('btn'); | var obtn=document.getElementById('btn'); | ||
| − | |||
var clientHeight=document.documentElement.clientHeight; | var clientHeight=document.documentElement.clientHeight; | ||
var timer=null; | var timer=null; | ||
Latest revision as of 01:45, 20 October 2016
Proof Of Concept
Verities never lie.


CONTACT US
 https://www.facebook.com/IGEM-XMU-China-1067638406629389
 https://www.twitter.com/Amoy_igem
 igemxmu@gmail.com
Name: XMU-China School: Xiamen University
Address: Xiamen University, No. 422, Siming South Road, Xiamen, Fujian, P. R. China 361005
CONTACT US
https://www.facebook.com/IGEM-XMU-China-1067638406629389
https://www.twitter.com/Amoy_igem
igemxmu@gmail.com
Name: XMU-China School: Xiamen University
Address: Xiamen University, No. 422, Siming South Road, Xiamen, Fujian, P. R. China 361005