Team:Valencia UPV/CP

Cas9:gRNA complex formation
Overview

Since Cas9 and gRNA constructions are delivered in the host, they will be transcribed (and translated in the case of Cas9) by the cell’s machinery. When Cas9 and grNA find each other in the plant nucleus, they will interact forming the Cas9:gRNA complex.
This complex will perform the knockout in the Testing System construction. Thus, there is a clear relation between the amount of this complex and the light signal produced. Optimizing the complex formation, we will be able to optimize the light measurements.
Studying this process, our aim was to analyze its stability under different conditions. Using Mass Action Kinetics, Quasi Steady State Analysis and Direct Lyapunov Method, we determined conditions to reach the steady state that provides the optimum amount of Cas9:gRNA complex. Firstly, we analyze the interaction between Cas9 and gRNA, following with a study of agroinfiltration times in the second section.

ODEs
Biochemical reactions
All the process takes place in the nucleus. The dynamics of these species can be represented by the following set of reactions:
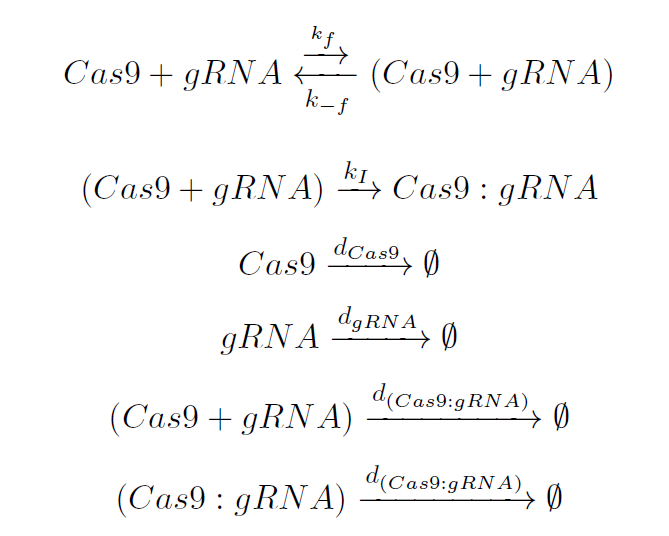
The involved guide-RNA (gRNA) molecule has two main parts: the scaffold and the spacer. The first one is recognized by the inactive Cas9, resulting in an intermediate complex (Cas9 + gRNA) which is unstable. This reaction governed by the rate kf. Afterwards, it takes place the conformational change of the Cas9 endonuclease, leading to an irreversible isomerization, represented by the constant kI. Finally, the Cas9:gRNA complex is ready to scan the genome.
System of equations
Elements from reactions on the left are usually expressed in terms of concentration ([Cas9], [gRNA], [Cas9+gRNA], [Cas9:gRNA]). We rename those concentrations using the variables x1=[Cas9], x2= [gRNA], x3= [Cas9+gRNA], and x4=[Cas9:gRNA].
Then, using Mass Action Kinetics, we can build the system of Ordinary Differential Equations:

This model represents the dynamics of two elements which interact affecting the steady-state condition of each other. Constants α1 and β1 reflect a continuous input of x1 (Cas9) and x2 (gRNA).
Initially, Cas9 and gRNA constructions get to the cell by viral infection. Thus, if the subject of study was a cell population, the flux of Cas9 and gRNA would vary according to the spread of the viral infection among cells. However, from an individual perspective, once a cell has been infected it constitutively produces Cas9 and gRNA. Thus, production of both elements in a single cell, fits the typical behavior of constitutive production, i.e. reaches the steady-state after certain time. This permanent production is equivalent to the constant input of Cas9 and gRNA in the cell, reflected in terms α1 and β1, respectively.
Terms α2⋅x1⋅x2 and β2⋅x1⋅x2 describe the exchange of Cas9 (x1) and grNA (x2) when they interact. Finally, α3⋅x1 and β3⋅x2 represent the disappearance of both species (x1 and x2) from the system, by degradation or dillution.
Steady state analysis
Steady state conditions of the system will be determined by the stability of the interaction between Cas9 and gRNA. Thus, equations (eq. 1) and (eq. 2) expressing the variation of these elements, must be analyzed in order to characterize the behavior of the system. They fit to the general expression of the following model:

This model represents the dynamics of two elements which interact affecting the steady-state condition of each other. As α3 is the degradation rate of Cas9 and it is being compared to the degradation of the gRNA (β3), we can assume that α3 is depreciable in relation to β3, which is the dominant degradation term. Therefore, the model is simplified, resulting in the equilibrium positions:

Using the Direct Lyapunov Method (3), we can get two expressions which can be used to know about the stability of the system given a solution. Further details about the mathematical discussion to demonstrate the use of the Direct Lyapunov Method are available in our Mathematical discussion.
If conditions σ<0 and Δ>0 are provided, it can be assumed that the system will achieve a local stability. Replacing each model parameter (Table 1) by its value in our particular case, steady-state solutions are:


Therefore we can assume that stability conditions of the system (eq. 13) and (eq. 14) are achieved, considering that our system is locally stable around the equilibrium point:

Parameters
| Parameter in general expression | Particular Value | Numeric Value (min-1) | Source |
|---|---|---|---|
| α1 | kCas9 | 0.000374737 | (16) |
| α2 | kf | 0.00006 | (16) |
| α3 | δCas9 | 0.0000552 | (16) |
| β1 | kgRNA | 0.0025284 | (16) |
| β2 | kf | 0.00006 | (16) |
| β3 | δgRNA | 0.000252 | (16) |
Simulations
Cas9 and gRNA interaction
Once we analytically determined that our solution was feasible and robust, we simulated in Matlab the same conditions in order to check if the steady-state values obtained analytically were the expected ones. As is can be seen in graphics below, the equilibrium values predicted analytically are very close to those obtained simulating in Matlab. There is a small difference between analytical and experimental results. This is probably due to the difference in the theoretical value of α3, which is presumably zero, and the value introduced in simulations, which is not null (value in Table 1).
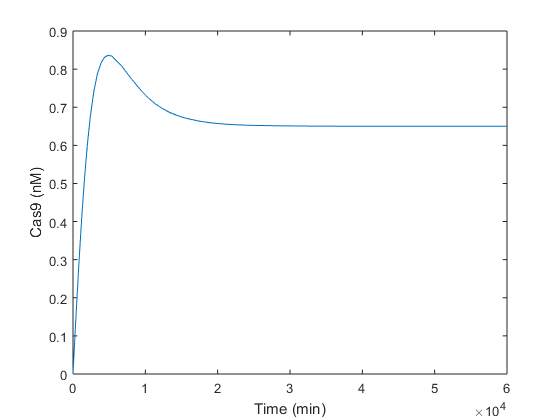
Simulations performed let us check the equilibrium values obtained analytically. Analyzing Figure 1, it is observed that Cas9 endonuclease is produced reaching its maximum at the time of peak tp = 4877 minutes, i.e. 4 days approx. From day 4, there is enough of both compounds in order to form the Cas9:gRNA complex, explaining the decay in Cas9 after 4 days from infiltration. Four days later, at t≈10 days (15000 minutes), Cas9 reaches its steady-state near the 0.7 nM predicted analytically. This behavior is similar to a Second Order System response after a step input. It reaches the equilibrium value with a time slope of ts = 2380 minutes, i.e. 1 day and 15 hours.
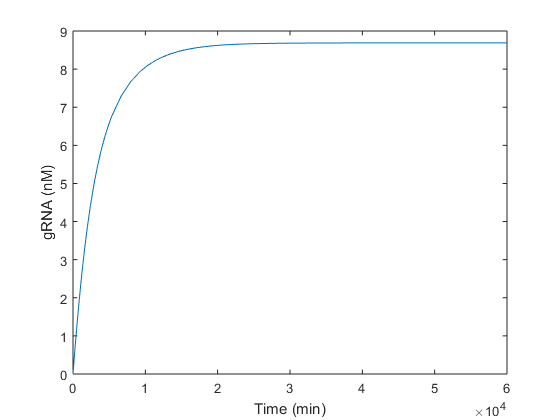
Regarding the gRNA (Figure 2), it is produced without any oscillation. The maximum production (8.6 nM) is reached between around the 13th day, and the 63 % of this value at τ ≈3400 minutes. As gRNA has a dynamic considerably faster than Cas9, it keeps growing until the endonuclease is produced. As soon as this happens, Cas9 and gRNA are used to form the Cas9:gRNA complex. Thus, the peak in Figure 1 makes reference to this complex formation. In Figure 2 this consumption is not appreciated because there is plenty more gRNA disposable than gRNA used to form the complex with Cas9 produced.
However, using one gene copy number is not a current laboratory condition. As production of Cas9 and gRNA is directly related to the number of gene copies, higher amounts of them are a more realistic subject of study. Since terms K’Cas9 and K’gRNA are a function of the number of copies, changing this parameter the equilibrium values will be affected. Following graphics represent different results varying the gene copy number only for Cas9, only for gRNA and finally for both of them.
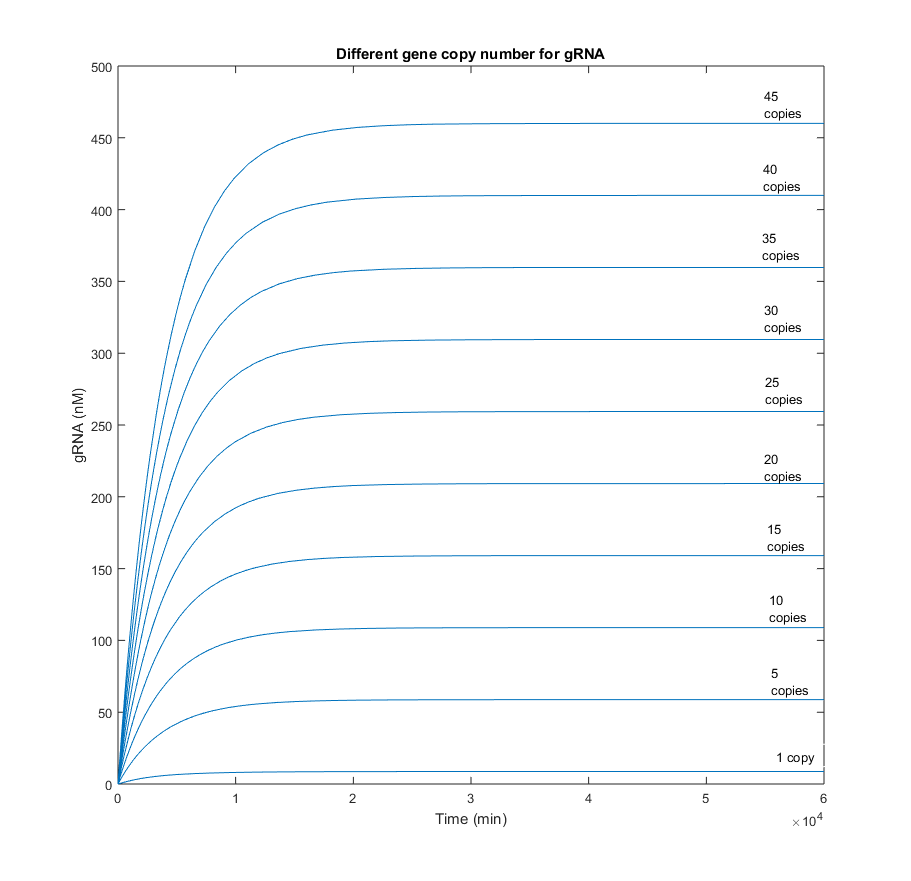
gRNA gene copy number
In the following simulations the gene copy number of the gRNA was increased gradually from 1 to 45. Results obtained each 5 copies were plotted to analyze the stability of Cas9 when the gRNA is produced faster and in higher quantities.
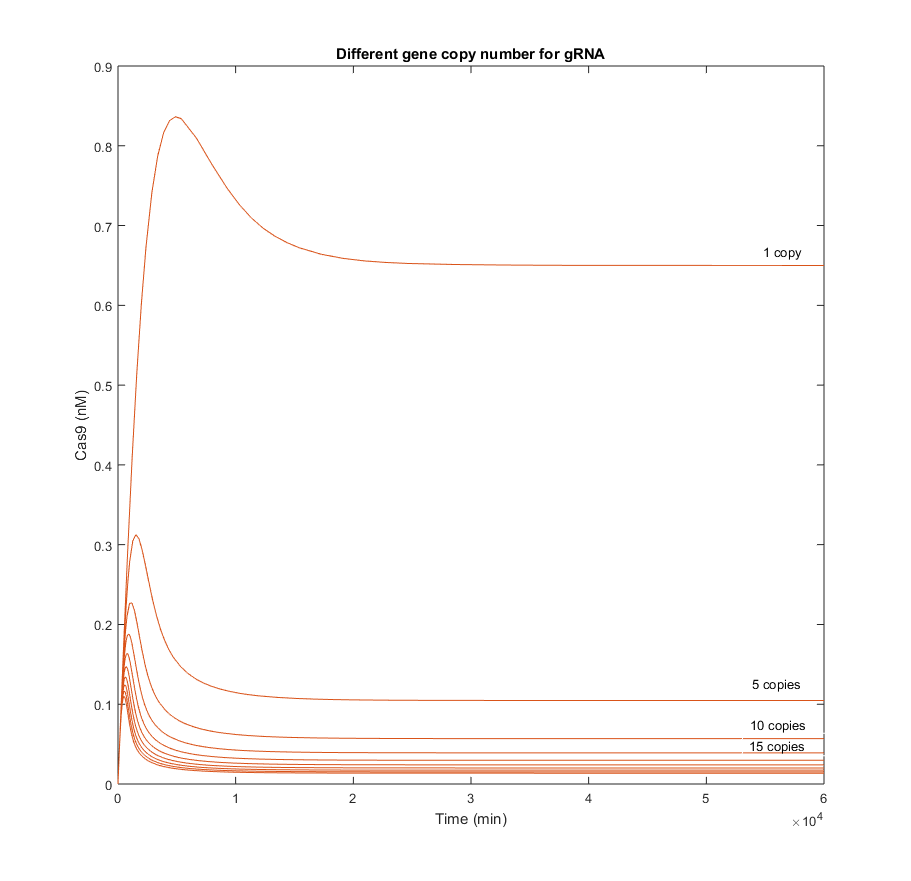
From the simulations above, it is clear that Cas9 efficacy is highly sensitive to the presence of gRNA in the nucleus. The biggest difference among concentrations of Cas9 in the graphic above, is produced between the result with 1 copy and the result with 5. This means that even though Cas9 production is not increased, the endonuclease will be able to find the gRNA and form complexes with it. There is an indirect relation between the maximum Cas9 presence, the tp at which this maximum is reached, and the amount of gRNA. It seems quite logical, as the more gRNA present, the more likely it will be that all Cas9 produced is consumed to form the complex with those gRNAs.
From the picture below, it can be confirmed that an increment in the Cas9 gene copy number, affects homogeneously to the quantity of gRNA. Qualitatively is has the same behavior as in the scenario with one copy. The only difference is reflected in a gain of the steady-state gRNA value, which increases in 5-fold from the previous simulation with 5 gene copies less.
Cas9 gene copy number
When the gene copy number for Cas9 is increased, the production of the endonuclease behaves similarly to the gRNA in the picture above. However, the slope is considerably less. This difference in the dynamics was expected, as it is known that RNA reactions are several orders faster than protein ones.
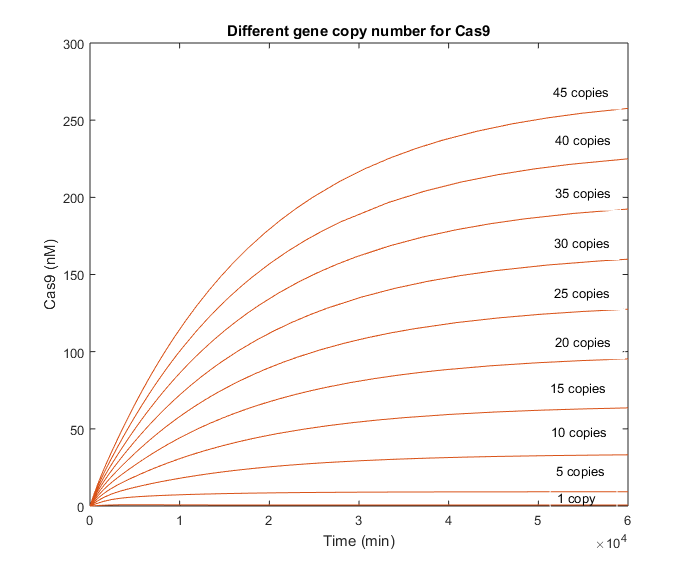
There is no decrease in the Cas9 evolution that let us know when does the interaction with the gRNA begin. However, the beginning of this reaction is well appreciated in the graphic with the gRNA evolution.
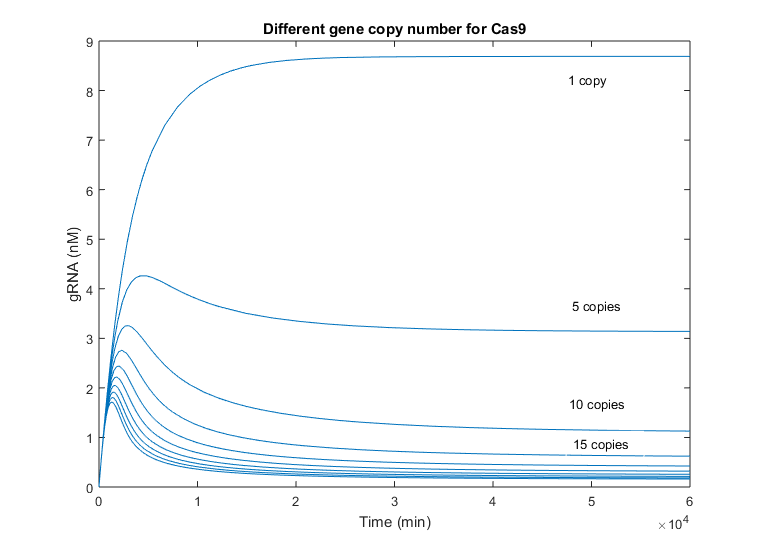
As it is mentioned above, the initial slope of gRNA is considerably faster than Cas9’s, as gRNA only means transcription but Cas9 must be translated as well, delaying its growing. This behavior is comparable to Cas9 variations when the gRNA copy number was increased. However, the difference between simulations with one copy number and 5 copies, are less remarkable in this case, reaching the half of the one-copy steady state value in this case. Again, this difference is smaller due to the fast production of gRNA. The time of peak changes as well among simulations with different number of Cas9 gene copies, being the maximum at approx. 5000 minutes, i.e. 3 and a half days. The minimum time peak is produced near 2 days after production.
gRNA and Cas9 gene copy numbers
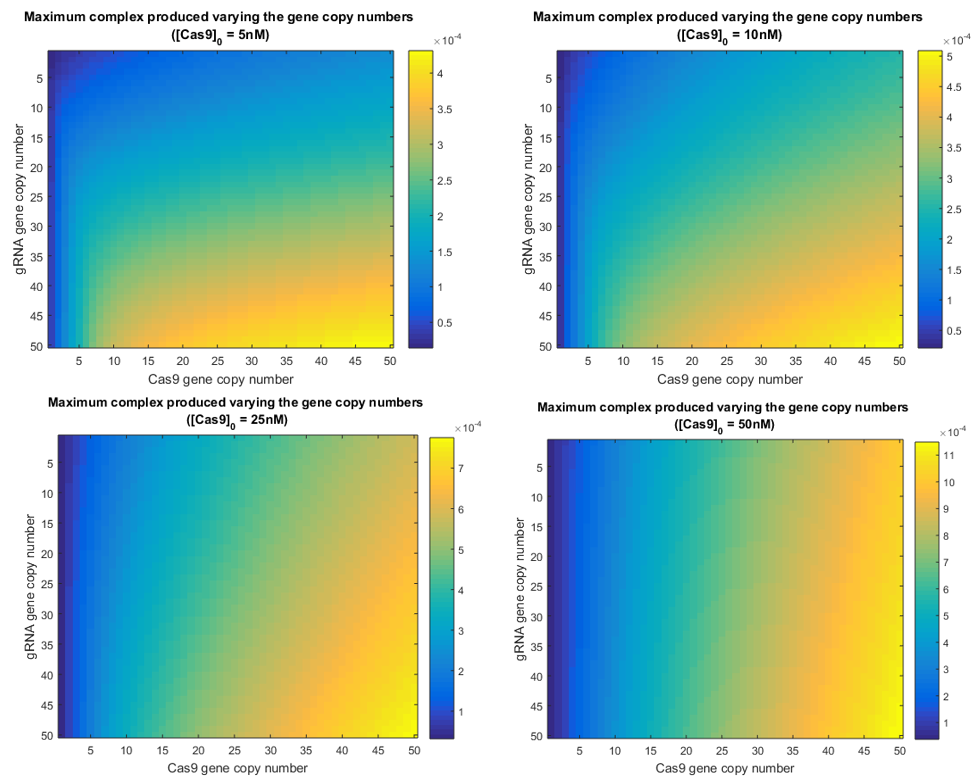
Simulations varying both gene copy numbers simultaneously were performed. This time the amount of intermediate complex produced was calculated. Results obtained are shown in the following graphic:
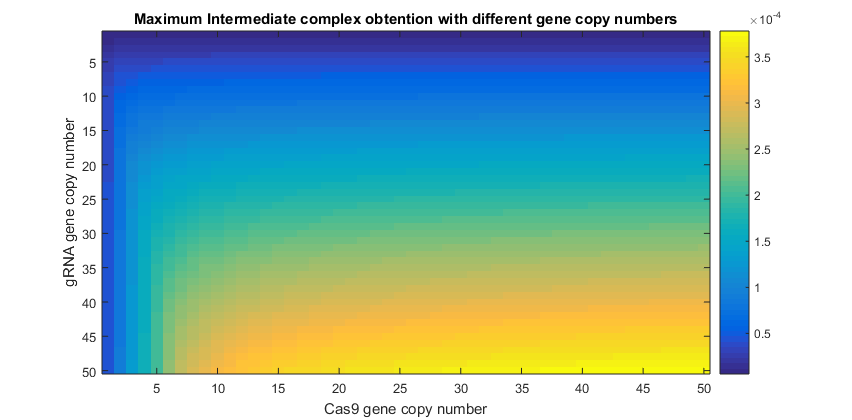
From this results it can be inferred that the amount of complex being produced is very sensitive to the amount of Cas9 in the nucleus. This is reflected in the higher values of complex when Cas9 gene copy number has reached only the value of 5. Necessary amounts of gRNA to increase the intermediate presence, are higher than those needed for Cas9. This means that gRNA will be the limiting reagent of this process (14). Though this may refute the fact that gRNA is produced faster by cell’s machinery, its fast degradation explains why this element is limiting the Cas9:gRNA complex ready to perform the knockout.
Therefore, less amount of Cas9 will not be as determining as less amount of gRNA. It will be critical to provide the system with the necessary gRNA in order to let enough complex be formed. Otherwise, less knockouts would be performed in the Testing System and light signal recorded during Luciferase assays would be less significant.
Agroinfiltration times
Experimentally Cas9 and gRNA can be infiltrated at the same or at different times in the plant. The difference between Cas9 and gRNA dynamics is known and it should be considered in order to improve the performance of our Testing System.
Next scenarios will assume that Cas9 has been introduced few days earlier than gRNA, letting time enough to be produced until reaching a certain concentration. Simulations now considered an existing amount of Cas9 when the gRNA is not present yet (point 0).
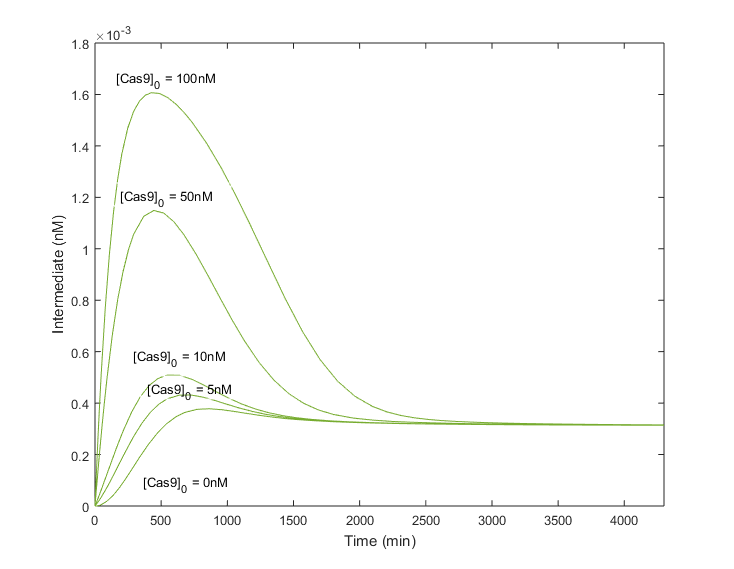
As expected, infecting plants previously with Cas9 to let it be produced, improves considerably the amount of complex obtained. Moreover, the tp does not change drastically in comparison with null [Cas9] initial conditions, being around 1000 minutes. The steady state is achieved as well without compromising the stability of the system. Therefore, greater amounts of the complex will be produced in less time, or in other words, the efficiency of the system will be increased if the Cas9 is already in the cell when the gRNA is infiltrated.
In graphics above it can be appreciated how the system becomes more robust as more Cas9 is available in the cell nucleus. The advantage of reducing the importance of the gRNA presence, is that the amount of light signal will not be perturbed by a low gRNA concentration. Thus, the Testing System output will vary according to the efficiency of the gRNA to find the target, and not relying on other external factors such as the cell’s efficiency in the gRNA transcription.
Main remarks
The usual lab protocol considers the simultaneous agroinfiltration of the gRNA and the Cas9. However, in simulations we observed that the production of the complex could be maximized if Cas9 was agroinfiltrated in first place.
