Model
Contents
Overview
When we were discovering audio-genetics, to find correspondences between our mechanosensitive(MS) channels and different sound wavelengths, we needed the support of modeling and logical result ascription besides constructing a huge mutagenesis library and testing them in vitro continuously, although it is already very hard to do. We designed the experiment based on the discovery of the mechanism of MS channel and applying it on the regulation of downstream gene expression. Modeling has been our guide throughout the project and we finally got the result we initially expected.
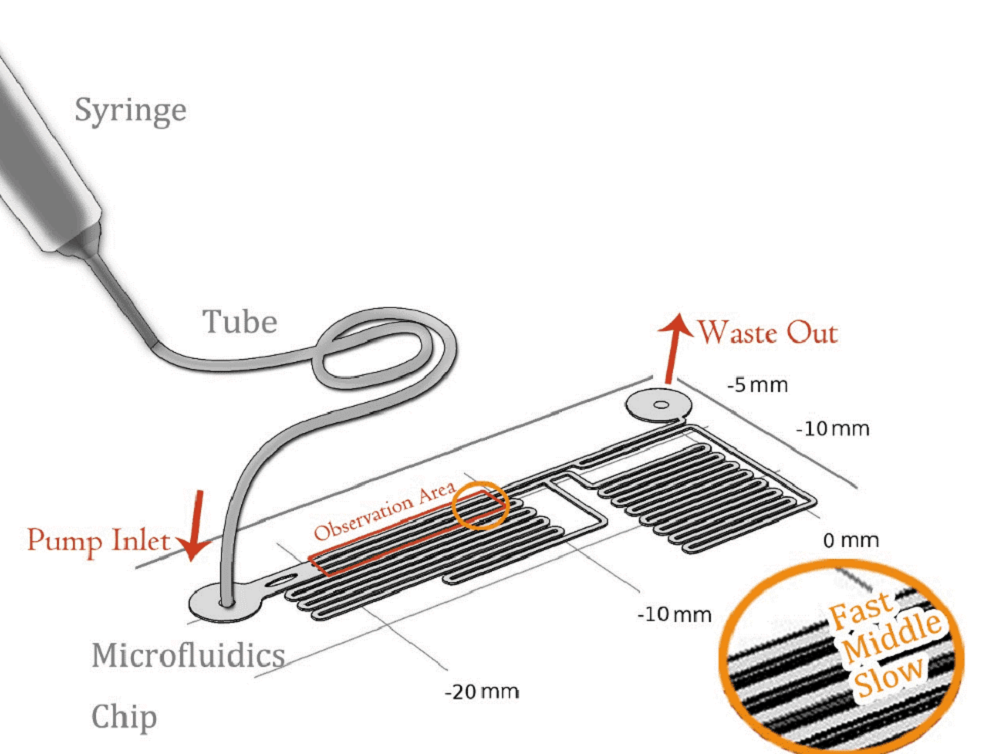
In one part, we employed microfluidics to realize the stable force field controlled by fluidic velocity. In-vitro experiments were operated on the designed chips. On the other hand, we used various devices to generate sound field and tested cell response in different conditions.
Finite Element Analysis (FEA) was applied to modeling of the field generated by the microfluidic devices and the acoustic stimulators. Modeling reliability has been tested and confirmed by comparing the calculated result with raw results from the experiments.
Force of Field
To quantitatively measure the response of MS channel on the cell membrane, we designed our experiment manipulated on microfluidic chip. CHO-K1 cells were cultured adherent on the bottom of PDMS tunnel. Stable and flexible force field could be formed surrounding cell, which directly controlled by the pumped-inflow rate. Each time when we applied a constant pumped inflow, cells in 3 different observation tunnel could receive corresponding small, middle, large, 3 level of force magnitude(1: 9: 81). By changing the pumped flow rate, we could measure MS channel response under a series of forces with different magnitude order.
Mathematical Demonstration
In experiment, when fluid(culture medium x flowed through the tunnel, the shear force was applied on the wall. Seeing the culture medium as a Newtonian flow, it has a constant viscosity μ,0.012dyn·s/cm2[1]. The shear stress that medium generated on the wall is proportional to strain rate. As a result, we could relate the magnitude of stress to the velocity gradient along the transversal surface of each tunnel.
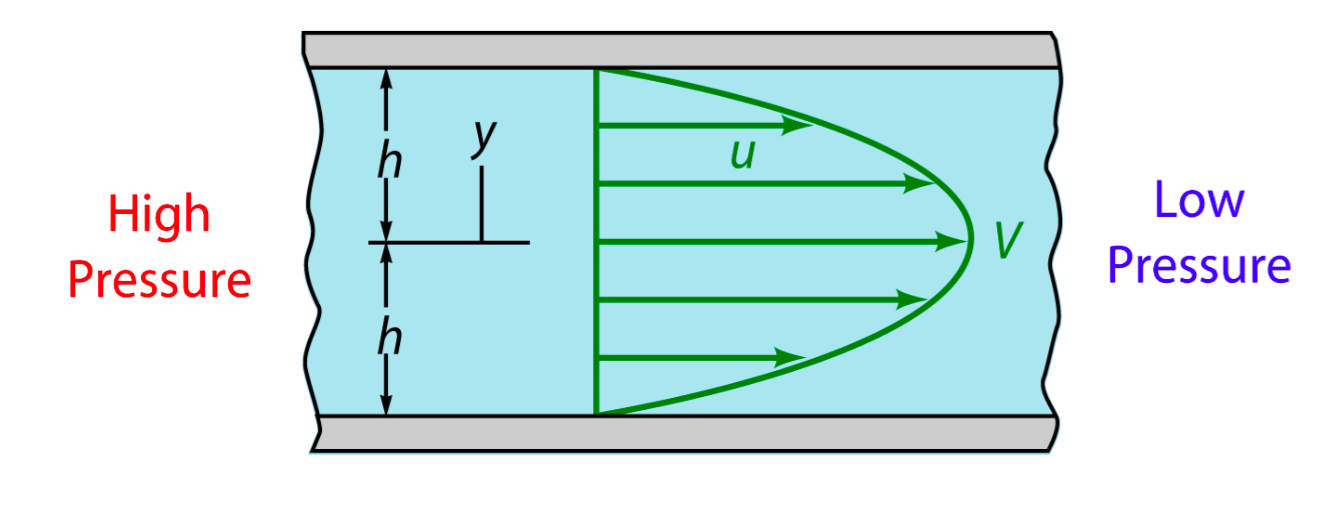
Due to the extremely small scale of microfluidic tunnel (only 0.285mm of width and 0.090mm of height), fluid in it observes the Laminar flow. We could assume there is no turbulence when inflow applied constantly, even at the corners, and the head loss of the pumped inflow could also be ignored. The modeling of flow between 2 parallel plates applies to such stable state, in which the magnitude of shear stress on the bottom is proportional to the maximum velocity( at the longitudinal central line).
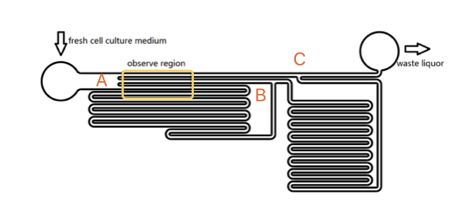
As the shear stress is proved proportional to the flow rate in the tunnel, we designed the chip to achieve that each of 3 tunnels in observation area has the same transversal surface but the gradient (81: 9: 1 from up to bottom) flow rate, also the average speed.
The lengths of straight tunnels between AB and AC (LAB, LAC)are 14.3mm and 12.0mm, and the curved tunnels between AB and BC(RAB, RBC) are 108.0 mm and 105.0mm.
Based on the integral form of the continuity equation for an incompressible fluid, during a given time, the sum of flow volume in each branch is equal to the total volume pumped in the whole chamber. According to the Kirchhoff's law, the accumulation of flow speed at the joint point must be zero. It is easy to get the equation that\begin{matrix} L_{AC}V_1=L_{AB}V_2+R_{AB} V_3 \\ V_2:V_3=R_{AB}:L_{AB} \end{matrix} Consequently, we could reach the conclusion that the maximum velocity, average flow rate and the shear force on the bottom of each tunnel is at a ratio of 81:9:1. To confirm the modeling result, we made calibration in real microfluidics chip, and the testing result is very close to designing value (about 80:10:1) (See the Measurement page)
Experimental result Analysis
On October 12th, we testify one of our MS channels, Piezo1, under the simulation of shear stress, with R-GECO fluorescent indicating its activation level. (results shown below)
Simulation
References
- ↑ Booth, R., & Kim, H. (2012). Characterization of a microfluidic in vitro model of the blood-brain barrier (μBBB). Lab on a Chip, 12(10), 1784-1792.


