Hardware
Model
Contents
Overview
Successfully directed evolution of mechanosensitive (MS) channel relays on the precise measurement of the MS channel’s mechanical sensitivity. When MS channels are stimulated by mechanical force, a Ca2+ influx is triggered, which can induce downstream gene expression by using NFAT.
To quantitively test the performance of MS channels, a standard method to generate force field was applied. Microfluidics was designed to study the MS channel sensitivity to fluidic shear force. In sonic stimulation part, we designed both ultrasonic and audible sonic simulation hardware.
See the detailed modeling process in | Model
Microfluidics
Microfluidics is a multidisciplinary field intersecting engineering, physics, chemistry, biochemistry, nanotechnology, and biotechnology, with practical applications in the design of systems in which low volumes of fluids are processed to achieve multiplexing, automation, and high-throughput screening.[1] Microfluidic instrument allows fluids to pass through different channels of different diameter, usually ranging from 5 to 500 μm.[2] Owning to its characteristic of small dimension. It can save reagents and also haves smaller requirement of samples. In the last decades, the basic techniques of microfluidics for the study of cells such as cell culture, cell separation, and cell lysis, have been well developed. Based on cell handling techniques, microfluidics has been widely applied in the researches of the cell biology.[3]
Why Microfluidics
In our project, to diminish the misgiving because of transfection and quantitively analyze the following experimental result, we have to test if different shear stress will result in different cellular response . With a pump applied, accurate flow rate controlling can be achieved in microfluidic chips. After calculation and simulation of fluid dynamics, relationship between the shear force on the cellular membrane and fluorescence intensity of the cells can be gotten.
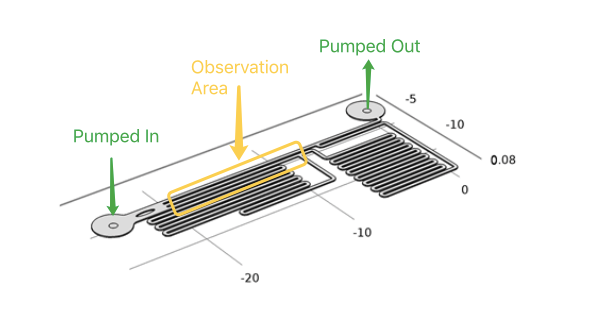
As the dimensions of the microfluidic devices are reduced, physics characteristics in conventional laboratory-scale is not applied. Usually the fluid flow in microfludic chips is laminar flow(Reynolds number<3). It leads to a drastic simplification of the complex Navier-Stokes equations describing fluid mechanics. For these reasons, dedicated microfluidic instruments have been designed to precisely control fluids inside the channels. Each time when we applied a constant pumped inflow, cells in 3 different observation channel would receive corresponding small, middle, large, 3 level of force magnitude(around 1: 9: 81). By changing the pumped flow rate, we could measure MS channel response under a series of force with different magnitude order.
Syringe pump programmed by ourselves is a great tool for stimulation of accurate intensity and duration. In our experiment, the fluid flow will be maintained for about 2 min. Only after the cells have recovered from the last experiment (indicated by reverting to normal fluorescence intensity), would we start the next round of shear force stimulation.
During the experiment, the cells must tightly adhere to the channel bottom, by treating microfludics channel with gelatin, cell could adhere to the treated surface of glass slide. Once the cell have adhere to the glass slide, syringe pump was used to control the influx of medium to apply shear stress on the channel walls. The fluorescence intensity of the cells would increased within a second by using R-GECO as an indicator of the intracellular calcium concentration. Live cell imaging system can capture its signal and record the data throughout whole experimental period, then, Matlab analysis was applied. For the cells which has a longer response time employing NFAT signal pathway, the change of gene expression(green fluorescent as downstream) can be observed under live cell imaging system after 20 hours.
Microfluidic chips in our experiment were made by polydimethylsiloxane (PDMS) fixed on a slide of glass. PDMS is the material for fast prototyping microfluidic devices. PDMS chips are widely used in laboratories, especially in the academic community due to their low cost and ease of fabrication. Here are listed the main advantages of such chips:
- Oxygen and gas permeability
- Optical transparency, robustness
- Non toxicity
- Biocompatibility
- No water permeability
One of the main drawbacks of PDMS chips is its hydrophobicity. Consequently, introducing aqueous solutions into the channels are difficult and hydrophobic analytes can adsorb onto the PDMS surface. Fortunately, there are now PDMS surface modification methods such as gas phase processing methods and wet chemical methods (or combination of both) to avoid issues due to hydrophobicity which we also employed in our experiment. After the fabrication of microfluidics channels having been made by polydimethylsiloxane, they were treated with oxygen plasma for hydrophilic property. After this procedure, polydimethylsiloxane could bond to glass tightly, and channels in chips would be hydrophilic for medium to pass thorough.
How to fabricate
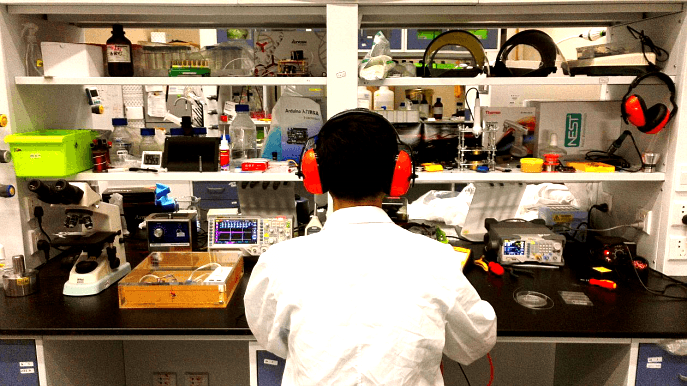
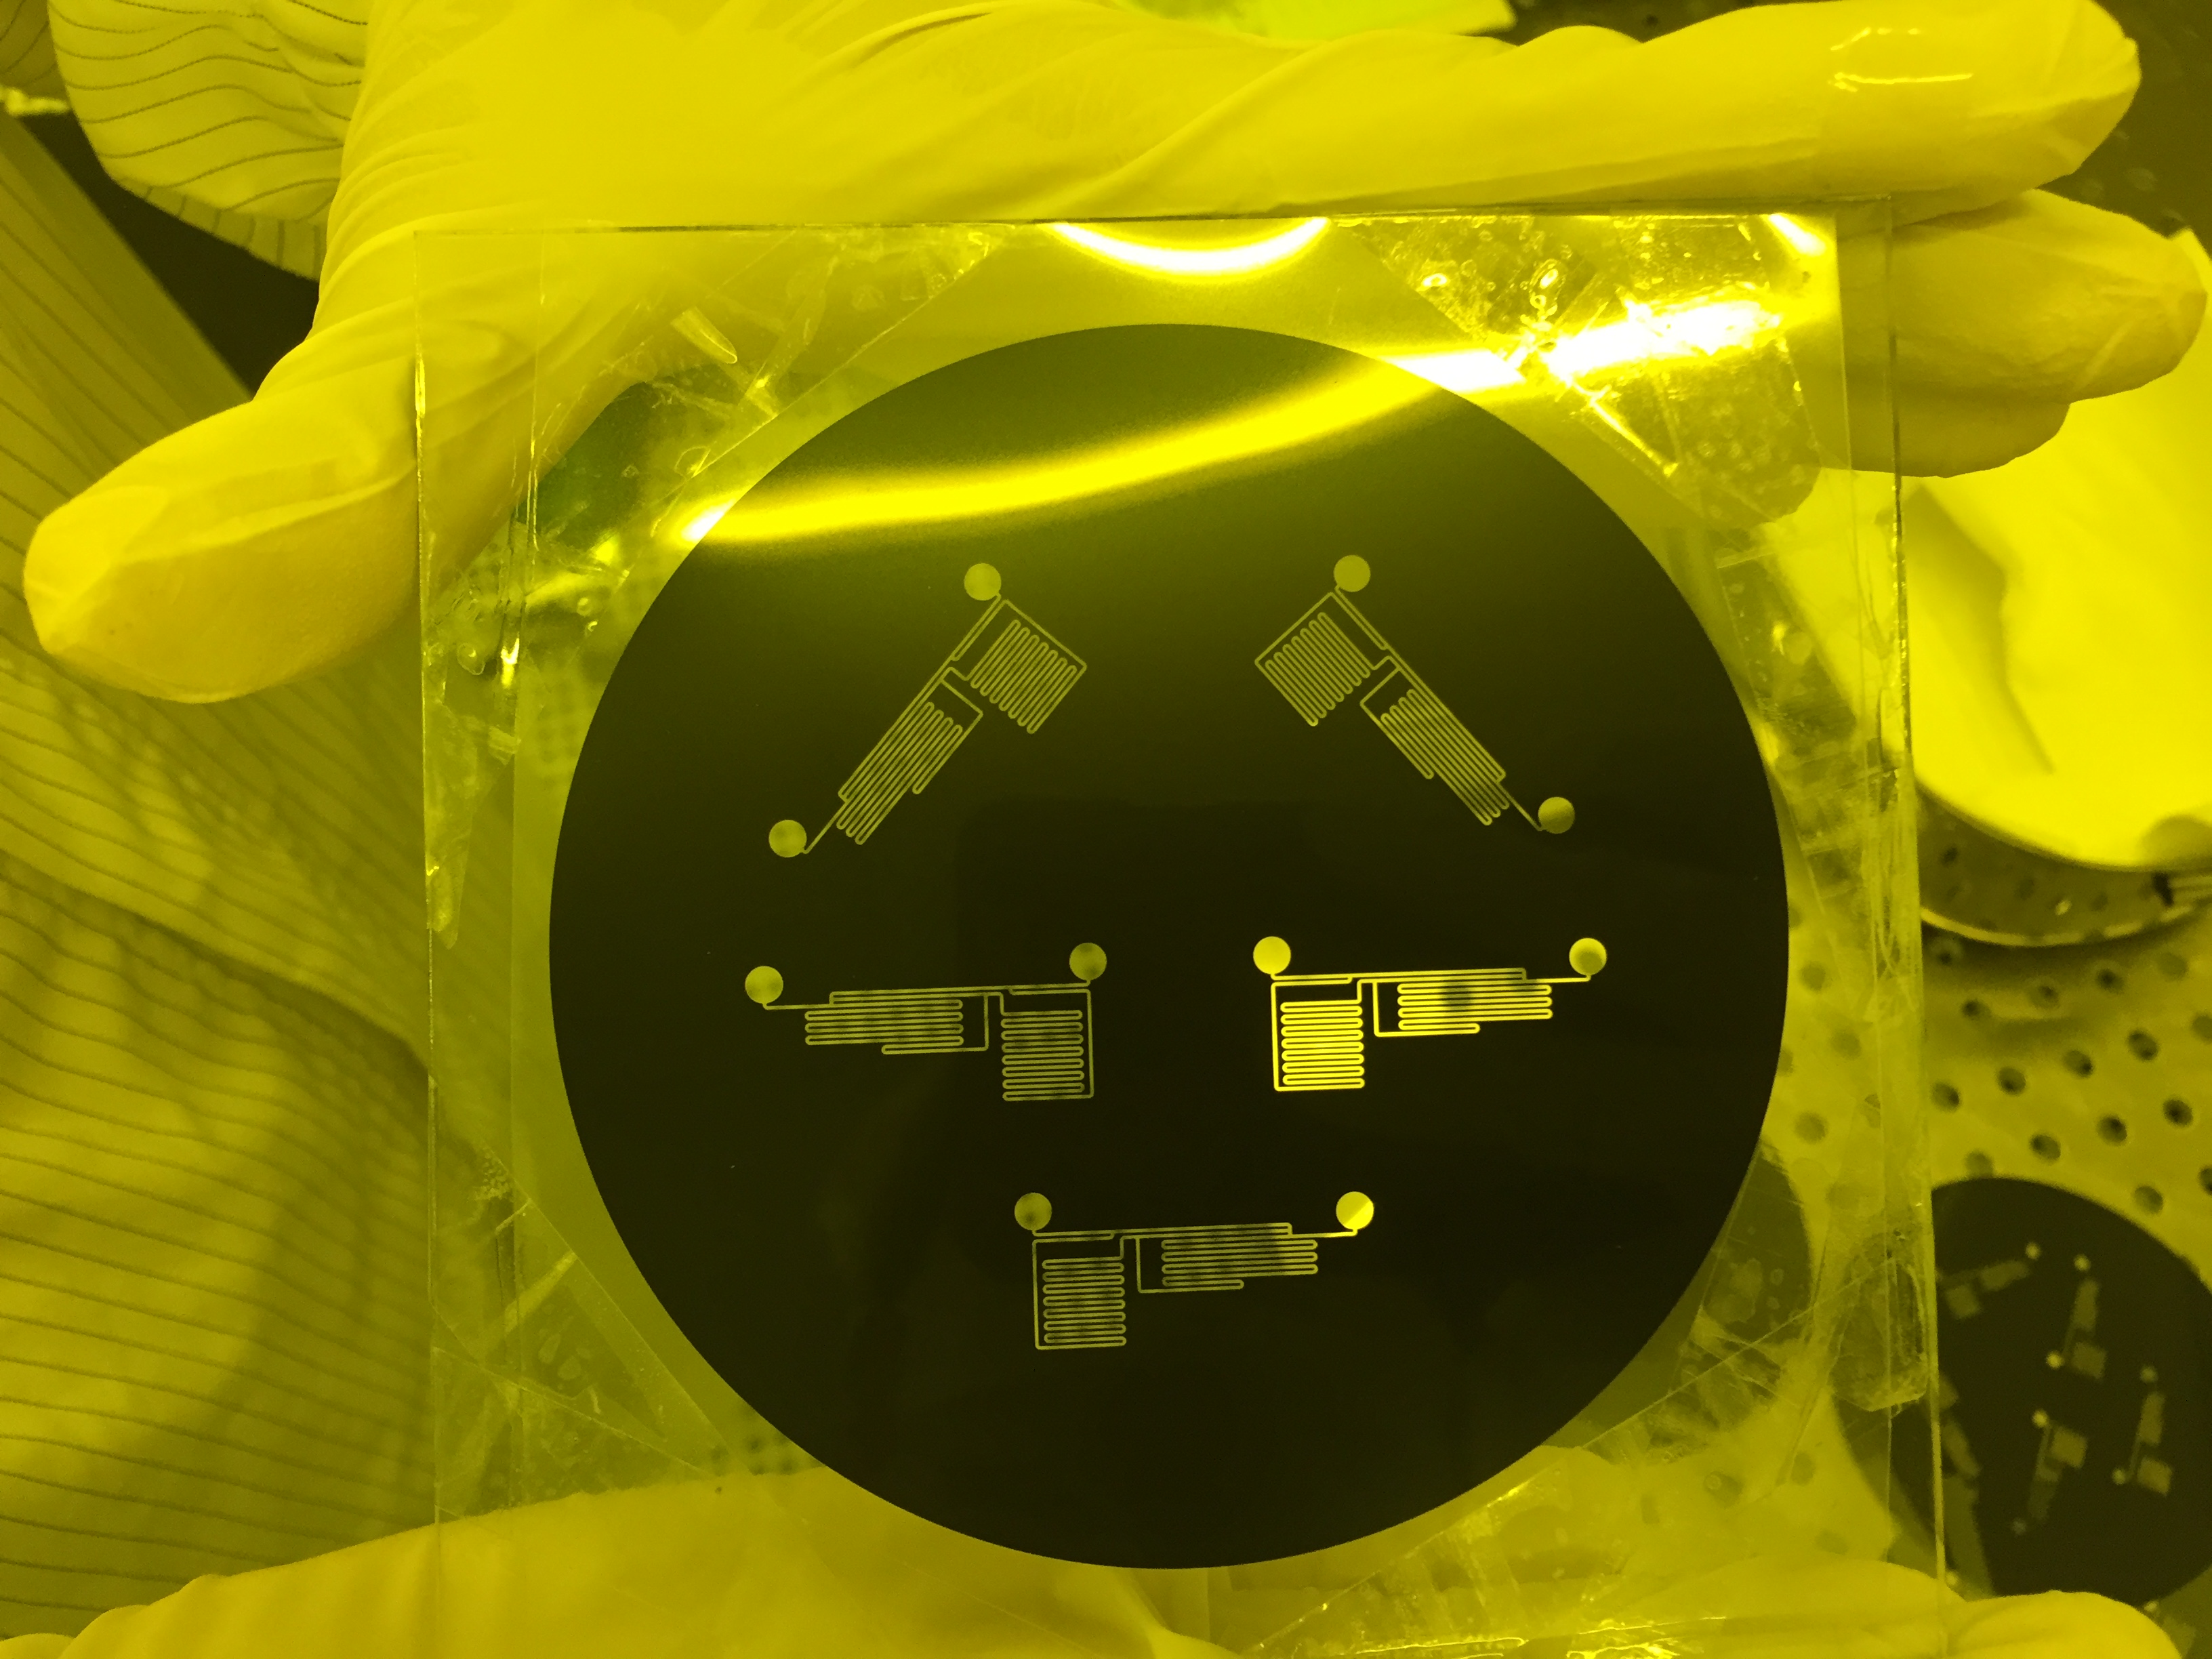
After reading existing papers about the processing technology typically used in microfluidic chips production and endless trial experiment, we have formed our own processing protocol based on our equipments and requirements.
The microfluidic chips used in our project were all produced using this protocol.
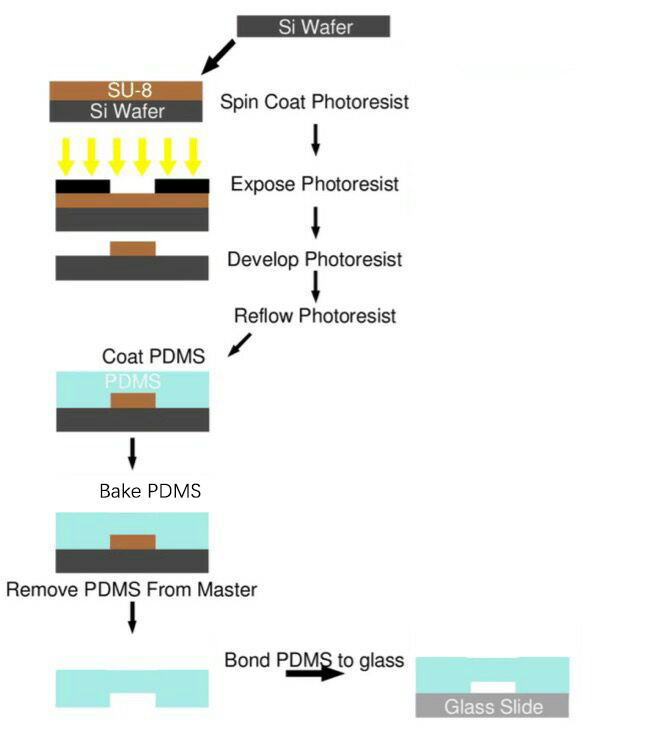
Process Overview
SU-8 Photoresist can cross-link to a network of polymer when exposed to short wavelength light. If the cross-linked network has formed, it cannot be dissolved by the SU-8 developer. So if we place a photo mask to shade the light shine on the photoresist, we can make a copy of the pattern on the photo mask.
Both PDMS and glass contains silicon element. When they were treated by oxygen plasma, unstable hydroxyl group will form on the treated surface. When they get close enough, two hydroxyl group will dehydrate and bond together covalently.
Sound Stimulation Devices
Acoustic Devices
Various devices generating frequencies from 300Hz to 1.7MHz were made to find the best acoustic condition for cell response. Cell toxic experiments were also done for each device to find if a sound generator can be used drenched into culture medium.
Audible Frequency
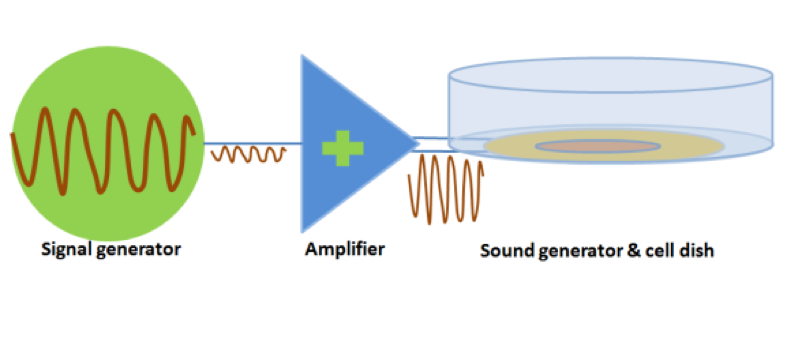
Audible sound is defined as 20Hz to 20KHz sound wave. We designed modulated devices to generate audile signals properly to stimulate cells. Three kinds of sound generators were used for audible sonic stimulation. Each one has its specific range of frequency and power as is shown in the following table.
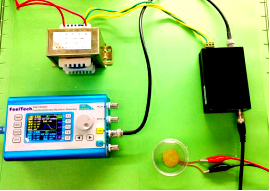
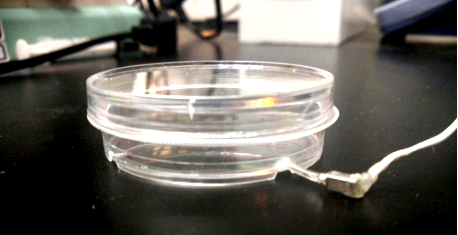
The signal was generated by a signal generator. After magnified by an amplifier, the signal was sent to a sound generator, which can be buzzer, balanced amature or speaker. As all of the three sound generators showed cell toxicity in some extent, sound generators were kept outside the cell dish and sonic stimulation was transmitted by air or PS plastics. Each one has its specific range of frequency and power which is shown in the following table.
| Sound generator | Frequency | Power | Transmission medium | Evaluation |
|---|---|---|---|---|
| Buzzer | 3KHz-20KHz | 0-1W | PS plastic (cell dish) | Strong cell response at 15KHz and 20KHz. |
| Balanced amature | 1KHz-15KHz | 0-100mW | Air, water | No cell response observed. |
| Speaker | 300Hz-5KHz | 0-3.5W | Air, water | No cell response observed. |
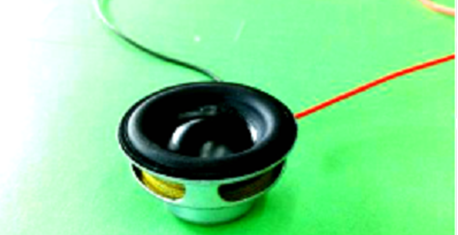
Fig. Balanced amature sonic stimulation device and speaker used for sonic stimulation
Table 1. Three kinds of sound generators used for audible sonic stimulation.
Experiment Results
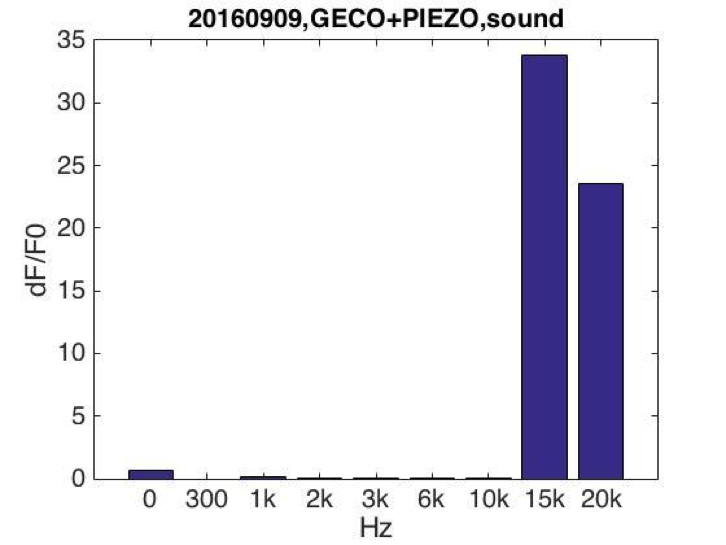
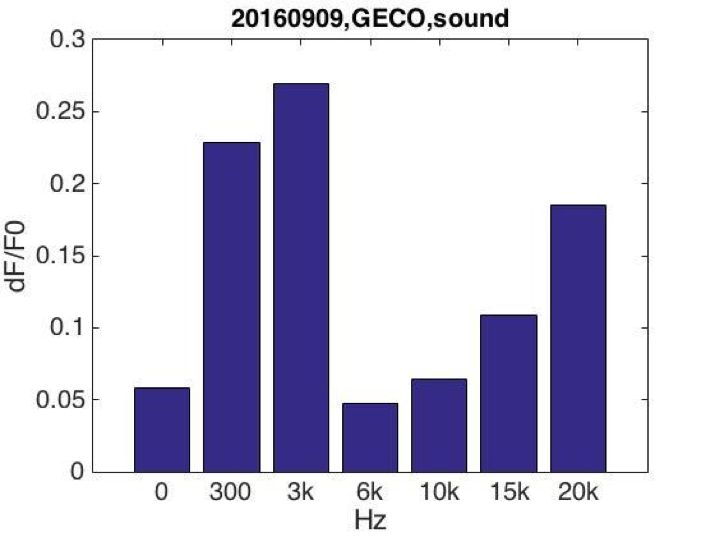
After testing all of the three sound generators above, we found that only buzzers induced obvious cell response in high frequency conditions (15KHz and 20KHz). Analysis in wave physics that the energy loss is the least under the condition that buzzers attached to the bottom of cell dish. Poly Styrene plastic medium is efficient to transmit energy to cell.
A
BFig. Cell fluorescence response when stimulated by buzzers emitting sound of different frequencies. (A) Cell fluorescence intensity increased greatly when stimulated by 15K and 20KHz sound. While no obvious fluorescence intensity change when GECO cells (without MS channel) were stimulated (B).
Ultrasound devices
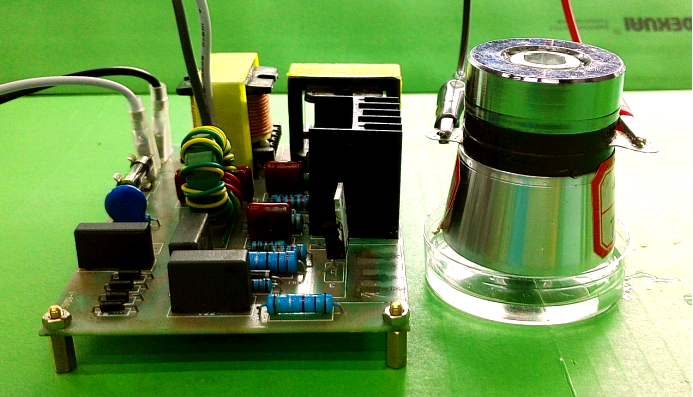
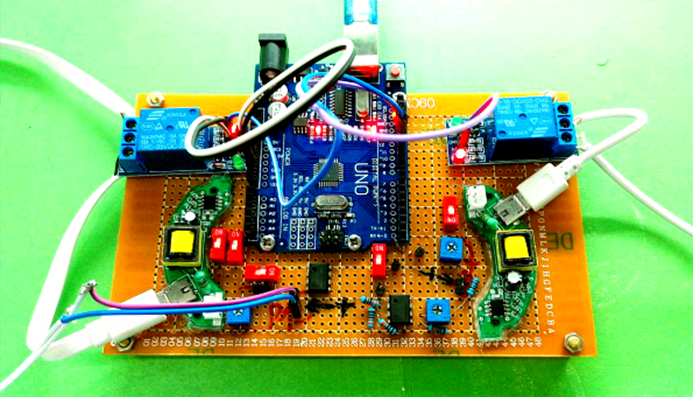
After seeing cell response in audible sonic frequency. We designed ultrasound experiment part using these 4 kinds of ultrasonic devices we made. We did cytotoxicity experiment for each ultrasonic transducer for 20 hours. The experiment result was marked in the following table.
| Device | Frequency & power | Description | Evaluation |
|---|---|---|---|
| Device1 | 28KHz 40W |
Large thermal power consumed. Low ultrasonic radiant power. Cell atoxic. |
No cell response observed. Quickly damaged. |
| Device2 | 108KHz 4.1W |
Calibrated, Quantitive stimulation. Programmable, Cell atoxic. |
Strong cell response observed. |
| Device3 | 1.1MHz Adjustable power | Calibrated, Quantitative and power adjustable stimulation. Cell atoxic. | Weak cell response observed. |
| Device4 | 1.7MHz Adjustable power | Power adjustable. Low Cytotoxicity. | No cell response observed. |
 File:T--SUSTech Shenzhen--calibrated-1.1M-adj.png
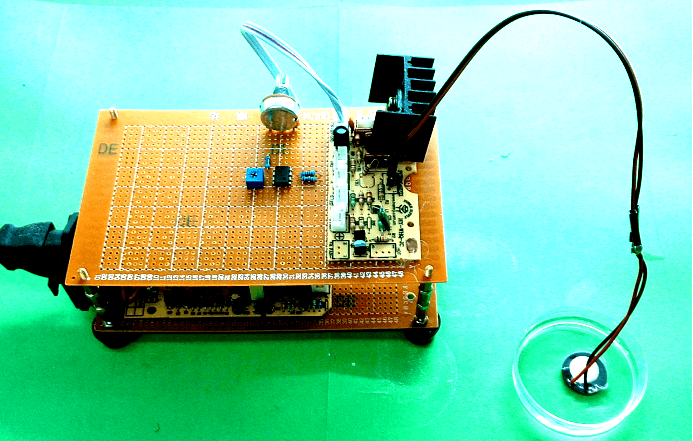
Fig. Hardware established for ultrasonic stimulation. (A) Device1 (B)Device2 (C)Device3 (D) Device4
Experimental Results
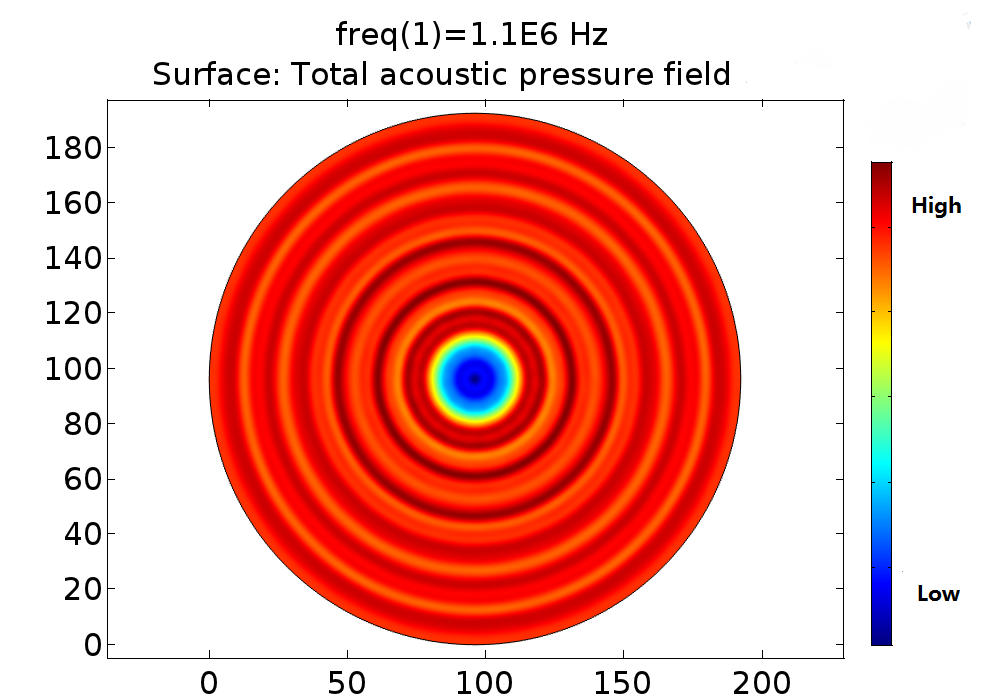
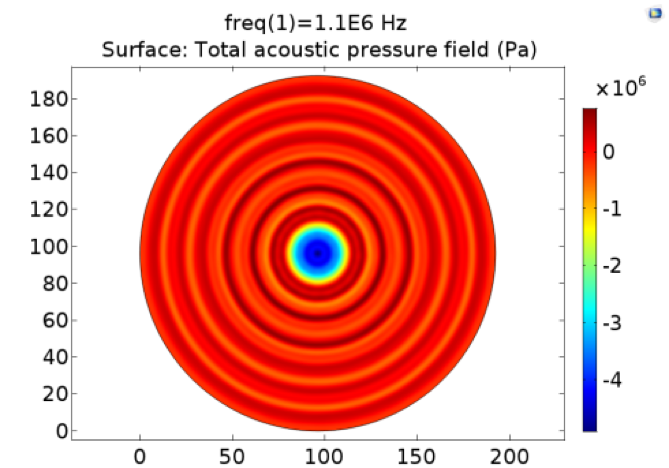
Pressure fields of 108KHz and 1.1MHz transducers were simulated for different power and distance. The pressure field distribution changes smoothly, while the pressure distribution was quite chaos in condition of 1.1MHz. Only strong cell response was observed for 108KHz condition as shown in Fig. .No obvious cell response was observed for 1.1MHz stimulation.
A
BFig. A. Pressure distribution of 108KHz ultrasonic transducer, the transducer was 1.0mm far above the cell layer, 251700 Pa was added to the transducer-water interface. B Pressure distribution of 1.1MHz ultrasonic transducer, the transducer was 1.0mm far above the cell layer. 60V voltage was input to drive the 1.1MHz transducer thus 528000 Pa was added to the transducer-water interface.
In experiment, 108KHz ultrasonic device induced a strong cell response as is shown in the following. However, no cell response was observed when cells were stimulated by 1.1MHz transducer.
Fig. Fluorescence response of R-GECO+Poezo1 cell when stimulated by 108KHz ultrasonic transducer from 10s to 30s. The fluorescence intensity increased for more than 5 times.
Detailed information about design and parameters
[1]Saffar, S., & Abdullah, A. (2014). Simple method for measuring vibration amplitude of high power airborne ultrasonic transducer: Using thermo-couple. Ultrasonics, 54(3), 821-825.

