Hardware
Model
Contents
Overview
Successful directed-evolution of mechanosensitive (MS) channel relys on the precise measurement of the mechanical sensitivity of MS channels. When they are stimulated by mechanical force, a Ca2+ influx is triggered, which in turn induces downstream NFAT promoter.
To quantitatively test the mechanical properties of MS channels, a standard method to generate force field was developed and evaluated. Microfluidics was designed to study the MS channel response to fluidic shear force. In sonic stimulation part, we developed both ultrasonic and audible sonic simulation hardware.
See the related modeling process in Model
Microfluidics
Microfluidics is an experimental methodology integrating multiple disciplines such as biology, bioengineering, physics, chemistry, nanotechnology, and material sciences. It includes design and fabrication of small devices in which low volumes of fluids are processed to achieve automation, and high-throughput screening.[1] Microfluidic chips allows fluids to pass through different channels of different diameter, usually ranging from 5 to 500 μm.[2] Owning to its characteristic small dimensions, it saves valuable reagents and requires small amount of samples. In the past decades, the basic techniques of microfluidics for the study of cells such as cell culture, cell separation, and cell lysis, have been well developed. Based on cell handling techniques, microfluidics has been widely applied in the research of cell biology.[3]
Why Microfluidics
Without prior knowledge of the range of shear stress sensible by Piezo1 and TRPC5 channel, we would like to simultaneously apply different mechanical stresses to different cells in one experiment, so that the cellular responses can be quantitatively characterized. The flow speed in a microfluidic chip can be modulated with flow rate, tightly tunable with a syringe pump, and the cross-section of the channel, determined with the microfabrication process. After calculation and simulation of fluid dynamics, relationship between the flow speed and shear stress can be readily obtained.
Specifically, as the dimensions of the microfluidics devices being reduced, physics characteristics in conventional laboratory-scale are no longer applied. Usually the fluid flow in microfludic chips is laminar flow (Reynolds number<3). It leads to a drastic simplification of the complex Navier-Stokes equations describing fluid mechanics.
Our Microfluidics Design
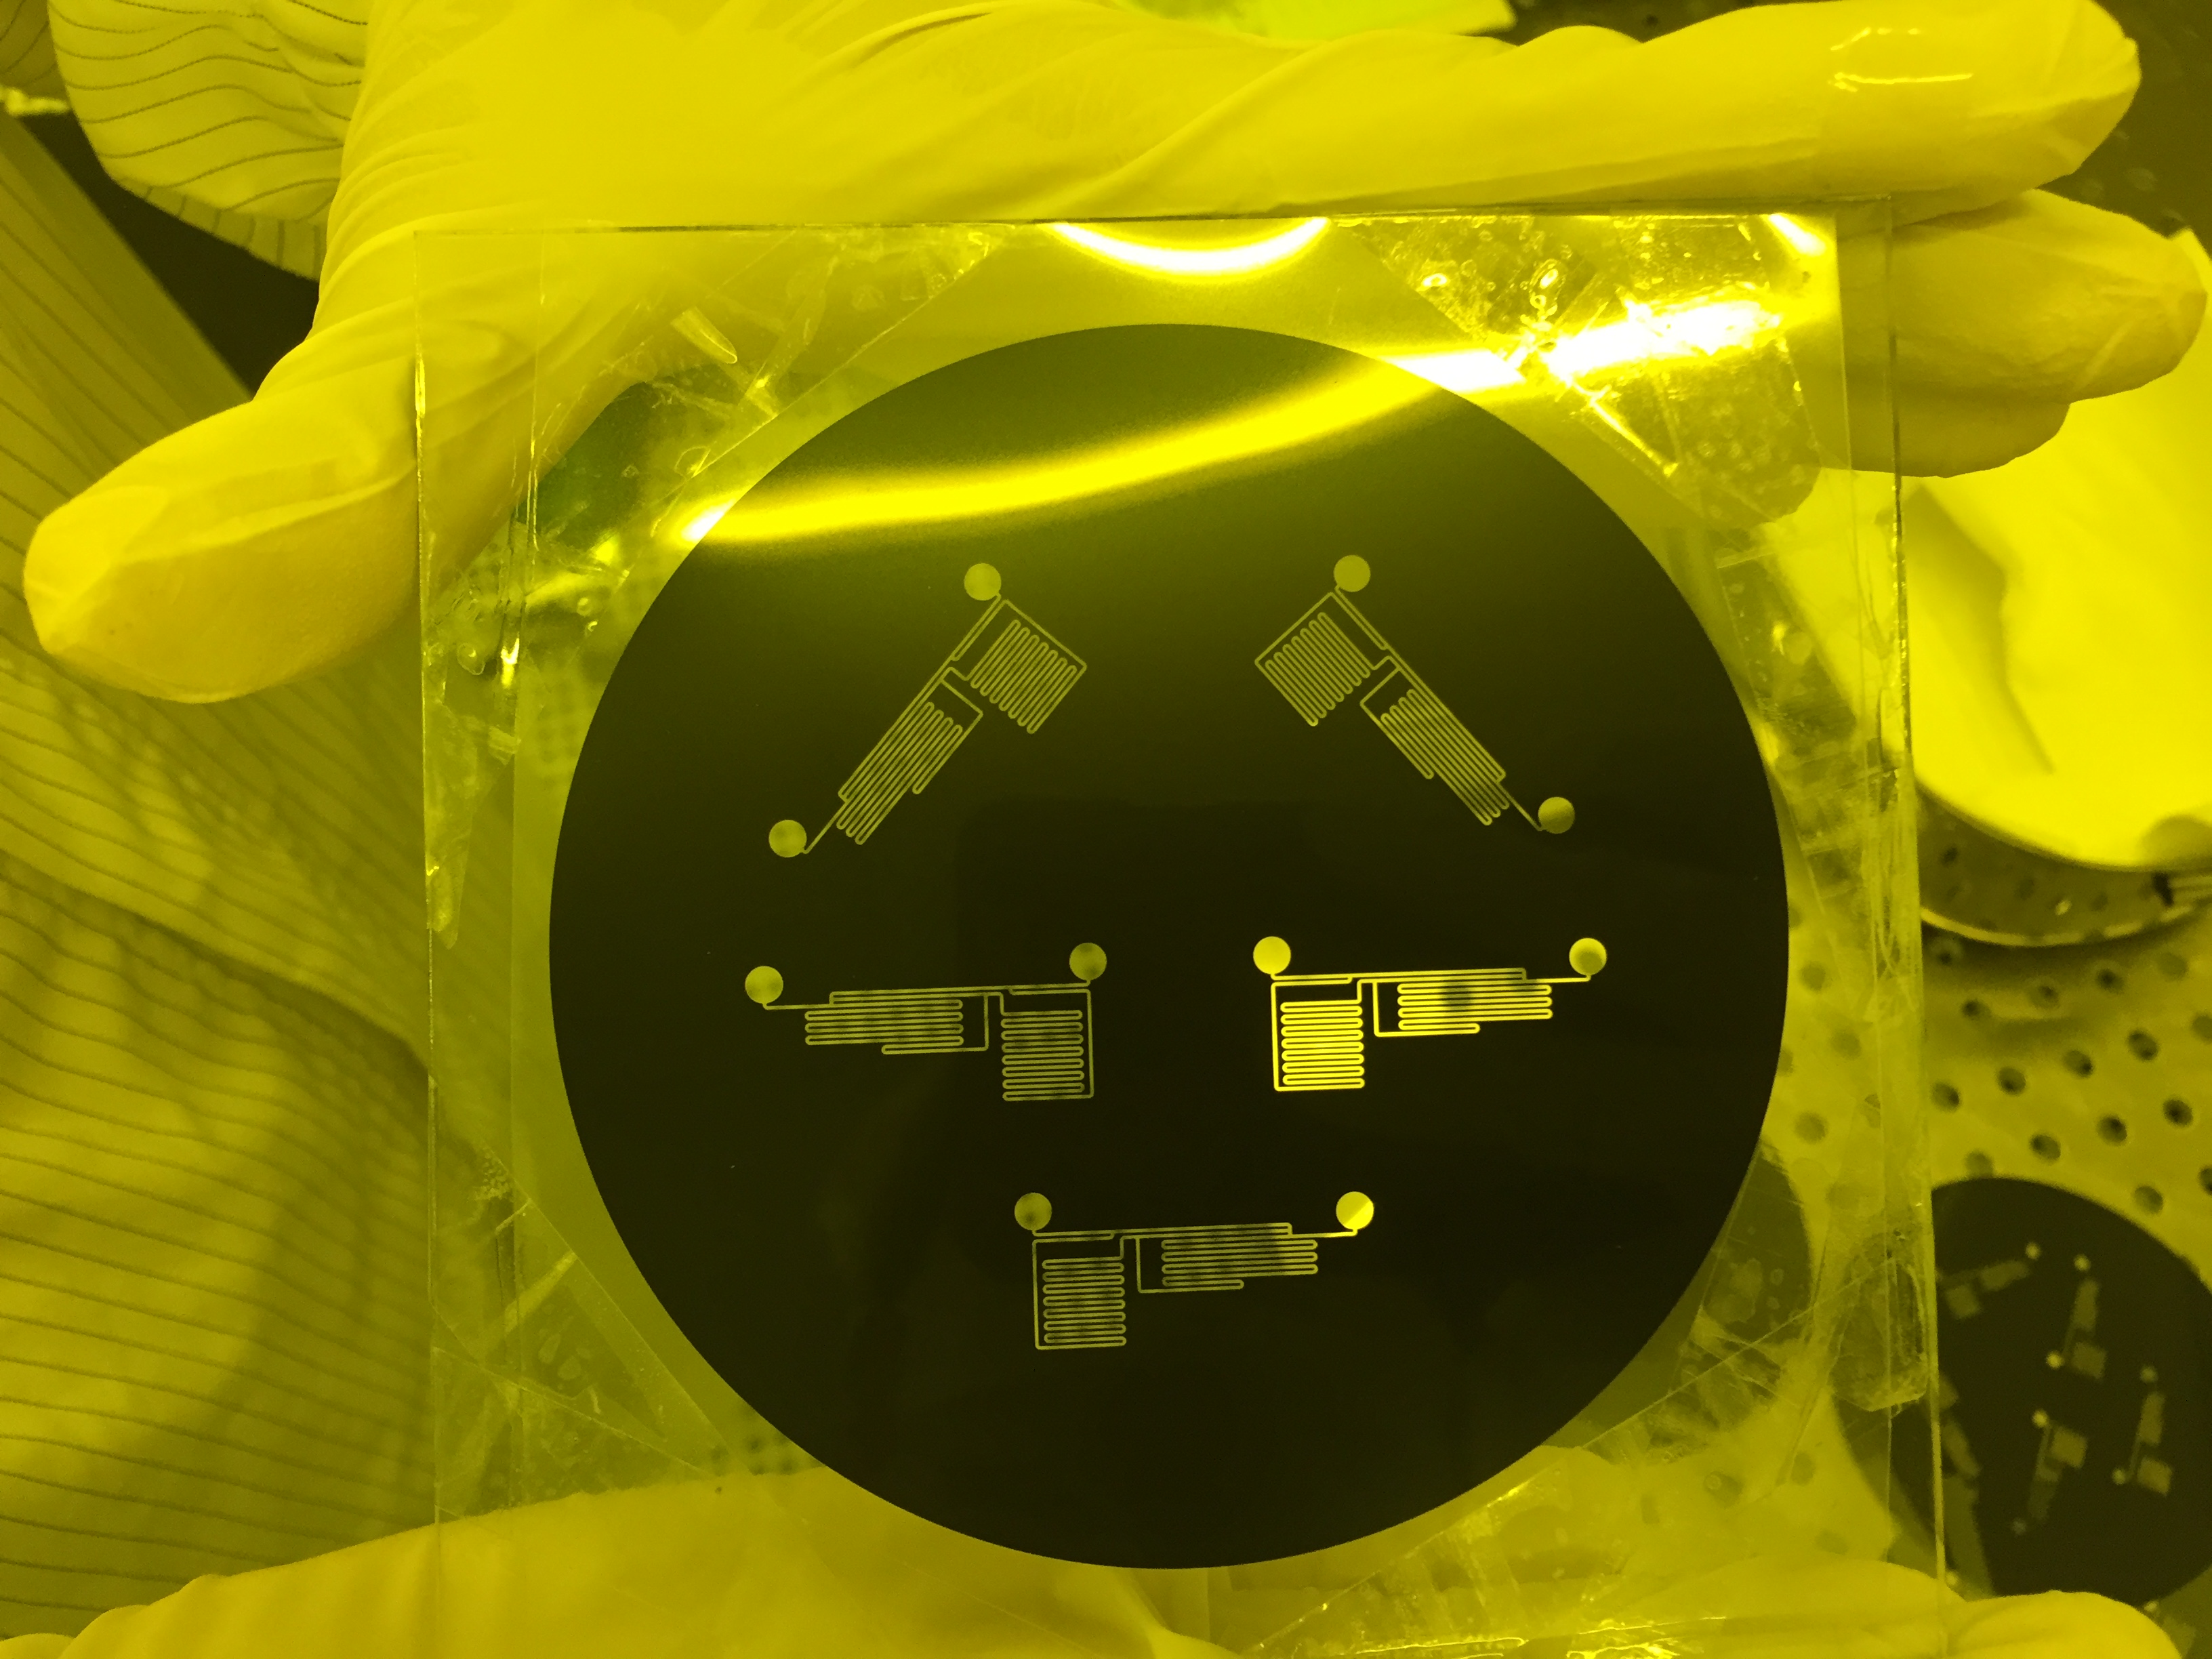
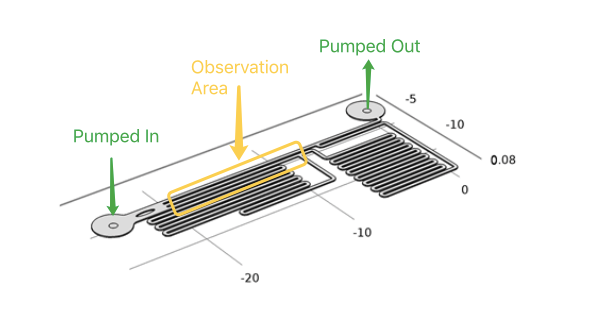
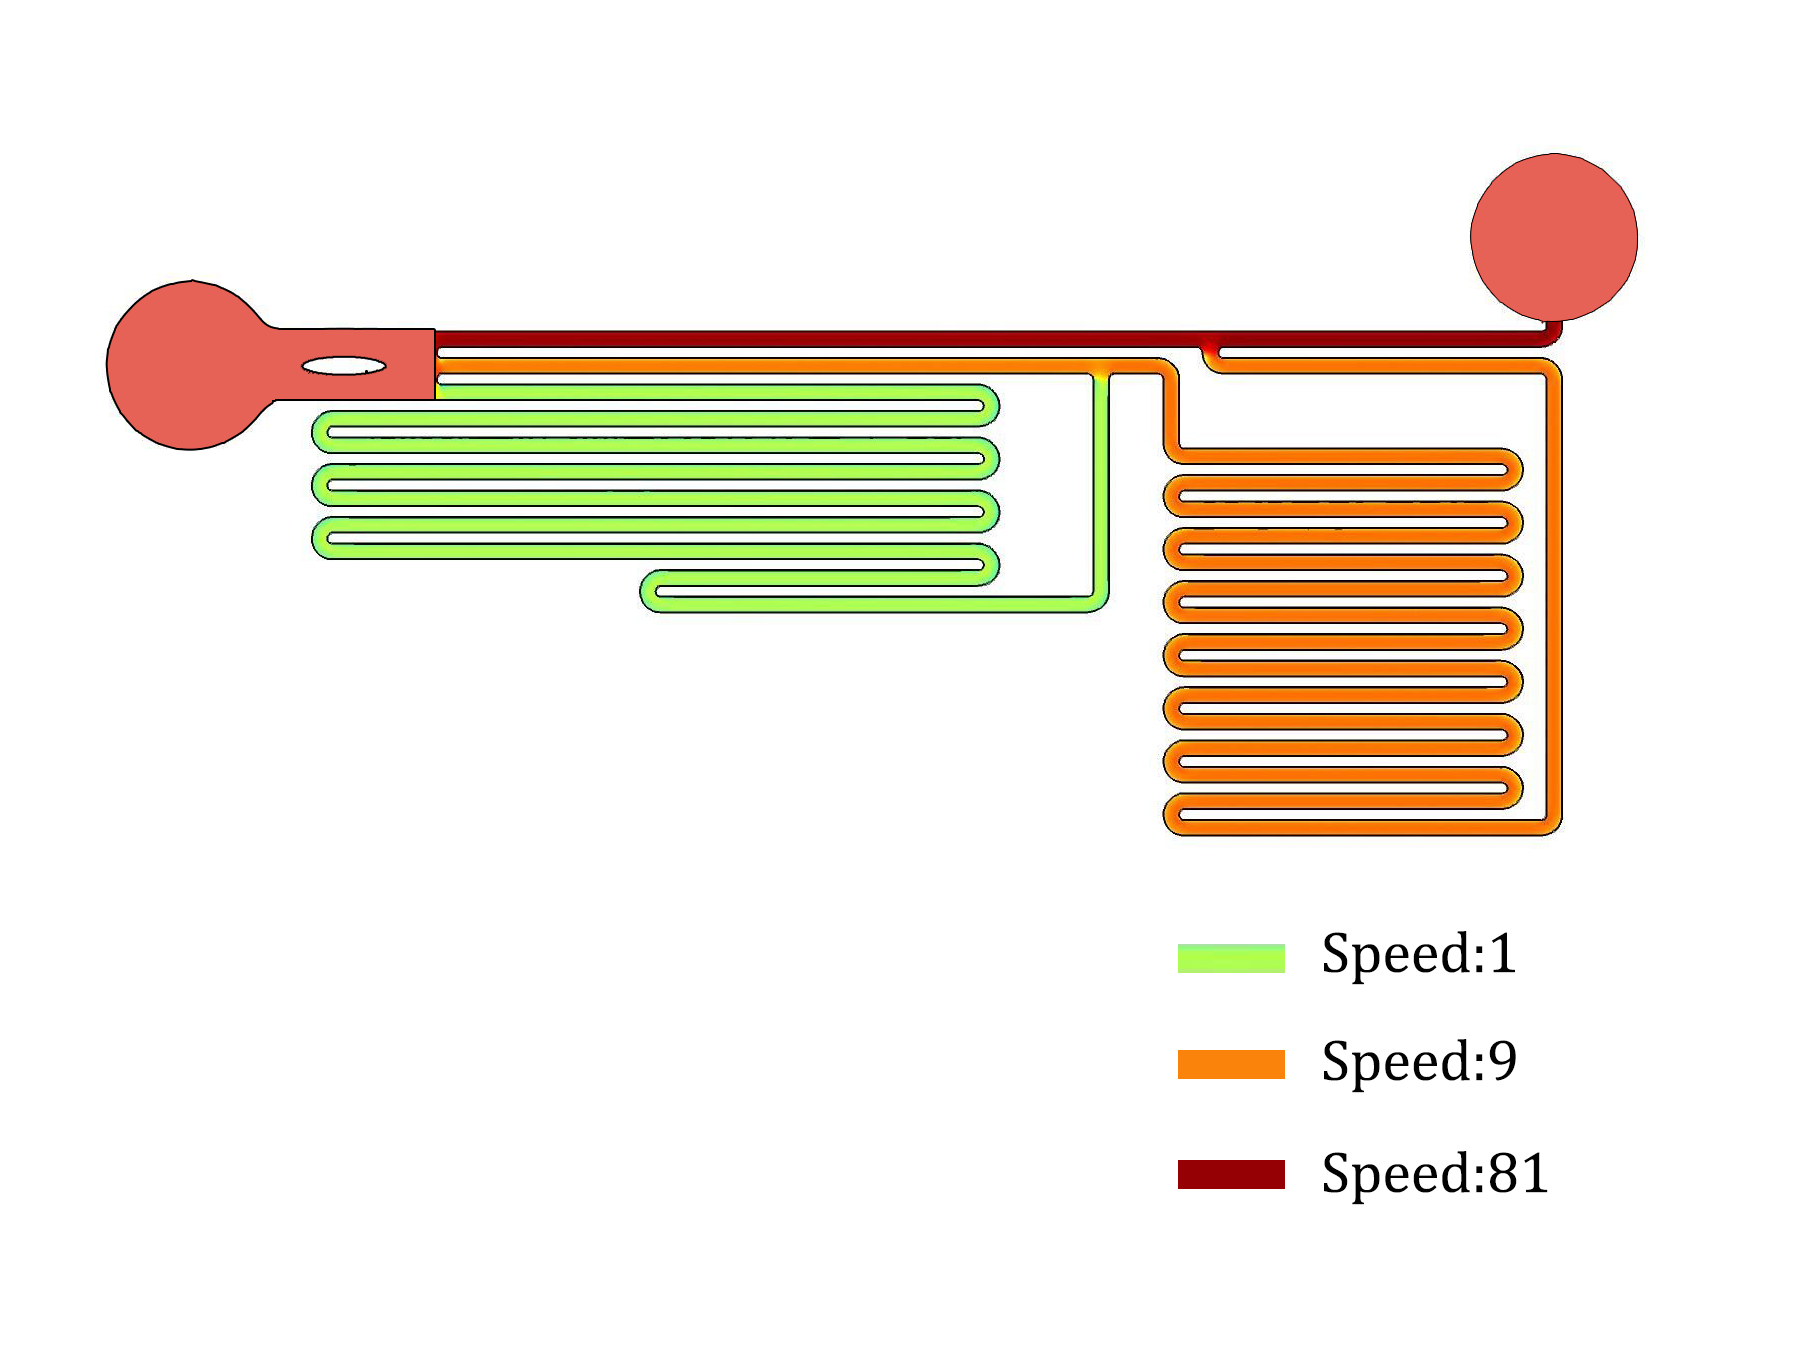
In order to speed up the shear force sweeping experiment, we would like to have parallel chambers with different flow speeds and shear forces in the same chip. After a number of design, fabrication and experiment cycles, we end up with this specifically designed microfluidics chip (Fig.3) so that the flow speeds inside three channels follow a 1:9:81 ratio (Fig.4). The flow rate ratio is determined by the channel branching and branching length. The channels are all with the same width and height, so that the flow rate is linear related to flow speed and shear force. The observation window is designed that three channels are parallel and just fit into the optical field of our Nikon Ti-E live cell imaging systems with a 10x NA0.45 objective and a Hamamatsu Orca Flash 4.0 sCMOS camera.
Microfluidics chips in our experiment were made with polydimethylsiloxane (PDMS) covalently bound on a glass slide. PDMS is the material widely used on fast prototyping microfluidic devices. PDMS chips are widely used in laboratories, especially in the academic community due to their low cost and ease of fabrication. Here are listed the main advantages of such chips: 1. Oxygen and gas permeability 2. Optical transparency, robustness 3. Non toxicity 4. Biocompatibility 5. No water permeability
One of the main drawbacks of PDMS chips is its hydrophobicity. Consequently, introducing aqueous solutions into the channels is difficult and hydrophobic analytes can be absorbed onto the PDMS surface. Fortunately, there are PDMS surface modification methods such as gas phase processing and wet chemical methods (or combination of both) to avoid hydrophobicity. After the fabrication, the microfluidics chips made of polydimethylsiloxane were treated with oxygen plasma for hydrophilic property. After this procedure, polydimethylsiloxane could bond to glass tightly, and channels in chips would be hydrophilic enough for medium to pass thorough. Immediately adding media also slows recovery to hydrophobicity of surface.
We programmed syringe pump to provide precise control over the total flow rate and thus flow rate of each channels. Therefore, shear force of any strength and duration can be applied to cells expressing MS channels. In our experiment, the flow will be maintained for about 2 min. Only after the cells have recovered from the last experiment (indicated by reverting to normal fluorescence intensity), would we start the next round of shear force stimulation.
During the experiment, the cells must be tightly adhered to the bottom of the channels. We coat the channels in the chip with gelatin, so that cell could adhere to the glass surface on the bottom of the channels.
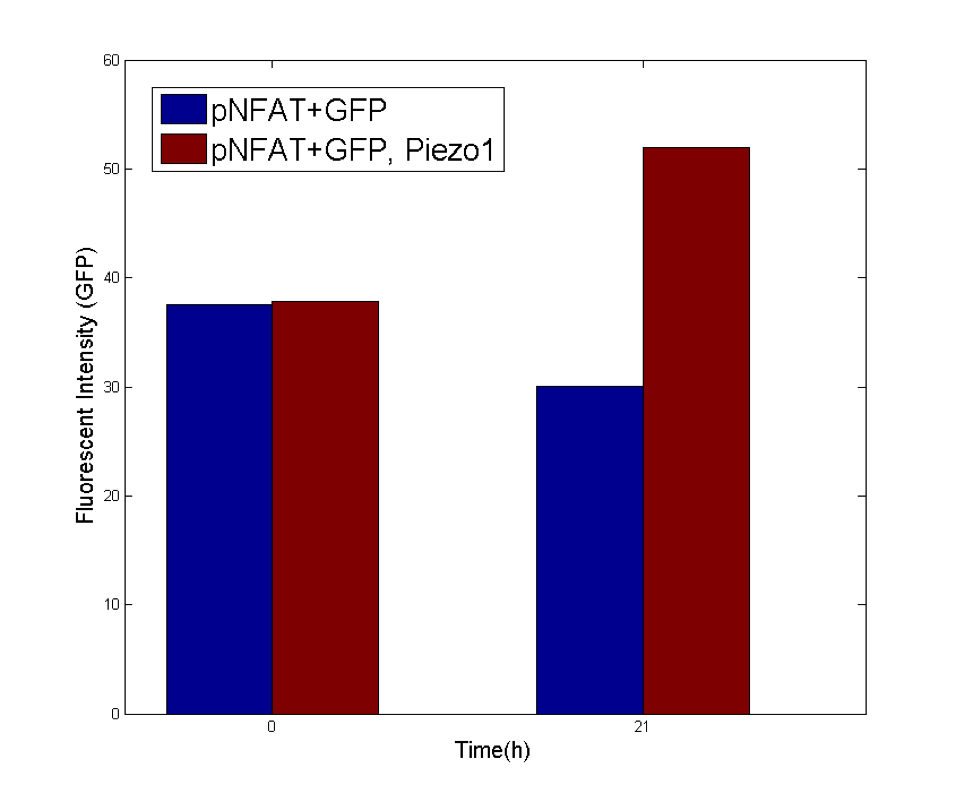
Cells expressing MS channels and R-GECO are injected to the chip inlet, and settled down. Once the cells adhere to the glass bottom of the channels, the microfluidics chip is clamped onto the live cell fluorescent imaging systems, so that the observation window is aligned with the optical field. With continuing observation of the R-GECO fluorescence (calcium signals), the syringe pump was set to different flow rates and durations to apply three given shear forces to cells in three channels. As calcium signals might not be synchronized among the cells in the same channel, we load the time-lapse fluorescent images load into customerized MATLAB script. We manually identify each cells. The fluorescent intensities for each cell are calculated over time. The increases in fluorescence intensities normalized over the control conditions are defined as the representation of calcium responses to shear forces for each cells (the detailed calculation is in the modeling session). To assess the sustained response to shear force, cell integrated with NFAT promoter driven GFP is used to detect signal downstream of Calcium-Calmodulin-Calcineurin, typically 20 hours after the onset of mechanical stimulation.
How to fabricate
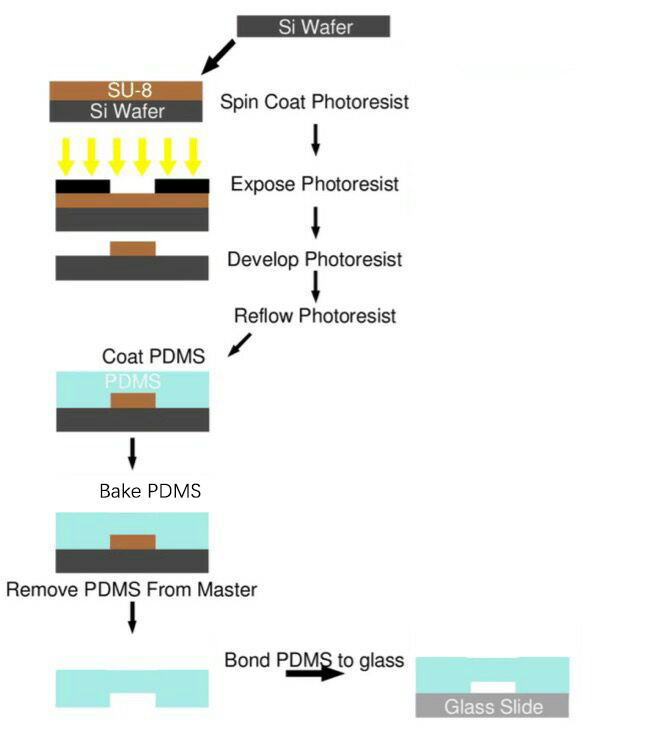
After studying existing papers about the processing technology typically used in microfluidics chips production, and endless trial-and-error, we have formed our own processing protocol based on our equipments and requirements. The microfluidics chips used in our project were all produced using this protocol (Fig. 5).
Process Overview
SU-8 Photoresist can cross-link to a network of polymer when exposed to short wavelength light. If the cross-linked network has formed, it cannot be dissolved by the SU-8 developer. So if we place a photo mask to shade the light shined on the photoresist, we can make a copy of the pattern on the photo mask.
Both PDMS and glass contain silicon element. When they were treated by oxygen plasma, unstable hydroxyl group will form on the treated surface. When they get close enough, two hydroxyl group will dehydrate and bond together covalently.
Sound Stimulation Devices
Acoustic Devices
Various devices generating frequencies from 300Hz to 1.7MHz were made to identify the most sensitive acoustic parameters for MS channels. The cytotoxic experiment of each device is determined from cell proliferation experiments with sound generator dipping into culture medium.
Audible Frequency
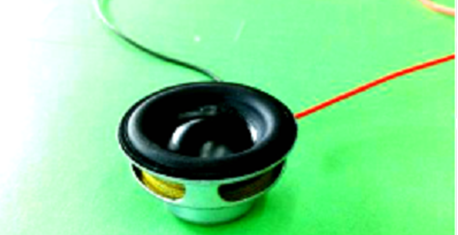
Audible sound is defined as 20Hz to 20kHz sound wave. We designed modulated devices to generate audile signals to stimulate cells. Three kinds of sound generators were used for generateing audible sonic stimulation. Each one has its specific range of frequency and power, as shown in the following table.
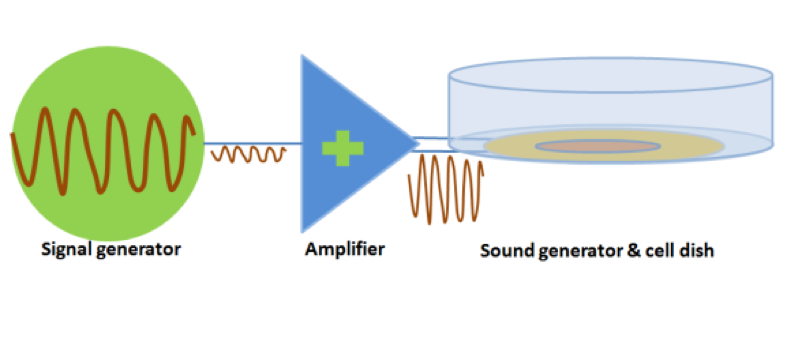
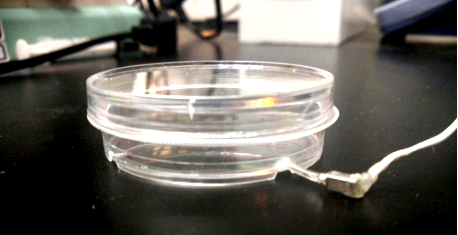
The signal was generated by a signal generator. After magnified by an amplifier, the signal was sent to a sound generator, which can be buzzer, balanced armature or speaker. As all of the three sound generators showed cell toxicity in some extent, sound generators were kept outside the cell dish and sonic stimulation was transmitted by air or polysterine plastics. Each one has its specific range of frequency and power which are shown in the following table.
Table 1 Three kinds of sound generators used for audible sonic stimulation
| Sound generator | Frequency | Power | Transmission medium | Evaluation |
|---|---|---|---|---|
| Buzzer | 3kHz-20kHz | 0-1W | PS plastic (cell dish) | Strong cell response at 15kHz and 20kHz. |
| Balanced armature | 1kHz-15kHz | 0-100mW | Air, water | No cell response observed. |
| Speaker | 300Hz-5kHz | 0-3.5W | Air, water | No cell response observed. |
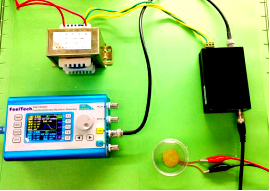
Fig. 8 Balanced Armature Sonic Stimulation Device and Speaker Used for Sonic Stimulation
Experiment Results
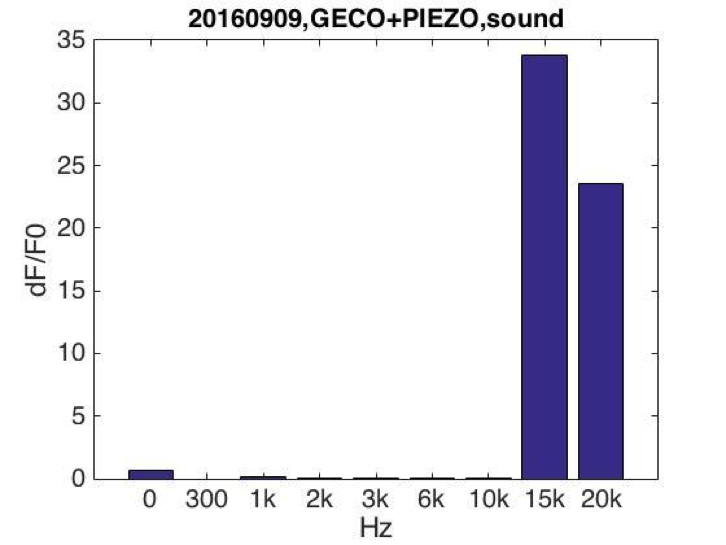
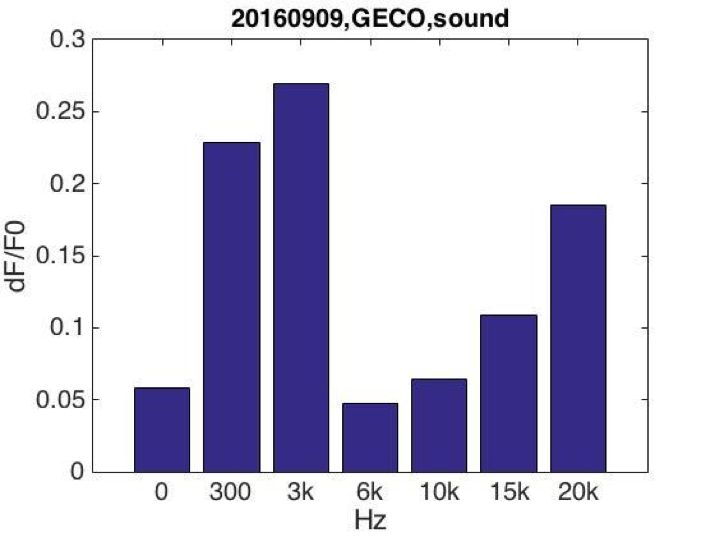
After testing all of the three sound generators above (Fig.8), we found that only buzzer induces obvious cell response, particularly in high frequency conditions (15kHz and 20kHz, shown in Fig.9). Polystyrene plastic medium is efficient to transmit energy to cell.
Fig. 9 Cell fluorescence response when stimulated by buzzer emitting sound of various frequencies (A) Cell fluorescence intensity increased greatly when stimulated by 15K and 20kHz sound. While no obvious fluorescence intensity changes when GECO cells (without MS channel) were stimulated (B).
Ultrasound devices
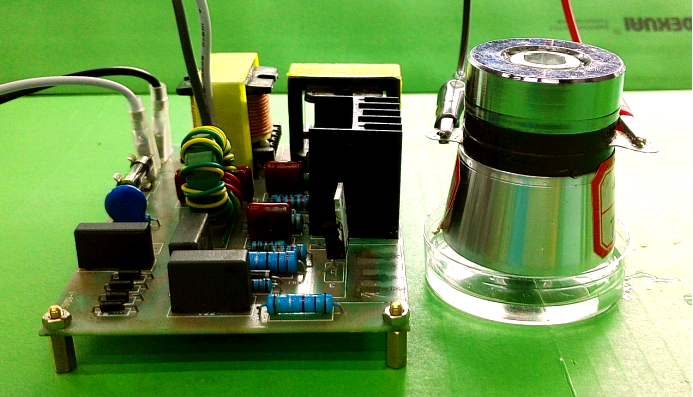
After seeing cell response in audible sonic frequency, we intend to determine the higher frequency using 4 types of ultrasonic devices we made. We did cytotoxicity experiment for each ultrasonic transducer for 20 hours. The experiment result was summarized in the following table.
| Device | Frequency & power | Description | Evaluation |
|---|---|---|---|
| Device1 | 28kHz 40W |
Large thermal power consumed. Low ultrasonic radiant power. Cell atoxic. |
No cell response observed. Quickly damaged. |
| Device2 | 108kHz 4.1W |
Calibrated, Quantitive stimulation. Programmable, Cell atoxic. |
Strong cell response observed. |
| Device3 | 1.1MHz Adjustable power |
Calibrated, Quantitive and power adjustable stimulation. Programmable, Cell atoxic. |
Weak cell response observed. |
| Device4 | 1.7MHz Adjustable power |
Power adjustable. Low Cytotoxicity. |
No cell response observed. |
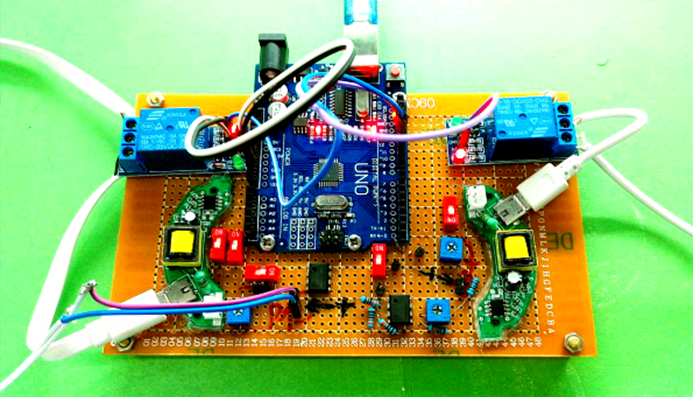
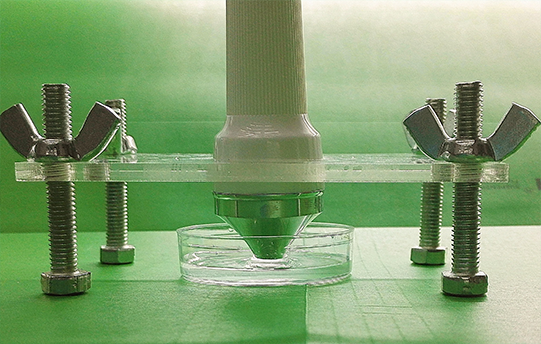
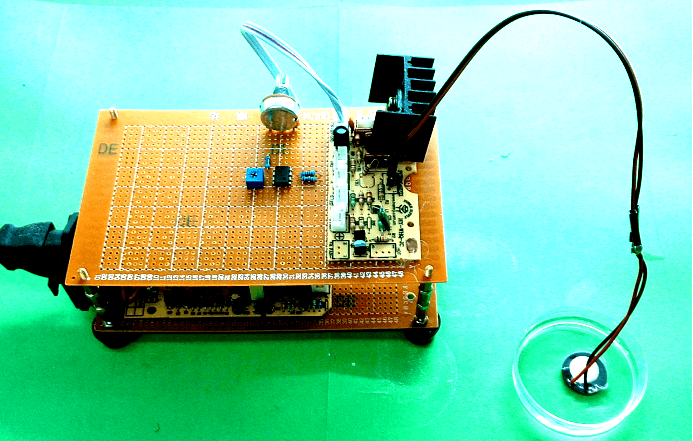
Fig. 10 Hardware established for ultrasonic stimulation. (A) Device1 (B)Device2 (C)Device3 (D) Device4
Experimental Results
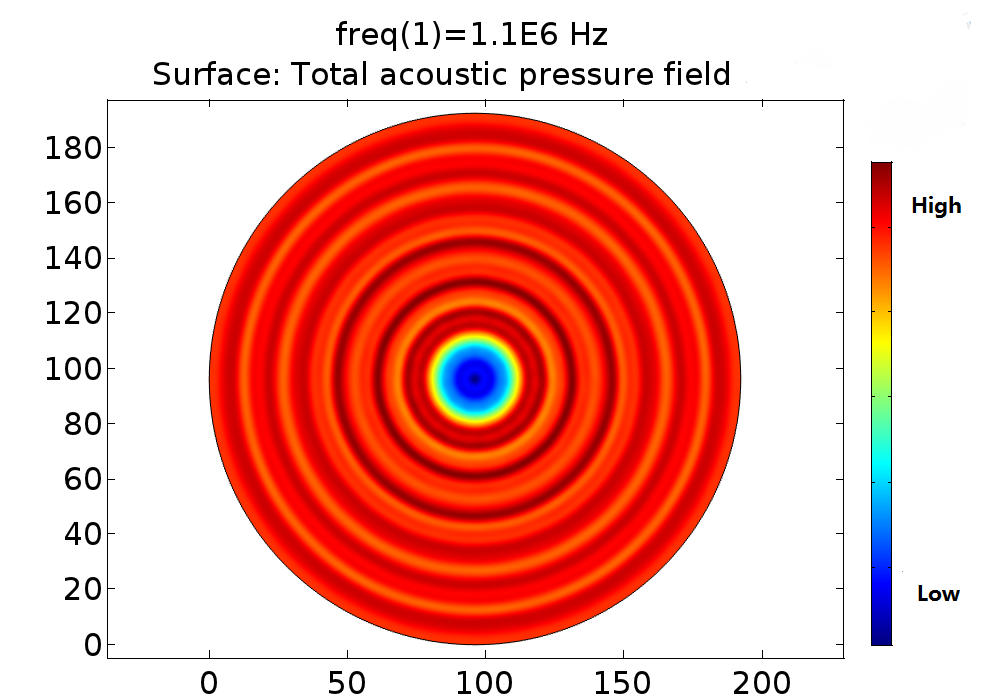
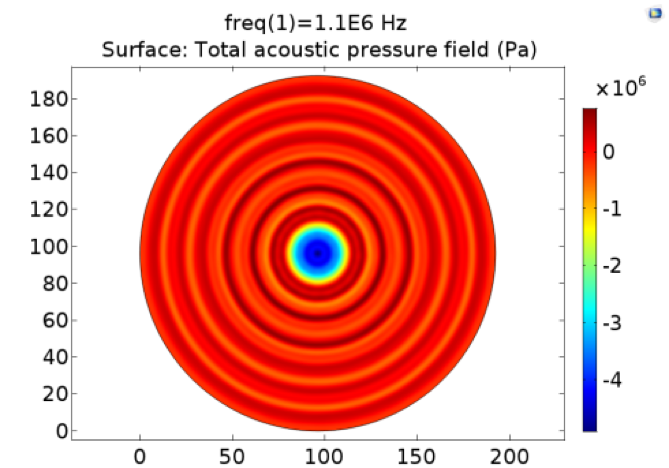
Pressure fields of 108kHz and 1.1MHz transducers were simulated for different power and distance. The pressure field distribution changes smoothly, while the pressure distribution was quite chaos in condition of 1.1MHz. Only strong cell response was observed for 108kHz condition as shown in Fig. 11.No obvious cell response was observed for 1.1MHz stimulation.
Fig. 11 A. Pressure distribution of 108kHz ultrasonic transducer the transducer was 1.0mm far above the cell layer, 251700 Pa was added to the transducer-water interface. B Pressure distribution of 1.1MHz ultrasonic transducer, the transducer was 1.0mm far above the cell layer. 60V voltage was input to drive the 1.1MHz transducer thus 528000 Pa was added to the transducer-water interface.
In experiment, 108kHz ultrasonic device induced a strong cell response as is shown in the following. However, no cell response was observed when cells were stimulated by 1.1MHz transducer.
Reference
- ↑ Lisa R. Volpatti, Ali K. Yetisen ( 2014). Commercialization of microfluidic devices. UK: Trends in Biotechnology.
- ↑ John W. Batts IVn. (2011). All about fittings, A pratical guide to using and understanding fittings in a laboratory environment. United States of America (USA): IDEX Health & Science LLC.
- ↑ Keith E. Herold and Avraham Rasooly (2009). Lab-on-a-Chip Technology (Vol. 1): Fabrication and Microfluidics | Book. United States of America (USA): Caister Academic Press.

